Overview
Introduction: Water (Chapter: Water, Class 7 Geography — Our Environment) explores the Earth's most vital resource: its forms, movement, distribution, use and management. The chapter explains how water supports life, shapes landscapes and sustains agriculture, industry and daily life. It introduces the water cycle, different sources of water (rain, rivers, lakes, ponds, glaciers, groundwater and oceans), and describes why water is unevenly distributed and sometimes scarce. Importance: The chapter highlights water’s central role in health, food production, sanitation and ecosystems. It shows how shortage and pollution of water affect people, plants and animals, and why conservation and proper management are essential for a sustainable future. Key themes: - The water cycle (evaporation, condensation, precipitation, collection) and how it keeps water circulating on Earth. - Sources of water and how groundwater and surface water are connected. - Distribution of water on Earth and in India — why some areas face abundance while others face scarcity. - Uses of water: domestic, agricultural, industrial and ecological needs. - Causes and impacts of water scarcity and water pollution. -…
Learning Objectives
- Define water and state its importance for life, agriculture and industry.
- Identify major sources of water (rainfall, rivers, lakes, groundwater, glaciers) and mark them on a map.
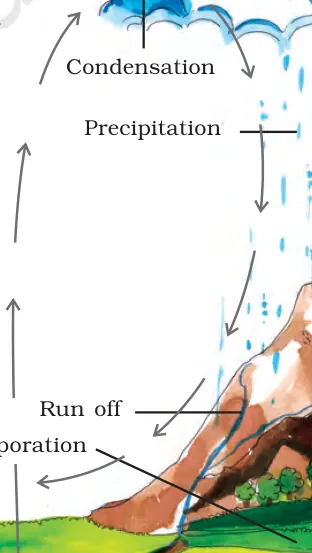
- Describe the water cycle and explain the processes of evaporation, condensation, precipitation and runoff.
- Explain how rivers are formed and describe the characteristics of the upper, middle and lower courses of a river.
- Draw and label a simple diagram of the water table, distinguishing between the zone of saturation and the zone of aeration, and explain recharge and discharge.
- Compare surface water and groundwater with respect to availability, quality and common uses.
- Interpret a simple hydrograph or seasonal river flow graph to explain variations in discharge during a year.
- Analyze the causes and consequences of water scarcity and outline exam-relevant measures to conserve water.
Topics in this chapter
18 topics · tap a topic title to jump straight to it.
Importance of Water
Water is a basic natural resource essential for all forms of life and for many human activities. Without water, plants, animals and humans cannot survive; crops cannot grow; industries cannot operate; and ecosystems cannot function.
Key roles of water
- Life and health: Water is required for drinking, digestion, body temperature regulation and hygiene. Clean water prevents waterborne diseases.
- Agriculture and food production: Water is needed for growing crops and rearing livestock (irrigation, watering, food processing).
- Industry and economy: Many industries (textiles, chemicals, food processing, power plants) need water for manufacturing and cooling.
- Energy: Hydropower and cooling for thermal and nuclear power plants depend on water.
- Ecosystems and biodiversity: Rivers, lakes, wetlands and groundwater support plants, fish and wildlife and maintain environmental balance.
- Transport and recreation: Rivers and coasts are used for transport, fishing and recreation (boating, swimming).
- Climate regulation: Water bodies and the water cycle influence local and global climate (evaporation, rainfall patterns).
Availability facts (for classroom reference)
- About 97% of Earth’s water is saline (in oceans). Only about 2.5–3% is freshwater.
- Of the freshwater, most is locked in glaciers and ice caps (~68–70%) and a large share is groundwater (~30%). Surface water (rivers, lakes) and easily accessible freshwater make up a very small fraction (around 1% of freshwater), so usable water is limited.
Why conserving water matters
- Population growth and increased use for agriculture and industry are reducing per-person water availability in many places.
- Overuse of groundwater leads to falling water tables and wells running dry.
- Poor sanitation and contaminated water cause diseases; floods and droughts cause loss of life and crops.
Practical steps to protect and manage water
- Use water-saving methods in agriculture (drip irrigation, mulching) and at home (shorter showers, fix leaks).
- Collect rainwater (rainwater harvesting) and recharge groundwater through percolation pits and check dams.
- Treat and reuse wastewater where possible; protect rivers, lakes and wetlands from pollution.
- Plant trees and maintain watersheds to reduce runoff and increase groundwater recharge.
Understanding the importance of water and practising conservation helps ensure that future generations will have enough clean water for life, food production and sustainable development.
- A farmer uses drip irrigation to grow vegetables and reduces water use compared to flood irrigation.
- A city installs rainwater harvesting on apartment buildings to recharge groundwater and supply non-drinking water needs.
- A region facing groundwater depletion (e.g., parts of northwestern India) restricts certain water-intensive crops and adopts crop rotation.
- Chennai’s water shortages (2019) highlighted the need for better water management, storage and rainwater harvesting in cities.
- Hydropower dams use river water to generate electricity, supporting homes and industries but also requiring careful environmental planning.
- Contaminated drinking water in a locality causes outbreaks of diarrhoea; providing clean piped water and sanitation controls disease spread.
- Per capita renewable water availability = Total renewable freshwater resources / Population
- Percentage (e.g., share of freshwater) = (Part / Whole) × 100
- Sectoral water use (%) = (Water used by a sector / Total water used) × 100
- Approximate runoff volume = Rainfall × Runoff coefficient × Area (useful for simple watershed estimates; coefficient depends on land surface and slope)
Distribution of Water on Earth
Water on Earth is not evenly distributed. Most of the planet's water is saline (salt) and is found in the oceans, while only a small fraction is fresh water that humans, animals and most plants can use directly.
Main breakdown:
- About 97% of Earth's water is in the oceans (salt water) and is not directly usable for drinking or irrigation without treatment (desalination).
- Only about 3% of Earth's water is fresh water.
Breakdown of the freshwater (approximate):
- About ~69% of fresh water is locked up as ice and snow in glaciers and polar ice caps (for example: Greenland, Antarctica, Himalayan glaciers).
- About ~30% is groundwater stored under the soil in aquifers and rocks — this supplies many wells and tube wells.
- Only about ~1% of fresh water is easily accessible on the surface (rivers, lakes, reservoirs), plus a very tiny amount in soil moisture and atmosphere.
Why this distribution matters:
- Although Earth has abundant water overall, the small accessible portion of fresh water must support drinking needs, agriculture, industry and ecosystems.
- Freshwater is not evenly distributed over regions or seasons. Some areas (e.g., polar regions) have plenty of water locked in ice, while others face shortage despite high rainfall variability.
- Human actions—overuse of groundwater, pollution, and melting of glaciers due to climate change—affect the quantity and quality of usable water.
Connection with the Water Cycle: The water cycle (evaporation, condensation, precipitation, runoff, infiltration) moves water between oceans, atmosphere, land and ice. The cycle keeps water renewed, but local availability depends on where and how water is stored.
Key points for students:
- Most water is in oceans and is saline; desalination is expensive.
- Only a small share of fresh water is accessible as rivers and lakes.
- Groundwater is an important fresh water source but can be depleted.
- Glaciers act as long-term freshwater storage and feed many rivers (e.g., Himalayan glaciers feeding the Ganga and Indus).
- Himalayan glaciers feed major rivers in India (Ganga, Yamuna, Indus). If glaciers melt faster than they replenish, river flow patterns change and downstream water supply is affected.
- In many parts of north-west India (Punjab, Haryana, Rajasthan), farmers use tube wells to pump groundwater for irrigation. Over decades this has lowered the groundwater table, causing wells to run dry and increasing the cost of pumping.
- The ocean contains most of the planet's water, but coastal cities cannot drink seawater without desalination. Desalination plants (e.g., in some Gulf countries) are expensive and energy-intensive.
- Lakes and rivers hold only a tiny fraction of fresh water, yet they supply most cities. For example, municipal supply often relies on nearby rivers or reservoirs; pollution of these sources immediately affects public supply.
- Percentage (part of whole): percentage = (part / whole) × 100. Example: if fresh water volume = 3 units and total water = 100 units, fresh water % = (3/100)×100 = 3%.
- Per capita water availability (annual): per capita = (Total renewable freshwater resources) / (Population). Example: if region has 10,000 million m3 and population is 50 million, per capita = 10,000 ÷ 50 = 200 m3/person/year.
- Groundwater decline rate (simple): annual decline = (initial water level − current water level) / number of years. Units could be metres/year for water-table depth.
- Water use efficiency (%) = (useful water delivered for productive purposes / total water withdrawn) × 100. Example: If irrigation delivers 40 m3 of crop-use water from 100 m3 withdrawn, efficiency = (40/100)×100 = 40%.
The Water Cycle (Hydrological Cycle)
What is the Water Cycle?
The water cycle (or hydrological cycle) is the continuous movement of water on, above and below the surface of the Earth. It describes how water changes states (liquid, vapor, solid) and moves between reservoirs such as oceans, atmosphere, land, rivers and underground aquifers.
Main stages of the water cycle
- Evaporation — Liquid water from oceans, lakes, rivers and soil turns into water vapor when heated by the Sun. Example: water disappearing from a puddle on a sunny day.
- Transpiration — Plants release water vapor from leaves into the air. Evaporation + Transpiration is often called evapotranspiration.
- Condensation — Water vapor cools in the atmosphere and forms tiny water droplets or ice crystals, creating clouds and fog.
- Precipitation — When droplets/ice crystals grow large enough, they fall as rain, snow, sleet or hail and return water to the Earth’s surface.
- Infiltration and Percolation — Some precipitation soaks into the soil (infiltration). Water moves down through soil and rock layers to recharge groundwater (percolation).
- Surface Runoff — Water that does not infiltrate flows over the land into rivers, lakes and finally the oceans.
- Collection/Storage — Water is stored temporarily in oceans, glaciers, lakes, soils and underground aquifers before the cycle continues.
Why it matters
The water cycle controls weather and climate, supplies freshwater for drinking, farming and industry, supports ecosystems, and recharges groundwater resources.
Human impacts
Deforestation, urbanization (paved surfaces), excessive groundwater pumping and climate change change evaporation, infiltration and runoff patterns — causing floods, droughts, reduced groundwater recharge and altered rainfall patterns.
Key vocabulary: evaporation, transpiration, condensation, precipitation, infiltration, percolation, runoff, groundwater, aquifer, evapotranspiration.
- A puddle disappears after a sunny morning — evaporation turns the water into vapour.
- Dew forms on grass early in the morning — water vapour condenses as temperature drops.
- Snow melting in the mountains feeds rivers in spring — precipitation stored as snow becomes surface runoff.
- Cutting down a forest increases surface runoff and reduces groundwater recharge — less water infiltrates into soil.
- City streets cause faster runoff after rain because concrete prevents infiltration, often causing floods.
- Farmers pumping too much groundwater for irrigation lowers the water table, reducing spring flow and well yields.
- Evapotranspiration (ET) = Evaporation (E) + Transpiration (T). Explanation: total water transferred from land to atmosphere.
- Simple water-balance (for an area and time period): Precipitation (P) = Evapotranspiration (ET) + Runoff (R) ± Change in Storage (ΔS). Explanation: all incoming water (P) is either returned to atmosphere (ET), leaves as runoff, or changes stored water (soil moisture, groundwater).
- Basic infiltration rate (average): f = V / (A × t). Explanation: f = infiltration rate (depth/time), V = infiltrated volume, A = area, t = time. Useful for estimating how fast water soaks into soil.
Oceans and Seas
What are Oceans and Seas?
Oceans are vast continuous bodies of salt water that cover about 71% of the Earth’s surface. There are five oceans: the Pacific, Atlantic, Indian, Southern (or Antarctic) and Arctic. Seas are smaller than oceans and are usually partly enclosed by land. Examples include the Mediterranean Sea, Arabian Sea and Bay of Bengal.
Differences between Oceans and Seas
- Size: Oceans are larger; seas are smaller and often partly enclosed by land.
- Depth: Oceans are generally deeper; seas are shallower and often lie on continental shelves.
- Connection: Seas may be connected to an ocean and have more variation in salinity and temperature due to rivers and land influence.
Structure of an Ocean (basic parts)
- Continental shelf – gently sloping area close to land, rich in life and resources.
- Continental slope – steep slope leading down from the shelf.
- Abyssal plain – deep, flat ocean floor.
- Ocean trenches – deepest parts (e.g., Mariana Trench).
Physical Characteristics
- Salinity: Average sea water salinity ≈ 35 parts per thousand (ppt) or 3.5%.
- Temperature: Surface temperature depends on latitude and currents; decreases with depth. A thermocline is a layer where temperature falls quickly with depth.
- Density and pressure: Water density increases with salinity and decreases with temperature; pressure increases with depth.
Ocean Zones (by depth and light)
- Sunlight (epipelagic) zone: upper layer where sunlight supports photosynthesis and most marine life.
- Twilight (mesopelagic) zone: light fades; fewer plants, more specialized animals.
- Midnight (bathypelagic and deeper) zones: no sunlight, creatures adapted to darkness and high pressure.
Ocean Movements
- Waves: caused mainly by wind; the energy moves across the surface.
- Currents: large-scale flows of water driven by wind, differences in water density and the Earth’s rotation (Coriolis effect). Example: Gulf Stream.
- Tides: regular rise and fall of sea level caused mainly by the gravitational pull of the Moon and Sun; spring and neap tides occur due to the relative positions of Moon, Sun and Earth.
Importance of Oceans and Seas
- Climate regulation: oceans store and distribute heat, influencing weather and climate (e.g., monsoon patterns in the Indian Ocean).
- Biodiversity and food: support many plants and animals; fisheries provide protein for millions.
- Transport and trade: shipping routes across oceans connect countries (Suez and Panama canals are key shortcuts).
- Resources: minerals, oil and gas (offshore drilling), and potential renewable energy (tidal, wave).
Threats and Conservation
- Pollution: plastic waste, oil spills and chemical runoff harm marine life.
- Overfishing: reduces fish stocks and harms food chains.
- Climate change: warming causes sea level rise, coral bleaching and changes in currents.
- Conservation: marine protected areas, sustainable fishing, reducing plastic use and pollution controls are important steps.
Quick facts
- Largest ocean: Pacific Ocean. Deepest point: Mariana Trench in the Pacific (~11,034 m).
- Warmest ocean: Indian Ocean (surface waters are relatively warm).
- Average salinity: ~35 ppt (3.5%).
- Pacific Ocean: the largest ocean, contains the Mariana Trench (deepest point on Earth).
- Atlantic Ocean: known for the Gulf Stream current that warms northwestern Europe.
- Indian Ocean: influences the South Asian monsoon; warmer surface waters than the Atlantic and Pacific at similar latitudes.
- Mediterranean Sea: almost enclosed by land; has higher salinity in some parts because of evaporation.
- Bay of Bengal: prone to cyclones and heavy river inflow, so it has varying salinity and large sediment deposits.
- Grand Banks (off Newfoundland): a rich fishing ground historically important for cod fisheries; shows effects of overfishing.
- Salinity (%) = (mass of dissolved salts / mass of seawater) × 100. Example: 35 g salts in 1000 g seawater → 35/1000×100 = 3.5%.
- Parts per thousand (ppt) to percent: 1 ppt = 0.1%. So 35 ppt = 3.5%.
- Hydrostatic pressure with depth: P = P0 + ρ g h, where P0 = atmospheric pressure at surface, ρ = density of seawater (≈1025 kg/m³), g ≈ 9.8 m/s², h = depth (m).
- Wave speed in shallow water: c = √(g × h), where c is speed (m/s), g = 9.8 m/s², h = water depth (m).
- Volume of a sea/ocean region (approx): Volume = Area × Average depth. Useful for estimates of water volume.
Sources of Fresh Water
What are sources of fresh water? Sources of fresh water are natural or man-made places from which humans, animals and plants obtain water that is low in dissolved salts and safe for most uses. Fresh water is essential for drinking, irrigation, industry and ecosystems.
Main natural sources
- Rivers and streams: Flowing surface water that collects rainfall, melting snow and groundwater. Rivers supply water to cities, farms and industries (e.g., the Ganga, Brahmaputra, and Godavari).
- Lakes and ponds: Standing bodies of fresh water that store rain or river water (e.g., Loktak Lake). Smaller ponds are important for local water needs and biodiversity.
- Glaciers and snowfields: Huge stores of frozen fresh water in mountains. When they melt seasonally, they feed rivers and maintain flows during dry months (e.g., Himalayan glaciers feeding northern rivers).
- Groundwater: Water stored underground in soil and rock layers (aquifers). People access it by wells, tube wells and boreholes. Groundwater is a major source in rural and agricultural areas.
- Springs: Places where groundwater naturally comes to the surface. Springs often form at hillsides and are a local source of fresh water.
- Rainwater: Direct capture of rainfall via roofs and catchments (rainwater harvesting) provides a local fresh water source.
- Reservoirs and tanks: Man-made lakes created by dams are used to store river water for irrigation, power and supply (e.g., Bhakra Nangal, Tehri).
Characteristics and distribution
Fresh water is unevenly distributed over the Earth. Much of the world's fresh water is frozen in glaciers and ice caps. Only a small fraction is available as surface water and accessible groundwater. Seasonal rainfall patterns (monsoon) and melting snow cause large variations in river flows and lake levels.
Human uses and challenges
- Uses: drinking, cooking, washing, irrigation, industry, and maintaining ecosystems.
- Challenges: overuse and depletion of groundwater, pollution of rivers and lakes, shrinking glaciers due to climate change, and unequal access to safe water.
Conservation and management
Methods to protect and increase fresh water availability include: rainwater harvesting, recharge of groundwater (recharge pits, percolation tanks), preventing pollution, efficient irrigation (drip irrigation), and protecting watersheds and forests that help regulate water flow.
Simple way to think about water sources: Surface water (rivers, lakes, reservoirs) provides easily accessible supply but varies seasonally; groundwater provides steady supply but can be invisible and slow to refill; glaciers are long-term stores; rainwater is local and must be captured.
- Ganga River supplying water for drinking, irrigation and religious activities in northern India.
- Bhakra Nangal Reservoir used for irrigation and hydropower in Punjab and Haryana.
- Himalayan glaciers feeding the Indus, Ganga and Brahmaputra rivers during summer melt.
- Traditional wells and modern tube wells in Punjab and Uttar Pradesh providing groundwater for irrigation.
- Rainwater harvesting in Chennai and Bengaluru to recharge groundwater and supplement supplies.
- Loktak Lake (Manipur) as an example of a large freshwater lake supporting fisheries and local livelihoods.
- Volume of water in a water body = Surface area × Average depth (V = A × d). Useful to estimate water stored in ponds or small lakes.
- Rainwater harvestable (m³) = Roof area (m²) × Rainfall (mm) × Runoff coefficient / 1000. Example: 100 m² roof, 800 mm rain, coefficient 0.8 → 100 × 800 × 0.8 / 1000 = 64 m³.
- Runoff volume (m³) = Rainfall (mm) × Catchment area (m²) × Runoff coefficient / 1000. Helps estimate how much rain becomes river flow.
- Per capita renewable freshwater (m³/person) = Total renewable freshwater available (m³) / Population. Used to assess water availability per person.
- Aquifer storage (m³) ≈ Porosity × Aquifer volume (V_aquifer). Porosity is the fraction of void space in rock/soil that can store water.
Rivers and Drainage Systems
Introduction
Rivers are natural flowing bodies of water that drain the land and move water from higher elevations to seas, lakes or other rivers. A drainage system consists of a main river and all its tributaries that collect and carry surface water from a particular area.
Key terms
- Source (Headwaters): The place where a river begins (spring, glacier, lake).
- Mouth: Where a river empties into another water body (sea, lake).
- Tributary: A smaller stream joining a larger river.
- Confluence: Point where two streams meet.
- Drainage basin (Catchment): Area drained by a river and its tributaries.
- Watershed (Divide): Boundary separating two drainage basins.
Stages of a river
- Upper course: Near the source, steep gradient, vertical erosion dominates — features: V-shaped valleys, rapids, waterfalls.
- Middle course: Gradient decreases, both erosion and deposition occur — features: wider valleys, meanders.
- Lower course: Gentle gradient, deposition dominates — features: floodplains, deltas, oxbow lakes, estuaries.
Processes
Erosion (vertical, lateral, headward), transportation (traction, saltation, suspension, solution) and deposition are the main processes that shape rivers and their landforms.
Drainage patterns (how streams are arranged):
- Dendritic: Tree-like pattern on uniform material (common in plains/plateaus).
- Radial: Streams radiate from a central high point (volcanoes or domes).
- Trellis: Parallel main streams with short tributaries joining at right angles (folded mountains).
- Rectangular: Streams follow jointed or faulted rocks producing right-angle bends.
- Parallel: Long parallel streams on steep slopes.
- Centripetal: Streams flow into an interior basin or lake.
Major river systems (India examples)
- Himalayan rivers: Indus, Ganga, Brahmaputra — long, fed by snow and rainfall, large drainage basins, perennial flow.
- Peninsular rivers: Godavari, Krishna, Kaveri, Mahanadi, Narmada, Tapi — shorter, seasonal, mostly rain-fed.
- Special cases: Narmada and Tapi flow westwards through rift valleys; many peninsular rivers form deltas on the east coast.
Landforms formed by rivers
- Meanders and oxbow lakes: Bends that become more pronounced and may be cut off to form oxbow lakes.
- Floodplains and levees: Flat areas built by repeated deposition; natural levees form near the channel.
- Deltas: Depositional plains at the mouth where river meets a standing body of water (e.g., Ganga-Brahmaputra delta — Sundarbans).
- Estuaries: Tidal mouths where river and sea mix.
Importance of rivers
Provide water for drinking, irrigation, industry; navigation; hydroelectric power; fertile soils for agriculture; habitats for biodiversity; cultural and economic value.
Problems and conservation
Flooding, river pollution, over-extraction, siltation and habitat loss are common problems. Conservation measures include afforestation of watersheds, controlling pollution (sewage treatment), sustainable water use, floodplain zoning and river basin management (e.g., Namami Gange programme for cleaning the Ganga).
Summary
Rivers shape the landscape through erosion, transportation and deposition. Drainage systems and patterns tell us about the geology and slope of the land. Understanding how rivers behave helps in managing water resources and reducing disaster risk.
- Ganga-Brahmaputra Delta (Sundarbans) — a large and fertile delta formed by deposition where rivers meet the Bay of Bengal.
- Narmada River flowing through a rift valley between the Vindhya and Satpura ranges — an example of a westward-flowing peninsular river.
- Brahmaputra braided channels — wide, shifting channels with sandbars formed by heavy sediment load and variable flow.
- Formation of oxbow lakes in the lower course of large meandering rivers such as parts of the Ganga.
- Hirakud Dam on the Mahanadi and Bhakra Nangal on the Sutlej — examples of large river valley projects used for irrigation and hydroelectricity.
- 2018 Kerala floods — heavy rainfall and saturated river basins caused rivers to overflow, illustrating flood hazards when drainage capacity is exceeded.
- Discharge (Q) = Cross-sectional area (A) × Velocity (v). Example units: m^3/s = m^2 × m/s.
- Drainage density (Dd) = Total length of all streams in basin (L) / Area of basin (A). Units: km/km^2. (Dd = L / A).
- Runoff coefficient (C) = Runoff depth (R) / Rainfall depth (P). Dimensionless; used to estimate how much rainfall becomes surface runoff.
- Recurrence interval (T) for a flood = (n + 1) / m, where n = number of years of record and m = rank of the event (1 = largest). Probability of exceedance P = 1 / T = m / (n + 1).
- Strahler stream order (rules): two first-order streams join → second order; two second-order join → third order; when unequal orders join, order remains that of the higher one.
- Manning's equation (for open channel flow approximate velocity): v = (1/n) × R^(2/3) × S^(1/2), where n = roughness coefficient, R = hydraulic radius, S = channel slope. (Advanced; used in engineering estimates.)
Groundwater and Aquifers
What is groundwater?
Groundwater is the water stored beneath the Earth's surface in the spaces between soil particles and fractures in rocks. Rainwater and surface water seep down (infiltrate and percolate) through soil and rock to recharge this subsurface water.
Key parts and terms
- Soil moisture zone – uppermost layer where water clings to soil particles.
- Unsaturated (vadose) zone – pores contain both air and water.
- Water table – the top surface of the saturated zone (below this all pores are filled with water).
- Saturated zone – zone below the water table where all pores/voids are filled with water.
- Aquifer – a rock or sediment layer that can store and transmit usable amounts of groundwater (examples: sand, gravel, fractured rock).
- Recharge – addition of water to groundwater (from rain, rivers, irrigation infiltration).
- Discharge – removal of groundwater (natural springs, wells, baseflow to rivers).
Types of aquifers
- Unconfined aquifer – has the water table as its upper surface; receives direct recharge from above.
- Confined aquifer (artesian) – sandwiched between impermeable layers; water is under pressure and may rise in a well above the top of the aquifer.
- Perched aquifer – a small saturated zone above the main water table, isolated by an impermeable layer.
Why groundwater is important
It supplies drinking water, irrigation and industry for millions, especially in rural areas. Wells and tube wells tap groundwater; springs are natural discharge points.
How human activity affects groundwater
- Overextraction (excessive pumping) lowers the water table and can dry up wells and springs.
- Pollution (sewage, fertilizers, industrial waste) contaminates groundwater and makes it unsafe.
- Coastal over-pumping can cause seawater intrusion, making groundwater saline.
Conservation and recharge methods
- Rainwater harvesting (rooftop and surface), recharge pits, percolation tanks and check dams to increase infiltration.
- Sustainable pumping: extracting only as much as natural recharge allows.
- Protecting recharge areas from sealing (paving) and pollution.
Simple class activity
Make a clear plastic cup model: fill with sand and gravel, pour coloured water on top and watch how it moves down to form a ‘water table’ — observe how rising or lowering the water poured changes the water table level.
Summary
Groundwater fills pores and cracks underground. Aquifers are the layers that store and transmit this water. Protecting recharge areas, preventing pollution and using water wisely are essential to keep groundwater available for future use.
- A village using a hand pump (well) to get drinking water from an unconfined aquifer.
- Farmers in Punjab and Haryana using tube wells for irrigation; long-term heavy pumping has lowered local water tables.
- Rainwater harvesting systems in cities (e.g., recharge pits) that allow roof runoff to recharge the groundwater.
- A coastal town experiencing saline intrusion after groundwater overuse, causing wells to become salty.
- Porosity (n) = (Volume of voids / Total volume) × 100%
- Darcy's Law (groundwater discharge): Q = K × A × (dh/dl) - Q = discharge (volume/time), K = hydraulic conductivity (permeability), A = cross-sectional area, dh/dl = hydraulic gradient (change in head/change in distance)
- Hydraulic gradient (i) = dh/dl (change in water table elevation over horizontal distance)
- Specific yield (Sy) ≈ (Volume of water that drains by gravity / Total volume) (used to estimate how much water an unconfined aquifer will release)
Extraction of Groundwater
What is groundwater? Groundwater is the water stored beneath the Earth’s surface in the pore spaces of soil and in cracks and crevices in rock. The top of the saturated zone is called the water table. Layers that hold and transmit groundwater are called aquifers (permeable sand, gravel or fractured rock).
How is groundwater extracted? Groundwater is reached and taken out by making openings into the ground. Common methods include:
- Dug wells: Large, shallow holes dug by hand or machine. Usually used where the water table is shallow.
- Tube wells/borewells: Narrow, drilled wells that reach deeper aquifers. Often fitted with pumps (electric or diesel).
- Hand pumps: Manual pumps fitted to tube wells in many villages to lift water for households.
- Artesian wells: Wells in confined aquifers under pressure; water may rise above the aquifer level without pumping.
How extraction works (simple view): A well creates a local lowering of the water table (a cone of depression). Pumps lift water up to the surface. The rate of safe extraction depends on how fast the aquifer is recharged (by rain, rivers, seepage) compared to how fast water is pumped out.
Effects of excessive extraction:
- Declining water table — wells go dry and new, deeper wells are needed.
- Increased pumping costs — deeper pumps and more electricity/fuel.
- Land subsidence — ground may sink where large amounts of groundwater have been removed.
- Saltwater intrusion — in coastal areas, seawater can move into freshwater aquifers, making water salty.
Sustainable practices to manage extraction:
- Recharge groundwater by rainwater harvesting, percolation pits, check dams, and replenishing ponds.
- Use water-saving irrigation (drip, sprinkler) and choose crops suited to local water availability.
- Regulate drilling and set limits on total extraction in water-stressed areas.
- Monitor water table using observation wells and make decisions based on measurements.
Measurement & planning: Water managers use simple water-balance ideas — compare annual recharge (from rainfall and surface water seepage) with total extraction. If extraction exceeds recharge for many years, the water table falls.
Classroom note: This topic connects to local life — ask students how people in their village/town get water, whether wells have lowered over years, and what local measures exist (or could be started) to recharge groundwater.
- A village with shallow wells uses hand pumps for daily needs. During a long dry spell, the water table falls and many wells run dry — villagers install deeper tube wells with electric pumps, increasing extraction and further lowering the water table.
- In many farming areas of Punjab, farmers use tube wells for irrigation. Continuous heavy pumping for irrigation has caused the groundwater level to fall year after year.
- A coastal town that pumped groundwater faster than it recharged experienced saltwater intrusion; the water from wells became brackish and unsuitable for drinking.
- Cities like Chennai faced water shortages; after implementing recharge measures (e.g., percolation ponds, rooftop rainwater harvesting), some groundwater levels recovered in parts of the city.
- Volume of groundwater in an aquifer layer: V = A × b × n - V = volume of water (m³) - A = area of the aquifer (m²) - b = saturated thickness (depth of water-bearing layer) (m) - n = porosity (fraction of the rock or soil that is pore space, e.g., 0.25 for 25%)
- Darcy's law (flow through porous media): Q = K × A × (dh/dl) - Q = discharge (m³/s) - K = hydraulic conductivity or permeability (m/s) - A = cross-sectional area through which water flows (m²) - dh/dl = hydraulic gradient (change in head per unit length, dimensionless) (Note: Darcy's law is a basic scientific formula used to estimate groundwater flow.)
- Simple water-balance (annual): Change in storage = Recharge − Extraction ± Other losses - If Recharge < Extraction over several years, groundwater storage falls (water table declines).
- Recharge estimate from rainfall: Recharge = Rainfall × Area × Recharge coefficient - Recharge coefficient is the fraction of rainfall that reaches the aquifer (depends on soil, slope, vegetation, e.g., 0.1–0.5).
Rainfall, Monsoon and Water Availability
What is rainfall? Rainfall is the fall of water (as rain, drizzle, sleet, snow or hail) from the atmosphere to the earth’s surface. In India’s climate context we normally mean liquid precipitation (rain).
Types of rainfall:
- Convectional rainfall – heating of the land causes warm air to rise, cool and form rain (typical of afternoons in summer and tropical interiors).
- Orographic (relief) rainfall – moist winds rise over mountains, cool and condense (e.g., windward side of Western Ghats, Himalayas).
- Cyclonic (frontal) rainfall – associated with low-pressure systems and cyclones where different air masses meet (common in temperate regions and during monsoon depressions).
What is monsoon? The monsoon is a seasonal reversal in wind direction caused by differential heating of land and sea. In South Asia two main phases occur:
- Southwest (SW) monsoon – brings most of India’s annual rainfall from June to September. It comes in two branches: Arabian Sea branch (west coast) and Bay of Bengal branch (north-east and east coast).
- Northeast (NE) monsoon – cool, dry winds blow from land to sea. Parts of southeast India (Tamil Nadu, Puducherry) get post-monsoon rainfall (Oct–Dec) from NE monsoon and cyclones.
How monsoon controls rainfall distribution in India:
- Windward mountain slopes (e.g., Western Ghats western side, Assam, Meghalaya — Cherrapunji, Mawsynram) receive very heavy rainfall due to orographic lifting of SW monsoon winds.
- Leeward sides (Deccan Plateau, eastern rain-shadow of Western Ghats) get much less rain and are drier.
- Northwest India (Rajasthan, Punjab) gets scanty rain because monsoon weakens after crossing mountains and plains; occasional western disturbances give winter rain in northwest.
Water availability and why it varies: Water availability means fresh water accessible for human use (drinking, irrigation, industry). It depends on total rainfall, its timing, intensity, distribution and storage (rivers, reservoirs, groundwater). Key points:
- Seasonality: Most rainfall arrives in a few months (monsoon). This creates surplus water (floods) and long dry periods (scarcity).
- Intensity and run-off: Heavy short-duration rains cause rapid surface run-off, less infiltration and poor groundwater recharge.
- Storage and management: Reservoirs, ponds, groundwater and rainwater harvesting spread water use through dry months.
- Human use and demand: Population growth and irrigation demand change per capita availability.
Impacts of uneven rainfall: Adequate and well-distributed rainfall supports agriculture and replenishes rivers and aquifers. Erratic or deficient monsoon leads to drought, crop failure and reduced groundwater recharge. Excessive, concentrated rainfall causes floods, soil erosion and damage to infrastructure. Examples include Kerala floods (heavy monsoon, 2018), Chennai water crisis (deficient seasonal rains, 2019), and dry regions in rain-shadow areas.
Managing water availability: Methods include watershed management, check dams, percolation tanks, afforestation, efficient irrigation (drip, sprinkler), conjunctive use of surface and groundwater, and rainwater harvesting. These measures reduce run-off, increase infiltration and make water available during dry months.
Summary: Rainfall and the monsoon determine when and where water is available in India. Understanding type, timing and distribution of rainfall and using storage and conservation methods are essential to ensure steady water availability throughout the year.
- Cherrapunji and Mawsynram (Meghalaya) receive very high annual rainfall due to orographic lifting of moist SW monsoon winds on the windward side of the Khasi Hills.
- The western side of the Western Ghats gets heavy rain in the monsoon, while the eastern Deccan Plateau is in the rain-shadow and receives much less (explains drier conditions in parts of Karnataka and Maharashtra).
- Kerala floods (2018) — extreme monsoon rainfall and poor drainage/storage led to severe flooding and landslides.
- Chennai water crisis (2019) — deficient monsoon and poor groundwater management caused acute urban water shortage.
- Rainwater harvesting in Rajasthan villages — storing scarce monsoon runoff in johads and tanks increased groundwater recharge and reduced drought impacts.
- Mean monthly (or annual) rainfall = (Sum of rainfall for months) / (Number of months). Example: annual mean = (R1 + R2 + ... + R12) / 12
- Rainfall intensity (I) = Rainfall depth (mm) / Duration (hours). Useful for designing drainage.
- Simple water balance (short form): Precipitation (P) = Evapotranspiration (ET) + Runoff (R) + Change in Storage (ΔS)
- Runoff (approx) = Rainfall × Runoff coefficient (C). Runoff coefficient depends on surface (e.g., paved areas C≈0.7–0.95; grasslands C≈0.1–0.3).
- Per capita renewable water availability = Total renewable freshwater (m³/year) / Population. (Falkenmark thresholds: >1700 m³ = adequate, 1000–1700 m³ = water stress, 500–1000 m³ = scarcity, <500 m³ = absolute scarcity)
- Rainfall deficit (%) = (Normal rainfall − Actual rainfall) / Normal rainfall × 100
Irrigation and Agricultural Water Use
What is irrigation? Irrigation is the artificial supply of water to crops when rainfall is not sufficient. It ensures regular crop growth, increases yield and supports multiple cropping seasons (Kharif and Rabi).
Why is irrigation important? Many regions do not get rainfall at the right time or in the right amount. Irrigation stabilises food production, supports cash crops, and allows farming in arid and semi-arid regions.
Major types of irrigation:
- Surface irrigation (traditional): Water flows over the land. Examples: canals (fed by dams and rivers), field channels, bunded fields, tanks. Low cost but can be inefficient.
- Groundwater irrigation: Wells and tube wells that lift water from aquifers. Widely used where surface water is scarce.
- Modern/pressurised systems: Sprinkler irrigation (sprays water like rain) and drip irrigation (slowly supplies water to plant roots). These save water and reduce evaporation.
Traditional methods and small-scale systems: Persian wheels, check dams, farm ponds and village tanks (common in South India) and small diversion channels are used to store and distribute water locally.
Problems caused by some irrigation practices:
- Over-extraction of groundwater: Intensive use of tube wells (for example in parts of Punjab and Haryana) has caused falling water tables.
- Waterlogging and salinisation: Excess irrigation without proper drainage raises groundwater and leaves salts in the soil, reducing fertility (seen in some irrigated plains).
- Unequal access and wastage: Poorly maintained canals, leaking channels and flood-irrigation waste water.
Water-saving and better management practices: Shift to drip and sprinkler systems, scheduling irrigation according to crop needs, lining canals to prevent seepage, crop rotation, growing less water-demanding crops (millets, pulses) in dry areas, and rainwater harvesting and recharge of groundwater.
Short worked example (how volumes are calculated): The depth of water required is often given in millimetres (mm). 1 mm of water over 1 hectare = 10 cubic metres (m³) = 10,000 litres. If a crop needs a gross irrigation depth of 667 mm per season, the volume required per hectare = 667 × 10 = 6,670 m³ (6,670,000 litres).
Summary: Efficient irrigation means producing more crop per drop. Combining modern methods (drip/sprinkler), good scheduling, soil and crop choice, and community water management preserves water resources and sustains agriculture.
- Canal irrigation: Bhakra-Nangal and Indira Gandhi Canal provide canal water to large areas in Punjab, Haryana and Rajasthan respectively, enabling irrigation where rainfall is low.
- Groundwater overuse: Intensive tubewell irrigation in Punjab and Haryana after the Green Revolution has caused rapid fall in groundwater levels.
- Traditional tanks: In parts of Tamil Nadu and Andhra Pradesh, village tanks and small check dams store monsoon water for rice cultivation.
- Drip irrigation: Fruit farms (grapes, banana) and sugarcane plantations use drip systems in Maharashtra and Karnataka to save water and improve yields.
- Sprinkler systems: Used for fodder and vegetable crops in arid regions (e.g., parts of Rajasthan) to mimic rainfall and reduce evaporation.
- Irrigation efficiency (%) = (Water beneficially used ÷ Water applied) × 100
- Net irrigation requirement (mm) = Crop water requirement (mm) − Effective rainfall (mm)
- Gross irrigation requirement (mm) = Net irrigation requirement (mm) ÷ Irrigation efficiency (as decimal)
- Volume from depth: Volume (m³ per hectare) = Depth (mm) × 10 (because 1 mm on 1 ha = 10 m³)
- Example numeric flow: If net requirement = 400 mm and efficiency = 60% (0.6), gross = 400 ÷ 0.6 = 667 mm → Volume = 667 × 10 = 6,670 m³/ha
Water Scarcity: Causes and Consequences
What is water scarcity? Water scarcity means there is not enough clean water to meet people's needs for drinking, farming, industry and the environment. It can be caused by too little water available (physical scarcity) or by problems in supplying and managing water (economic scarcity).
Causes
- Low or uneven rainfall: Some regions get little rain or rainfall is concentrated in a short season, leaving long dry periods.
- Droughts and climate change: Longer or more frequent droughts reduce river flows and groundwater recharge.
- Population growth and urbanisation: More people and expanding cities increase demand for water.
- Overuse of groundwater: Pumping groundwater faster than it is recharged lowers water tables and reduces available water.
- Inefficient irrigation and wasteful use: A lot of water is lost through leaks, poor irrigation methods (like flooding) and wasteful practices.
- Pollution: Contaminated rivers, lakes and aquifers reduce the amount of usable water for drinking and farming.
- Deforestation and land-use change: Removing vegetation alters the water cycle, reducing soil moisture and groundwater recharge.
- Poor water management and infrastructure: Lack of pipes, storage (tanks, reservoirs), pricing and policies can cause shortages even where water exists.
Consequences
- Health problems: Lack of safe water leads to water-borne diseases like diarrhoea; poor sanitation increases illness.
- Agricultural loss and food insecurity: Crops fail when water is scarce, causing lower yields and higher food prices.
- Economic impacts: Industries and businesses suffer; cost of pumping and buying water rises.
- Environmental damage: Rivers, lakes and wetlands shrink, harming fish and other wildlife and reducing biodiversity.
- Social problems and migration: People may be forced to move; tensions and conflicts can arise over water resources.
- Inequality: Poor communities often suffer most because they lack resources to buy or access water; women and children often spend more time fetching water, missing school or work.
Simple example calculation (how scarcity is measured)
Per capita renewable water availability = Total renewable freshwater resources (in cubic metres per year) ÷ Population
According to common thresholds: >1700 m3/person/year = comfortable; 1000–1700 = water stress; 500–1000 = water scarcity; <500 = absolute scarcity.
Short note on solutions
Solutions include saving water (drip irrigation, fixing leaks), reusing wastewater safely, rainwater harvesting, protecting forests and catchments, controlling pollution, better water pricing and managing demand, and improving groundwater recharge. Community awareness and good planning are very important.
- Chennai, India (2019): After poor monsoon rains and depleted reservoirs, the city faced severe water shortages; tanker deliveries and strict conservation measures were used to cope.
- Cape Town, South Africa (2018): 'Day Zero' nearly arrived when reservoirs fell very low; strict water limits and public campaigns helped avoid running out of water.
- Aral Sea, Central Asia: Diversion of rivers for irrigation caused the lake to shrink drastically, destroying fisheries and local livelihoods.
- Bundelkhand region, India: Recurrent droughts, overuse of groundwater and poor irrigation practices have caused crop failures and distress migration.
- Per capita renewable water availability = Total renewable freshwater resources (m³/year) ÷ Population (persons). Example: 500,000,000 m³ ÷ 1,000,000 people = 500 m³/person/year.
- Water balance (simple) = Precipitation − Evapotranspiration − Runoff = Change in storage (groundwater/reservoirs).
- Irrigation efficiency (%) = (Water used by crop ÷ Water diverted for irrigation) × 100. Higher efficiency means less water wasted.
- Annual domestic water use per person (m³/year) = (Daily litres per person × 365) ÷ 1000. Example: 100 L/day → (100 × 365) ÷ 1000 = 36.5 m³/year.
Water Conservation and Management
What is Water Conservation and Management?
Water conservation means using water carefully to avoid waste and preserve it for future use. Water management is planning and implementing methods to collect, store, distribute and use water sustainably for households, agriculture, industry and the environment.
Why it matters
- Freshwater is limited: only a small fraction of Earth's water is usable freshwater.
- Growing population, pollution, over-extraction and climate change reduce availability.
- Proper conservation ensures enough water for drinking, food production and ecosystems.
Main causes of water scarcity
- Overuse in agriculture (largest user) and inefficient irrigation.
- Groundwater depletion from excessive pumping.
- Pollution of rivers, lakes and aquifers.
- Poor storage and distribution losses (leaks).
Key methods of conservation and management
- Rainwater harvesting: Collect rain from roofs or land into tanks or recharge pits to store or recharge groundwater. (Tip: 1 mm rainfall on 1 m² = 1 litre.)
- Groundwater recharge: Recharge wells, percolation ponds, recharge shafts and desilting of traditional water bodies to increase infiltration.
- Watershed management: Contour trenches, check dams, afforestation and soil conservation to reduce runoff and increase water retention in a region.
- Efficient irrigation: Drip and sprinkler irrigation, mulching, line sowing and alternate wetting and drying for paddy reduce water use compared to flood irrigation.
- Reuse and recycling: Greywater recycling (bath and kitchen water for gardening), treated wastewater for industry/agriculture.
- Leak prevention and demand management: Fix leaks, use water-saving taps, low-flush toilets, and adopt behavioural changes (shorter showers, bucket for washing vehicles).
- Policy and community action: Metering, pricing, community-managed tank systems, and awareness programmes help long-term sustainability.
Benefits
- Reduced groundwater depletion and improved water security.
- More reliable irrigation and higher farm incomes.
- Lower water bills and energy savings (less pumping).
- Healthier ecosystems and better drought resilience.
Role of students and households
- Adopt simple habits: turn off taps while brushing, collect and reuse greywater, fix dripping taps.
- Participate in school rainwater harvesting or tree-planting drives.
- Spread awareness in the neighbourhood about saving water.
Quick practical notes
- Runoff coefficient examples: concrete roof ≈ 0.9, tiled roof ≈ 0.8, bare soil ≈ 0.4. Use these when estimating harvestable rainwater.
- Typical water-use split (approximate): agriculture ~70–80%, industry ~10–20%, domestic ~10–15% (varies by country).
- Household rainwater harvesting: A family with a 100 m² rooftop collects rainwater during monsoon. With 200 mm rain and runoff coefficient 0.8, harvestable water = 200 mm × 100 m² × 0.8 = 16,000 litres stored in tanks for garden and household use.
- Drip irrigation on a vegetable farm: Replacing furrow irrigation with drip can reduce water use by 30–70% and increase crop yield due to precise water delivery to roots.
- Community watershed project: Building a series of small check dams and percolation ponds on a hillside slows runoff, increases groundwater recharge and restores water availability to nearby wells.
- Greywater reuse: Household collects water from sinks and showers, treats with simple filtration, and uses it to water plants—reducing freshwater demand for gardening.
- Fixing leaks: A single dripping tap can waste over 15 litres per day. Repairing leaks and installing aerators can cut household water use by 10–30%.
- Rainwater harvestable volume (litres) = Rainfall (mm) × Catchment area (m²) × Runoff coefficient. (Note: 1 mm on 1 m² = 1 litre.)
- Example calculation: Rain = 200 mm, area = 100 m², runoff coefficient = 0.8 → Volume = 200 × 100 × 0.8 = 16,000 litres.
- Per capita water availability = Total renewable water resources (m³/year) ÷ Population. (Useful to monitor water stress per person.)
- Water Use Efficiency (WUE) for crops = Crop yield (kg) ÷ Water used (m³). (Higher WUE means more crop per unit water.)
- Simple leakage loss estimate (litres/day) = Drip rate (drops/sec) × 86,400 sec/day × droplet volume (≈0.05 ml/drop) ÷ 1000.
Floods: Causes, Effects and Control
What is a Flood?
A flood is the temporary overflowing of water onto land that is normally dry. It occurs when rivers, lakes, coasts or drainage systems cannot carry away excess water, causing water to spread over surrounding areas.
Causes of Floods
- Heavy or prolonged rainfall: Intense monsoon rains or prolonged showers increase river flow beyond channel capacity.
- Cloudbursts and flash floods: Sudden very heavy localized rain (cloudburst) leads to rapid runoff and flash floods, especially in hilly areas.
- Snowmelt: Rapid melting of snow in mountains in spring or during sudden warming raises river discharge.
- Tropical cyclones, storm surges and coastal flooding: Strong winds push sea water inland or bring heavy rain on the coast.
- Poor drainage and urbanization: Hard surfaces (concrete, asphalt) reduce infiltration and increase surface runoff; blocked drains worsen urban floods.
- Deforestation and soil erosion: Removing vegetation reduces the land’s ability to absorb water and speeds runoff.
- Siltation and reduced channel capacity: Rivers choked with silt cannot carry as much water, causing overflow.
- Dam/embankment failure: Breakage or overtopping of dams and levees can release large volumes of water downstream.
Effects of Floods
- Loss of life and injury: People and animals can drown or be injured during sudden floods.
- Damage to houses and infrastructure: Buildings, roads, bridges, power and water supply may be destroyed or disrupted.
- Agricultural loss: Standing crops are ruined, topsoil washed away and farmland becomes waterlogged.
- Spread of diseases: Contaminated water and poor sanitation cause water-borne diseases (cholera, diarrhea) and vector-borne diseases (malaria).
- Economic loss: Trade, industry and livelihoods are affected; recovery and rebuilding are costly.
- Environmental impact: Soil erosion, silt deposition, loss of vegetation, and alteration of habitats.
- Displacement: People may be forced to leave homes, leading to temporary shelters and social disruption.
Measures to Control and Manage Floods
Flood control includes structural and non‑structural measures:
- Structural measures
- Dams and reservoirs to store excess water and regulate river flow.
- Embankments, levees and floodwalls along riverbanks to prevent overflow.
- Spillways, diversion channels and retention basins to redirect or hold floodwater.
- River channel improvement (dredging) to increase carrying capacity.
- Improved urban drainage systems and storm sewers to remove water quickly.
- Non-structural measures
- Afforestation, watershed management and soil conservation to reduce runoff.
- Zoning laws and building regulations to prevent construction on floodplains.
- Early warning systems, weather forecasting and community preparedness plans.
- Public awareness, evacuation plans and disaster management training.
- Insurance schemes and economic planning to reduce long-term impacts.
Safety Tips During Floods
- Move to higher ground; avoid walking or driving through floodwater.
- Turn off electricity and gas if safe to do so.
- Follow official warnings and evacuation orders.
- Use boiled or treated water for drinking; avoid contaminated water.
Summary
Floods are natural hazards caused by excess water from rainfall, snowmelt, storms, or human changes to the landscape. Their impacts can be reduced by combining engineering works (dams, embankments) with sustainable land use, early warning systems and community preparedness.
- Uttarakhand floods (June 2013) — Cloudbursts and heavy rain in the Himalayas caused flash floods and landslides, large loss of life and damage to infrastructure.
- Mumbai floods (July 2005) — Extremely heavy monsoon rainfall combined with poor drainage led to city-wide inundation and transport paralysis.
- Kerala floods (August 2018) — Prolonged extreme monsoon rainfall and reservoir releases caused widespread flooding and landslides across the state.
- Chennai floods (December 2015) — Intense rains and poor urban drainage resulted in severe flooding, displacement and economic losses.
- Discharge (river flow): Q = A × v, where Q = discharge (m³/s), A = cross-sectional area of the river (m²), v = average velocity of flow (m/s).
- Rational method (estimate peak runoff): Q = C × i × A, where Q = peak discharge (m³/s), C = runoff coefficient (dimensionless), i = rainfall intensity (m/s or mm/hr converted), A = catchment area (m² or ha with proper unit conversion).
- Return period (recurrence interval): T = (n + 1) / m, where T = return period in years, n = number of years of record, m = rank of a particular flood (1 for largest).
Droughts: Causes, Effects and Mitigation
What is a drought?
A drought is a long period of unusually low rainfall that leads to water shortage for people, crops, animals and the environment. Droughts develop slowly and may affect a large area.
Types of drought
- Meteorological drought: rainfall much below normal for a region and season.
- Agricultural drought: moisture in the soil is insufficient for crops to grow properly.
- Hydrological drought: reduced river flows, reservoirs, lakes and groundwater levels.
- Socio-economic drought: when water shortages affect people’s livelihood, food supply and economy.
Causes of drought
- Natural causes:
- Deficient or delayed monsoon rains/low annual rainfall.
- High temperatures and increased evaporation.
- Large-scale climate patterns such as El Niño, which can reduce rainfall in some regions.
- Human causes:
- Overuse of water for irrigation, industry and cities.
- Excessive groundwater extraction (overdraft) causing falling water tables.
- Deforestation and poor land management that reduce soil water-holding capacity and increase runoff.
- Poor irrigation methods (flooding fields) and lack of water conservation.
- Climate change increasing variability of rainfall and frequency of extreme events.
Effects of drought
- On farming and food: crop failures, reduced yields, food shortages and higher prices.
- On water resources: falling groundwater levels, low reservoir and river flows, reduced water for drinking and irrigation.
- On environment: loss of vegetation, soil erosion, increased risk of desertification, harm to wildlife.
- On economy and society: loss of income for farmers, unemployment, rural–urban migration, conflicts over water, health problems from poor sanitation.
- Secondary impacts: reduced hydroelectric generation, higher electricity costs, increased cost of transporting water (tankers).
Mitigation and management (how to reduce drought risk)
Mitigation includes both short-term relief actions and long-term planning to reduce the chance and impact of future droughts.
- Short-term measures
- Drought relief: providing drinking water by tankers, setting up community water points and food aid when needed.
- Restricting water use: water rationing, bans on non-essential use (car washing, filling pools).
- Long-term measures
- Rainwater harvesting — rooftop tanks and ground recharge structures to capture rain.
- Watershed management — check dams, contour bunds, afforestation to slow runoff and increase groundwater recharge.
- Efficient irrigation — drip and sprinkler systems to save water; avoid flood irrigation.
- Crop planning and diversification — planting drought-resistant and less water‑intensive crops; adjusting sowing time to available water.
- Groundwater management — regulating extraction, recharging aquifers, monitoring water tables.
- Soil and land conservation — mulching, organic matter, terraces to retain soil moisture.
- Early warning and monitoring — weather forecasting, drought indices and monitoring of rainfall and groundwater for timely action.
- Community participation and policy — water user associations, pricing water fairly, drought contingency plans at village and district levels.
Practical steps students and communities can do
- Save water at home (shorter baths, fix leaks, use bucket instead of running tap).
- Collect rainwater for garden and cleaning.
- Plant native trees and mulching to keep soil moist.
- Spread awareness about water-saving methods.
Summary
Droughts are caused by both natural climate variability and human actions. Their effects are wide-ranging — on agriculture, water supply, environment and society. Combining relief measures with long-term water management (rainwater harvesting, efficient irrigation, watershed work and groundwater recharge) reduces damage and builds resilience.
- Australia's Millennium Drought (1997–2009): A long period of below-average rainfall that led to strict water restrictions, reduced reservoir levels and major impacts on farming, especially in the Murray–Darling Basin.
- California drought (2011–2017): Several years of low precipitation and high temperatures that caused water shortages, mandatory conservation measures, and stresses on agriculture.
- Marathwada region, Maharashtra (recurring droughts in recent decades): Repeated monsoon failures, groundwater depletion and crop losses, causing migration and farmer distress in parts of western India.
- Bengaluru water crisis (2019): Combination of low rainfall, over-extraction of groundwater and rapid urban growth led to acute water shortages in the city.
- Rainfall deficit (%) = ((Normal rainfall − Actual rainfall) / Normal rainfall) × 100 — to show how much below normal rainfall was.
- Water balance (simple) : Precipitation = Evapotranspiration + Runoff + Change in Storage — useful to understand where rainwater goes and how much is available for recharge.
- Runoff (approx.) = Runoff coefficient (C) × Rainfall depth — where C depends on land cover (e.g., 0.1 for permeable soil, 0.7 for paved areas).
- Per-capita water availability = Total available water / Population — to estimate water stress for a community.
Water Pollution and Its Control
What is water pollution?
Water pollution occurs when harmful substances—chemicals, biological materials, or physical debris—enter water bodies (rivers, lakes, groundwater, seas) in amounts that make the water unsafe for drinking, harmful to plants and animals, or unsuitable for other uses.
Major types of water pollutants
- Domestic sewage (organic waste, soaps, detergents)
- Industrial effluents (chemicals, heavy metals, dyes, oil)
- Agricultural runoff (fertilisers, pesticides)
- Plastics and solid waste
- Microbial pollution (pathogens causing water-borne diseases)
Main sources of pollution
- Household drains and latrines discharging untreated sewage into rivers and lakes.
- Factories releasing untreated or partially treated effluents.
- Farms where excess fertiliser and pesticide wash into nearby water bodies during rains.
- Oil spills and accidental releases from ships and pipelines.
- Improper disposal of plastics and solid waste leading to clogging and contamination.
Effects of water pollution
- Health problems: water-borne diseases such as diarrhoea, cholera, typhoid; poisoning from heavy metals.
- Damage to aquatic life: reduced oxygen levels kill fish and other organisms; toxic substances accumulate in food chains.
- Eutrophication: excess nutrients (nitrogen, phosphorus) cause algal blooms; after decomposition oxygen is depleted causing 'dead' zones.
- Economic loss: affects fishing, tourism, and increases cost of water treatment.
Key concept — Dissolved Oxygen (DO) and Biological Oxygen Demand (BOD)
Healthy water has sufficient dissolved oxygen (DO) for aquatic life. BOD measures how much oxygen organisms need to decompose organic matter. High BOD means more organic pollution and less available oxygen for fish.
How to control and prevent water pollution
- Source control: reduce use of harmful chemicals, adopt cleaner production in industries, and manage agricultural chemical use (integrated pest management).
- Sewage treatment: build and operate sewage treatment plants (STPs) so household and city sewage is treated before discharge.
- Industrial effluent treatment: industries must install effluent treatment plants (ETPs), treat and monitor discharge to meet standards.
- Waste management: reduce, reuse, recycle plastics and solid waste; proper landfill and segregation at source.
- Constructed wetlands and natural treatment systems: use plants and microbes to clean wastewater in an eco-friendly way.
- Rainwater harvesting and watershed management: reduce runoff and contamination, recharge groundwater and reduce pollution load on rivers.
- Legal and institutional measures: enforce laws and standards, regular monitoring, public awareness and community participation.
Stages of common sewage treatment (simple)
- Primary treatment: removal of large solids and settling of suspended particles (screening and sedimentation).
- Secondary treatment: biological treatment (using microbes) to reduce organic matter and BOD (activated sludge, aeration, biofilters).
- Tertiary treatment: advanced removal of nutrients, pathogens, heavy metals, and sometimes desalination or polishing (filtration, disinfection, nutrient removal).
What students and communities can do
- Do not throw plastic, oil, or waste into rivers and drains; use dustbins and recycling options.
- Use safe household products (biodegradable soaps) and avoid excessive fertiliser/pesticide use in home gardens.
- Support and participate in local river clean-up drives and awareness campaigns.
- Conserve water to reduce the pressure on treatment systems.
In short: prevent pollution at the source, treat wastewater properly, protect water bodies with good practices and laws, and involve communities in keeping water clean.
- Ganga River pollution: untreated sewage from towns, religious offerings, and industrial effluents have historically caused high BOD and contamination; many cleaning and treatment projects are ongoing.
- Yamuna in Delhi: urban sewage and industrial discharge make parts of the river severely polluted and unfit for use without treatment.
- Minamata disease (Japan): mercury discharged from an industrial plant accumulated in fish and shellfish, causing severe neurological disease in people who ate contaminated seafood.
- Lake Erie algal blooms: excess fertiliser runoff from farms caused dense algal growth; decomposition reduced oxygen and harmed fish populations.
- Exxon Valdez oil spill (1989): large marine oil spill caused long-term damage to marine life and coastal ecosystems.
- Plastic pollution and the Great Pacific Garbage Patch: rivers and land-based sources carry plastics to the oceans, creating huge floating garbage accumulations and harming marine animals.
- Concentration: C = mass of pollutant (mg) / volume of water (L) — gives mg/L
- Load (mass/time): Load = Concentration (mg/L) × Flow rate (L/time) — useful for estimating total pollutant entering a river
- Dilution after mixing: C_final = (C1×V1 + C2×V2) / (V1 + V2); if freshwater mixes with polluted water
- BOD5 (approx.): BOD5 = DO_initial − DO_after_5_days (measured at 20°C) — higher BOD5 indicates more organic pollution
- Removal efficiency (%): Efficiency = ((C_in − C_out) / C_in) × 100
Drinking Water and Sanitation
What is meant by Drinking Water and Sanitation?
Drinking water means water that is safe and fit for human consumption without causing immediate or long-term harm. Sanitation refers to the safe collection, transport, treatment and disposal or reuse of human excreta and wastewater, and the conditions and services that prevent contact between people and disease-causing agents.
Why this topic is important
- Safe drinking water and proper sanitation prevent water-borne diseases (diarrhoea, cholera, typhoid, dysentery) and reduce child mortality.
- They improve public health, school attendance (especially for girls), productivity and dignity.
Sources of drinking water
- Surface water: rivers, lakes, ponds — vulnerable to contamination from sewage, agricultural runoff and industrial waste.
- Groundwater: wells and tube-wells — usually safer but can be contaminated by leaching (nitrates), arsenic, fluoride or overuse (declining water tables).
- Rainwater harvesting: collects runoff from roofs; useful where other sources are scarce.
Common contaminants and routes of contamination
- Pathogens: bacteria, viruses, protozoa — cause acute illnesses.
- Chemicals: arsenic, fluoride, nitrate, pesticides — cause chronic health problems.
- Physical contaminants: suspended solids, making water cloudy and unsafe.
- Routes: leaking sewer lines, open defecation near water sources, improper disposal of waste, agricultural runoff, industrial discharge.
How drinking water is made safe
At community level: water treatment plants normally use a combination of steps — screening, sedimentation, coagulation and flocculation, filtration, disinfection (chlorination/UV). Proper distribution and storage are also essential to prevent recontamination.
At household level: simple, low-cost methods include boiling, solar disinfection (SODIS), chlorination with sodium hypochlorite (correct dose), ceramic or biosand filters, and safe storage in covered containers with a tap.
What is sanitation and its types
- On-site sanitation: pit latrines, composting toilets, septic tanks — used where piped sewer is not available.
- Off-site sanitation (sewerage): network of sewers that conveys wastewater to a treatment plant.
- Solid waste management and drainage are part of sanitation because they affect water quality and health.
Sanitation-health link
Poor sanitation contaminates water sources and environment, increasing incidence of diarrhoeal diseases and parasitic infections. Clean water without sanitation still leaves communities vulnerable; both must work together. Hygiene practices (handwashing with soap, safe disposal of child faeces) are a critical third component.
Key actions and community measures
- Provide household access to safe water (piped supply or treated sources) and to improved toilets.
- Protect water sources: maintain buffer areas, avoid dumping waste near wells, proper drainage.
- Promote hygiene education: handwashing, food safety, safe child faeces disposal.
- Maintain and operate sewage and treatment systems; promote rainwater harvesting and groundwater recharge where appropriate.
Role of government and programs
Governments and local bodies build water supply systems, toilets, sewage treatment plants and run campaigns (e.g., sanitation drives). Community involvement, schools and NGOs help with behaviour change and local solutions like community toilets or village-level treatment plants.
Simple indicators to measure progress
- Percentage of households with access to an improved drinking water source.
- Percentage of households with improved sanitation (private toilet or shared improved facility).
- Incidence of water-borne diseases (used to monitor health impact).
Practical tips for students
- Always cover drinking water and clean storage containers regularly.
- Boil or filter water if the source is doubtful; use chlorine tablets as instructed.
- Wash hands with soap after using the toilet and before eating or preparing food.
- Take part in school/community cleanliness drives and report broken pipes or open drains to authorities.
- Village A had frequent diarrhoea because an open drain ran next to the community well. After constructing a proper drainage channel and fencing the well, contamination reduced and illness cases fell.
- A city slum lacked household toilets; open defecation near drains contaminated surface water. A community toilet block with regular cleaning and a nearby handwashing station improved health and sanitation.
- A school started a rainwater harvesting system and used a simple sand filter and chlorination. Students now have access to safe water throughout the year.
- Households in a town installed biosand filters and practiced boiling during monsoon; the number of stomach-related illnesses decreased substantially.
- A rural health program taught handwashing with soap and safe disposal of child faeces; incidents of diarrhoea among children under five dropped noticeably.
- Per capita water supply (L/day) = Total daily water supplied (L/day) / Population served
- Percentage with access to improved water (%) = (Number of people with access to improved water / Total population) × 100
- Water demand for household (L/day) = Number of family members × Average per person requirement (L/day) — (typical per person requirement ranges from 40–135 L/day depending on urban/rural and uses)
Community, Policy and Conservation Initiatives
What the topic means
Community, Policy and Conservation Initiatives describes how people (communities), laws and government programmes (policies), and practical methods (conservation) work together to manage and protect water. The aim is to make sure there is enough clean water for drinking, farming, industry and nature, now and in the future.
Role of the community
- Local people form groups (for example water user associations or village committees) to manage wells, ponds and local supply systems.
- Communities help in activities such as cleaning local water bodies, maintaining rainwater harvesting systems, checking leaks and monitoring groundwater levels.
- Awareness and behaviour change (save water at home, fix leaks, use less water for washing) are led by schools, NGOs and local leaders.
Role of policy and government programmes
- Policies set rules, provide funds and create large-scale programmes for water supply, sanitation and conservation. Examples include national water policies and specific schemes to provide piped water or to recharge groundwater.
- Governments make rules such as mandatory rainwater harvesting for buildings, or provide subsidies for micro-irrigation (drip and sprinkler systems) that save water.
- Programmes also support watershed development, repair of tanks and check dams, and campaigns to restore rivers and groundwater.
Conservation initiatives and methods
- Rainwater harvesting — collecting roof runoff and storing it in tanks or recharging the ground.
- Watershed management — building contour bunds, check-dams and planting trees to reduce run-off and increase infiltration.
- Efficient irrigation — drip and sprinkler irrigation to reduce water used in agriculture.
- Greywater recycling — using household wastewater (from washing) for gardens or flushing toilets after simple treatment.
- Repair and reuse — fixing leaks, repairing ponds/tanks and re-using treated water.
Why community + policy + conservation together work best
Policy provides money, technical rules and large programmes; communities ensure rules are followed locally and systems are maintained; conservation methods reduce demand and increase supply. Together they create sustainable local solutions.
How students can participate
- Save water at home: turn off taps, take shorter showers, collect and reuse water for plants.
- Start or support a rainwater harvesting system at school.
- Join awareness drives to clean local ponds and monitor water usage.
- Ralegan Siddhi (Maharashtra): A village transformed by community-led watershed work, contour trenches and tree planting that improved groundwater and agriculture.
- Alwar and the johads restoration (Rajasthan/Alwar): Community and NGO efforts rebuilt traditional earthen check-dams (johads) to capture monsoon water and recharge groundwater.
- Chennai (Tamil Nadu): Mandatory rainwater harvesting rules for buildings after water crises; many buildings and schools installed rooftop systems.
- Jal Jeevan Mission (India): A national government programme to provide safe piped drinking water to rural households, supported by local institutions.
- Atal Bhujal Yojana (India): A programme focusing on sustainable groundwater management that involves local communities in monitoring and planning.
- Per capita water use (per day) = Total water used in a day (litres) / Population using the water
- Percentage share of a sector = (Water used by sector / Total water used) × 100
- Unit conversion: 1 cubic metre (m³) = 1000 litres
- Simple water balance (over a period): Change in storage = Inflows (rainfall + inflow) − Outflows (evaporation + withdrawals + outflow)
- Rainwater harvesting volume (approximate): V = A × R × C where V = volume collected (m³), A = roof area (m²), R = rainfall depth (m) for the period, C = runoff coefficient (typical 0.75–0.95 for roofs). Example: 100 m² roof, 0.5 m annual rainfall, C=0.8 → V = 100×0.5×0.8 = 40 m³ = 40,000 litres.
Map Skills and Practical Activities
What this topic covers
Map Skills and Practical Activities help you read, measure and interpret maps to study water features — rivers, drainage basins, watersheds, contour patterns, and flood-prone areas. You learn to use scale, compass directions, grid references, contour lines and map symbols and to carry out simple field and lab activities that link map information to real-world water behaviour.
Key map-reading skills
- Scale — Understand representative fraction (RF), statement and graphic scales so you can convert map distances to real distances.
- Compass and directions — Use cardinal directions and bearings (angles measured clockwise from North) to describe the direction of river flow or location of features.
- Grid references — Use grid lines (4-figure and 6-figure references) to pinpoint locations such as a spring, check dam or village.
- Contour lines — Read elevation, contour interval and index contours. Contours form ‘V’ shapes that point upstream — useful to tell river direction and locate watersheds, ridges and valleys.
- Drainage patterns — Identify patterns (dendritic, trellis, radial) to infer geology and slope which affects runoff and infiltration.
- Map symbols and legend — Interpret features like canals, wells, lakes, reservoirs and check dams using the map key.
- Measuring area and distances — Calculate basin area from grid squares or by scale conversion; find shortest/longest routes and travel time estimates.
Practical activities (how they help)
- Measuring map distance — Use a ruler to measure between two points; convert using the RF or statement scale to get real-world distance for planning travel or pipeline layouts.
- Determining river flow direction — Use the contour ‘V’ rule: V points upstream. This helps when planning water intake or locating erosion-prone stretches.
- Drawing a cross-section — Transfer contour intersections along a line to graph elevation vs distance. This shows river gradient and valley shape.
- Calculating gradient/slope — Find vertical drop between two points and divide by horizontal distance to estimate steepness, which affects flow speed and erosion.
- Field sketch and small watershed map — Walk a schoolyard or local stream, note features and plot them on a simple map. Compare with topographic map to check accuracy.
- Model rivers and watershed experiments — Use sand/clay models and pour water to observe flow patterns, erosion and deposition — link observations with map features.
- Hydrographs and rainfall charts — Collect discharge or water-level data and plot vs time to study flood response and lag time of a basin.
Practical tips
- Always note the map’s scale and contour interval before measuring.
- When converting using RF (1:n), keep units consistent (convert cm on map to cm on ground, then to metres/kilometres).
- Label axes, units and scale clearly when drawing graphs or cross-sections.
- Use colour to distinguish water features, elevation bands and land-use in sketches and maps.
These skills prepare you for fieldwork, help predict flood-prone zones, plan water-management structures and understand how topography controls river behaviour.
- Distance conversion: On a map with RF 1:250,000 you measure 3 cm between two towns. Ground distance = 3 cm × 250,000 = 750,000 cm = 7.5 km.
- Direction of river flow: Contour lines make a V where they cross a stream; the V points upstream. If the V points north, the river flows south.
- Drawing a cross-section: Along a transect line across a valley, note contour elevations at intersections (200 m, 150 m, 100 m). Plot elevation (y-axis) against distance along the transect (x-axis) to get the valley profile.
- Gradient calculation: A stream drops from 300 m to 120 m over 6 km. Gradient = (300 - 120) m / 6 km = 180 m / 6 km = 30 m per km.
- Area estimation using grid squares: If one map square represents 1 km × 1 km (1 km²) and the basin covers 12 full squares + 4 half squares, area ≈ 12 + (4 × 0.5) = 14 km².
- Ground distance (cm) = map distance (cm) × scale denominator (RF). Example: RF 1:100,000 → ground cm = map cm × 100,000.
- Ground distance (km) = (map distance (cm) × scale denominator) / 100,000. Example: map 2 cm at 1:250,000 → (2 × 250,000)/100,000 = 5 km.
- Statement scale conversion: If statement scale says 1 cm = x km, then ground distance (km) = map distance (cm) × x.
- Gradient (slope) = vertical drop (m) / horizontal distance (km). Units usually expressed as m per km or as a ratio.
- Discharge (river) Q = A × v, where Q is discharge (m³/s), A is cross-sectional area (m²) and v is average velocity (m/s). Useful for hydrographs and estimating flow.
- Area from map grid: Area (km²) = number of squares × area represented by one square (derived from scale).
Key Concepts
- Water cycle
- The continuous movement of water between the atmosphere, land and oceans through processes like evaporation, condensation, precipitation and runoff.
- Evaporation
- The process by which water changes from liquid to vapour when heated.
- Condensation
- The change of water vapour into tiny liquid droplets, forming clouds or dew.
- Precipitation
- Any form of water (rain, snow, sleet or hail) that falls from clouds to the earth's surface.
- Transpiration
- The release of water vapour from plant leaves into the atmosphere.
- Runoff
- Water that flows over the land surface into rivers, lakes and seas after rainfall.
- Infiltration
- The process by which surface water soaks into the soil and moves underground.
- Groundwater
- Water stored beneath the Earth's surface in soil pore spaces and rock cracks.
- Water table
- The top level of the saturated zone below which the ground is completely filled with water.
- Aquifer
- A layer of rock or sediment underground that holds and transmits groundwater.
- Watershed
- An area of land where all the water drains into a common outlet such as a river, lake or reservoir.
- Tributary
- A smaller river or stream that joins a larger river.
- Floodplain
- Flat land beside a river that gets covered with water when the river overflows.
- Reservoir
- An artificial lake created by building a dam to store water for supply, irrigation or power.
- Glacier
- A large, slow-moving mass of ice on land that stores freshwater and feeds rivers as it melts.
- Desalination
- The process of removing salt and minerals from seawater to make it suitable for drinking or irrigation.
- Rainwater harvesting
- Collecting and storing rainwater for later use, often from roofs or paved areas.
- Irrigation
- The artificial supply of water to land or crops to help growth, using canals, wells, pipes or sprinklers.
- Water conservation
- Careful use and protection of water resources to prevent waste and ensure long-term availability.
- Water pollution
- The contamination of water bodies by harmful substances that make water unsafe for humans, animals and plants.
End-of-Chapter Trial Paper & Test Questions
Topic-wise questions to test your understanding of every concept in this chapter.
-
What percentage of the Earth's total water is found in the oceans? / पृथ्वी के कुल जल का कितना प्रतिशत महासागरों में पाया जाता है? (a) About 50% / लगभग 50% (b) About 75% / लगभग 75% (c) About 97% / लगभग 97% (d) About 30% / लगभग 30%
Show answer
(c) About 97% / लगभग 97% — Approximately 97% of all water on Earth is salt water in the oceans, leaving only about 3% as fresh water (and most of that is locked in glaciers). / पृथ्वी पर लगभग 97% जल महासागरों में खारे पानी के रूप में है, केवल लगभग 3% ही मीठा पानी है (और उसका अधिकांश भाग हिमनदों में बंद है)।
-
Which process in the water cycle involves water vapour cooling to form clouds? / जल चक्र में किस प्रक्रिया में जलवाष्प ठंडी होकर बादल बनाती है? (a) Evaporation / वाष्पीकरण (b) Precipitation / वर्षण (c) Condensation / संघनन (d) Infiltration / अन्तःस्यंदन
Show answer
(c) Condensation / संघनन — When water vapour rises and cools, it condenses into tiny water droplets or ice crystals that cluster together to form clouds. / जब जलवाष्प ऊपर उठती है और ठंडी होती है, तो वह छोटी-छोटी पानी की बूंदों या बर्फ के क्रिस्टलों में संघनित हो जाती है जो मिलकर बादल बनाती हैं।
-
The process by which rainwater soaks into the ground to replenish groundwater is called _______. / जिस प्रक्रिया में वर्षाजल भूमि में रिसकर भूजल की पूर्ति करता है, उसे _______ कहते हैं।
Show answer
Infiltration (or percolation) / अन्तःस्यंदन (या रिसाव) — When rain falls, some water seeps into the soil and moves down through rock layers to join the groundwater table. This is called infiltration or percolation, and it is vital for recharging underground aquifers. / जब वर्षा होती है, तो कुछ जल मिट्टी में रिसता है और चट्टानी परतों के माध्यम से नीचे जाकर भूजल स्तर में मिल जाता है। इसे अन्तःस्यंदन या रिसाव कहते हैं, और यह भूमिगत जलभृतों की पुनः पूर्ति के लिए अत्यंत महत्वपूर्ण है।
-
The part of the river where it begins its journey, often near a glacier or spring, is called the _______. / नदी की उस जगह को _______ कहते हैं जहाँ से वह अपनी यात्रा शुरू करती है, जो प्रायः हिमनद या झरने के पास होती है।
Show answer
Source / उद्गम — The source is the starting point of a river, usually at a high elevation where water collects from melting ice, springs, or rainfall. From the source, the river flows downhill toward its mouth. / उद्गम नदी का प्रारंभिक बिंदु होता है, जो सामान्यतः अधिक ऊँचाई पर होता है जहाँ पिघलती बर्फ, झरनों या वर्षा से जल एकत्र होता है। उद्गम से नदी अपने मुहाने की ओर नीचे बहती है।
-
True or False: Most of Earth's fresh water is found in rivers and lakes that we can easily use. / सत्य या असत्य: पृथ्वी का अधिकांश मीठा पानी नदियों और झीलों में पाया जाता है जिसे हम आसानी से उपयोग कर सकते हैं।
Show answer
False / असत्य — About 69% of Earth's fresh water is locked in glaciers and ice caps, and about 30% is groundwater. Only around 1% is accessible as surface water in rivers and lakes, making usable fresh water very scarce. / पृथ्वी का लगभग 69% मीठा पानी हिमनदों और बर्फ की चोटियों में बंद है, और लगभग 30% भूजल है। केवल लगभग 1% ही नदियों और झीलों में सतही जल के रूप में उपलब्ध है, जिससे उपयोगी मीठा पानी बहुत दुर्लभ हो जाता है।
-
What is the water cycle? Why is it important? / जल चक्र क्या है? यह क्यों महत्वपूर्ण है?
Show answer
The water cycle (hydrological cycle) is the continuous movement of water on, above and below the Earth's surface through the processes of evaporation, condensation, precipitation, infiltration and runoff. It is important because it continuously recycles and distributes fresh water across the Earth, replenishes rivers, lakes and groundwater, supports agriculture and ecosystems, and regulates climate and weather. / जल चक्र (जलविज्ञानीय चक्र) पृथ्वी की सतह पर, उसके ऊपर और नीचे वाष्पीकरण, संघनन, वर्षण, अन्तःस्यंदन और प्रवाह की प्रक्रियाओं के माध्यम से जल की सतत गति है। यह महत्वपूर्ण है क्योंकि यह निरंतर मीठे पानी को पुनर्चक्रित और वितरित करता है, नदियों, झीलों और भूजल की पुनः पूर्ति करता है, कृषि और पारिस्थितिकी तंत्र को सहारा देता है, तथा जलवायु और मौसम को नियंत्रित करता है।
-
Name two traditional and two modern methods used to conserve and manage water in India. / भारत में जल के संरक्षण और प्रबंधन के लिए उपयोग की जाने वाली दो पारंपरिक और दो आधुनिक विधियाँ बताइए।
Show answer
Traditional methods: (1) Rainwater harvesting using tanks and johads (village ponds), (2) Step-wells (baoris) to store and access groundwater. Modern methods: (1) Drip irrigation — delivers water directly to plant roots, reducing wastage, (2) Rooftop rainwater harvesting systems in cities that recharge underground aquifers. / पारंपरिक विधियाँ: (1) टंकियों और जोहड़ों (ग्रामीण तालाबों) का उपयोग करके वर्षाजल संचयन, (2) भूजल संचय और उपयोग के लिए बावड़ियाँ। आधुनिक विधियाँ: (1) ड्रिप सिंचाई — पौधों की जड़ों तक सीधे पानी पहुँचाना जिससे बर्बादी कम होती है, (2) शहरों में छत पर वर्षाजल संचयन प्रणालियाँ जो भूमिगत जलभृतों की पुनः पूर्ति करती हैं।
-
Himalayan rivers like the Ganga are called 'perennial rivers'. What does this mean and why are these rivers perennial? / गंगा जैसी हिमालयी नदियों को 'बारहमासी नदियाँ' कहा जाता है। इसका क्या अर्थ है और ये नदियाँ बारहमासी क्यों हैं?
Show answer
Perennial rivers are rivers that flow throughout the year without drying up. Himalayan rivers like the Ganga are perennial because they are fed by two sources: (1) melting of glaciers and snow in the Himalayas during summer provides water even in dry months, and (2) monsoon rains contribute large amounts of water during June–September. This dual supply keeps them flowing year-round. / बारहमासी नदियाँ वे नदियाँ हैं जो पूरे वर्ष बहती रहती हैं और कभी सूखती नहीं। गंगा जैसी हिमालयी नदियाँ बारहमासी हैं क्योंकि उन्हें दो स्रोतों से जल मिलता है: (1) गर्मियों में हिमालय के हिमनदों और बर्फ का पिघलना शुष्क महीनों में भी जल प्रदान करता है, और (2) जून-सितंबर में मानसूनी वर्षा भारी मात्रा में जल प्रदान करती है। इस दोहरी आपूर्ति के कारण ये नदियाँ वर्षभर बहती रहती हैं।
Related Laws & Principles
Explore allFoundational laws & principles behind this chapter. Each one opens a full page — what it says, why it matters, five practice questions and the mistakes to avoid.