Overview
Introduction: This chapter deals with body fluids (blood and lymph) and the mechanisms by which materials are transported around the body — the circulatory system. It explains the composition and functions of blood, the cellular and plasma components, blood groups, haemostasis (clotting), the lymphatic system and the structural and functional organisation of the human heart and blood vessels. Importance: Understanding body fluids and circulation is essential for appreciating how oxygen, nutrients, hormones and wastes are delivered and removed, how immune defence and fluid balance are maintained, and how heart function underlies overall physiology and health. The concepts form the basis for clinical topics such as blood transfusion, cardiovascular diseases and blood pressure regulation. Key themes: - Composition and functions of blood (plasma, formed elements) - Erythrocytes, leukocytes and platelets: structure and roles - Plasma proteins, osmotic balance and transport functions - Blood groups (ABO, Rh) and their significance in transfusion - Haemostasis: platelet plug formation and coagulation cascade (fibrin clot) - Lymph: formation, composition and functions - Types of…
Learning Objectives
- Define blood, plasma, serum and lymph and state their major components
- Describe the structure, formation and functions of erythrocytes, leukocytes and platelets
- Explain the mechanisms of haemostasis, including platelet plug formation and blood coagulation, and the role of fibrin
- Differentiate between the ABO and Rh blood group systems and explain their significance in blood transfusion and haemolytic disease of the newborn
- State the composition and physiological functions of plasma proteins (albumin, globulins and fibrinogen)
- Identify the components of the cardiac conduction system and explain their roles in initiation and propagation of cardiac impulses
- Illustrate the structure of the human heart and trace the pathway of blood through its chambers, valves and major blood vessels
- Explain the cardiac cycle and correlate its phases with changes in atrial and ventricular pressures and the origin of heart sounds (S1, S2)
Topics in this chapter
30 topics · tap a topic title to jump straight to it.
Body fluids
What are body fluids?
Body fluids are the liquids present in the body that transport nutrients, gases, wastes and help maintain homeostasis. They are distributed in distinct compartments: intracellular fluid (ICF) and extracellular fluid (ECF). The ECF is further divided into plasma (liquid part of blood), interstitial fluid (fluid between cells), lymph and transcellular fluids (e.g., cerebrospinal fluid, synovial fluid, aqueous humor).
Compartments and typical proportions
- Total body water ≈ 60% of body weight in adult males (≈50–55% females).
- ICF ≈ 2/3 of total body water (about 40% of body weight).
- ECF ≈ 1/3 of total body water (about 20% of body weight): plasma ≈ 4–5% and interstitial fluid ≈ 15% of body weight.
Composition differences — why they matter
- ICF: high K+, Mg2+, organic phosphates; low Na+, Ca2+.
- ECF (plasma/interstitium): high Na+, Cl−, HCO3−; low K+. Plasma differs from interstitial fluid mainly by having plasma proteins (albumin, globulins, fibrinogen).
- These composition differences create osmotic/electrical gradients that determine water and ion movements across membranes.
Functions of body fluids
- Transport of oxygen, nutrients, hormones, and waste products.
- Maintain blood volume and pressure (plasma).
- Provide medium for biochemical reactions and temperature regulation.
- Act as a reservoir for electrolytes and water.
Fluid movement and balance
Movement between plasma and interstitial fluid across capillaries is governed by Starling forces: hydrostatic pressure (pushes fluid out) and oncotic (colloid osmotic) pressure from plasma proteins (pulls fluid in). Lymphatic vessels return excess interstitial fluid to the circulation.
Clinical correlations (short)
- Edema — excess interstitial fluid due to increased capillary hydrostatic pressure (e.g., heart failure), decreased plasma oncotic pressure (e.g., hypoalbuminemia in nephrotic syndrome), increased capillary permeability (inflammation), or lymphatic obstruction.
- Dehydration — loss of water (and sometimes Na+) causing decreased plasma volume, concentrated blood (high hematocrit) and dizziness, low blood pressure.
- Hyponatremia — low plasma Na+ causing water shift into cells and possible cerebral edema.
- Use of IV fluids: isotonic saline restores plasma volume; hypotonic fluids shift water into cells; hypertonic solutions draw water out of cells.
Measurement parameters
- Hematocrit (Hct): fraction of blood volume occupied by red blood cells; used to assess anemia or dehydration.
- Plasma osmolarity: important for evaluating water-electrolyte balance; normal ≈ 280–295 mOsm/L.
- Plasma vs serum: plasma is the liquid portion of anticoagulated blood (contains fibrinogen); serum is plasma minus clotting proteins.
Takeaway
Body fluids and their compartmental distribution are central to transport, homeostasis and clinical conditions. The balance of hydrostatic and osmotic forces plus lymphatic return maintains fluid distribution; disturbances lead to common problems such as edema, dehydration and electrolyte disorders.
- Edema in heart failure: Increased venous pressure raises capillary hydrostatic pressure, promoting fluid filtration into interstitial tissue — seen as swollen ankles.
- Ascites in liver cirrhosis: Low albumin synthesis reduces plasma oncotic pressure, so fluid accumulates in the peritoneal cavity.
- Dehydration after vomiting/diarrhea: Loss of water decreases plasma volume; hematocrit rises and blood pressure may fall.
- Use of intravenous fluids: Isotonic saline (0.9% NaCl) restores ECF volume without major shift into cells; 5% dextrose in water acts as a free-water source after glucose is metabolized and distributes into total body water.
- Hematocrit (Hct) = (Volume of RBCs / Total blood volume) × 100
- Plasma volume = Blood volume × (1 - Hct)
- Van't Hoff (osmotic pressure approximation) π = nCRT (or for dilute solutions π ≈ C·R·T), often used conceptually; clinical osmolarity estimate below
- Clinical plasma osmolarity ≈ 2 × [Na+] (mEq/L) + [Glucose] (mg/dL)/18 + [BUN] (mg/dL)/2.8 (normal ≈ 280–295 mOsm/L)
- Starling equation (net fluid flux across capillary): Jv = Kf × [(Pc - Pi) - σ(πc - πi)] where Pc = capillary hydrostatic pressure, Pi = interstitial hydrostatic pressure, πc = capillary oncotic pressure, πi = interstitial oncotic pressure, Kf = filtration coefficient, σ = reflection coefficient.
Introduction to Body Fluids
What are body fluids?
Body fluids are the liquid components that fill cells and body spaces and carry dissolved substances needed for life. They include intracellular fluid (ICF), extracellular fluid (ECF — plasma and interstitial fluid), and specialized fluids (lymph, cerebrospinal fluid, synovial fluid, etc.). Body fluids perform transport, regulation and protection roles vital to homeostasis.
Compartments and typical volumes
- Total Body Water (TBW): ~60% of body weight in an average adult male (about 42 L in a 70 kg person). Females have slightly lower % because of higher fat content.
- Intracellular Fluid (ICF): ~2/3 of TBW (~28 L in 70 kg person).
- Extracellular Fluid (ECF): ~1/3 of TBW (~14 L). ECF subdivides into:
- Interstitial fluid (≈75–80% of ECF, ~10–11 L)
- Plasma (≈20–25% of ECF, ~3–3.5 L)
Composition and functions
- Plasma (about 55% of whole blood by volume): ~90% water, proteins (albumins, globulins, fibrinogen), electrolytes, nutrients, gases, wastes. Functions: transport, buffering, oncotic pressure maintenance, immunity and clotting.
- Formed elements (about 45% of blood): erythrocytes (RBCs) — oxygen transport via haemoglobin; leukocytes (WBCs) — immunity; platelets — blood clotting.
- ICF: rich in K+, Mg2+, organic phosphates; important for metabolism and enzymatic reactions.
- ECF: rich in Na+, Cl–, HCO3–; main medium for transport between cells and plasma.
Physiological roles
- Transport: gases, nutrients, hormones, metabolites.
- Homeostasis: maintain pH, osmotic balance, temperature, and fluid volumes.
- Protection: immune cells and clotting factors prevent infection and blood loss.
- Exchange: across capillaries (driven by hydrostatic and oncotic pressures) and via the lymphatic system returning excess interstitial fluid to circulation.
Regulation and dynamics
- Fluid shifts occur with changes in osmolarity or pressure (e.g., dehydration raises plasma osmolarity and draws water out of cells).
- Plasma proteins (especially albumin) generate oncotic pressure that pulls water into capillaries; loss of proteins can cause edema.
- The lymphatic system collects excess interstitial fluid and returns it to circulation; blockage causes localized edema.
Important normal values (typical)
- Blood pH: 7.35–7.45
- Plasma osmolarity: ~285–295 mOsm/L
- RBC count: ~4.5–5.5 × 10^6 /µL (male), slightly lower in females
- WBC count: ~4,000–11,000 /µL
- Platelets: ~150,000–450,000 /µL
Clinical and everyday importance
- Dehydration, overhydration, blood loss, infection and malnutrition directly affect fluid compartments and their functions.
- Understanding fluid compartments explains why intravenous fluids, blood transfusions and diuretics work, and why diseases cause edema or dehydration.
- Dehydration during heavy exercise: sweat loss reduces plasma volume, increasing blood osmolarity and drawing water out of cells (cell shrinkage) — symptoms include thirst, concentrated urine and dizziness.
- Edema after low plasma protein (e.g., severe malnutrition or liver disease): reduced plasma oncotic pressure (low albumin) leads to net fluid accumulation in interstitial spaces — visible swelling of ankles or abdomen (ascites).
- Lymphatic blockage (elephantiasis): parasites block lymph vessels, preventing return of interstitial fluid to blood, causing massive swelling of limbs.
- Blood transfusion: replacing lost blood restores plasma volume and oxygen-carrying capacity (RBCs), maintaining tissue perfusion.
- Total Body Water ≈ 0.6 × body weight (kg) for average adult male (use ~0.5 for females) — e.g., 0.6 × 70 kg = 42 L
- Hematocrit (packed cell volume, PCV) = (height of RBC column / total blood column) × 100%
- Estimated blood volume ≈ 70 mL/kg × body weight (kg) (adult average). Example: 70 mL/kg × 70 kg = 4900 mL ≈ 4.9 L
- Van't Hoff (osmotic) equation: π = iCRT (π = osmotic pressure; i = van't Hoff factor; C = molar concentration; R = gas constant; T = temperature in K)
- Starling (net filtration) concept (simplified): Net filtration = Kf × [(Pc − Pi) − (πc − πi)] where Pc = capillary hydrostatic pressure, Pi = interstitial hydrostatic pressure, πc = capillary oncotic pressure, πi = interstitial oncotic pressure, Kf = filtration coefficient
Blood composition
Overview
Blood is a specialised connective tissue that circulates in the cardiovascular system. It consists of a liquid matrix (plasma) and suspended cellular elements (formed elements). Typical proportions: plasma ≈55% of blood volume; formed elements ≈45% (mainly red blood cells). Blood transports gases, nutrients, wastes, hormones, and participates in immunity, thermoregulation and clotting.
Plasma
Plasma is a pale yellow fluid (~90–92% water) that contains dissolved substances:
- Plasma proteins (7–8%): albumin (maintains osmotic/colloid pressure and transports small molecules), globulins (immune functions, transport), fibrinogen (clotting precursor).
- Inorganic salts / electrolytes: Na+, K+, Ca2+, Mg2+, Cl−, HCO3− (help maintain pH, osmotic balance, membrane potentials).
- Solutes: glucose, amino acids, lipids (in lipoproteins), hormones, enzymes, metabolic wastes (urea, creatinine), dissolved gases (O2, CO2).
Formed elements
These are produced in bone marrow (haematopoiesis):
- Red blood cells (erythrocytes): biconcave, anucleate cells packed with haemoglobin (Hb) that transport O2 and some CO2. Lifespan ≈120 days. Normal counts: males ~4.6–6.0 million/µL, females ~4.0–5.5 million/µL.
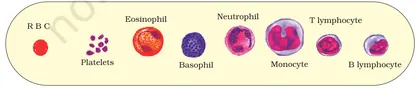
- White blood cells (leucocytes): nucleated cells of the immune system. Two groups: granulocytes (neutrophils—phagocytosis; eosinophils—parasites/allergy; basophils—allergic responses) and agranulocytes (lymphocytes—adaptive immunity; monocytes/macrophages—phagocytosis and antigen presentation). Normal total WBC: ~4,000–11,000/µL.
- Platelets (thrombocytes): small cell fragments from megakaryocytes; essential for blood clotting and vessel repair. Normal count: ~150,000–450,000/µL.
Key values used in class 11/CBSE
Plasma ≈55% of blood volume; formed elements ≈45% (hematocrit ~45%). Haemoglobin: males ≈13–18 g/dL, females ≈12–16 g/dL (approx.).
Functional links
- Albumin maintains oncotic pressure; low albumin (liver disease, malnutrition) causes oedema.
- Fibrinogen is converted to insoluble fibrin during clotting (prevents blood loss).
- RBC count/Hb determine oxygen-carrying capacity; low Hb = anaemia (tiredness, pallor), high RBC (polycythaemia) increases blood viscosity.
Short note on clotting
When vessels are injured, platelets form a plug and the coagulation cascade converts fibrinogen to fibrin (via thrombin) to stabilise the clot. Clotting factors require Ca2+ and vitamin K for synthesis.
Clinical relevance / home situations
- Complete Blood Count (CBC) measures RBC, WBC, platelet counts, Hb and hematocrit; used to diagnose infections, anaemia, clotting disorders.
- Dehydration reduces plasma volume (hematocrit rises); excessive bleeding reduces both plasma and RBCs. Blood donation removes ~450 mL and stimulates marrow to replace RBCs.
- Dehydration after heavy exercise: plasma volume falls → hematocrit (proportion of RBCs) appears higher even though RBC mass is unchanged.
- Anaemia (iron deficiency): low haemoglobin concentration → reduced oxygen-carrying capacity, symptoms include fatigue and breathlessness.
- Infection (e.g., bacterial): neutrophil count rises (neutrophilia) seen in CBC; viral infections often show lymphocytosis.
- Haemophilia: deficiency of certain clotting factors leads to impaired fibrin formation and excessive bleeding despite normal platelet count.
- High-altitude acclimatisation: body increases RBC production (erythropoiesis) raising hematocrit and Hb to improve oxygen delivery.
- Blood donation: removal of ~450 mL reduces total blood volume; plasma is restored within ~24-48 hours, RBCs take weeks to months to fully replace.
- Hematocrit (Hct, %) = (Volume of RBCs / Total blood volume) × 100
- Mean Corpuscular Volume (MCV, fL) = (Hematocrit (%) × 10) / RBC count (in millions/µL)
- Mean Corpuscular Haemoglobin (MCH, pg) = (Haemoglobin (g/dL) × 10) / RBC count (in millions/µL)
- Mean Corpuscular Haemoglobin Concentration (MCHC, g/dL) = (Haemoglobin (g/dL) × 100) / Hematocrit (%)
- Approx. plasma osmolarity (mOsm/L) = 2 × [Na+ (mEq/L)] + [Glucose (mg/dL)]/18 + [BUN (mg/dL)]/2.8 (used in clinical context)
Composition of Blood
Overview
Blood is a specialised connective tissue that circulates through the cardiovascular system. It consists of a liquid matrix — plasma — and suspended formed elements: red blood cells (erythrocytes), white blood cells (leukocytes) and platelets (thrombocytes). Typical whole blood is about 55% plasma and 45% cellular elements (by volume).
Plasma (about 55% of blood volume)
- Water: 90–92% — solvent and transport medium.
- Plasma proteins (7–8%):
- Albumin — maintains oncotic pressure, transports fatty acids and drugs.
- Globulins — include antibodies (immunoglobulins) and transport proteins.
- Fibrinogen — soluble clotting factor; converted to fibrin during coagulation.
- Electrolytes: Na+, K+, Ca2+, Mg2+, Cl-, HCO3- — important for osmotic balance and pH buffering.
- Nutrients: glucose, amino acids, lipids; metabolic wastes: urea, creatinine; gases: dissolved O2 and CO2; hormones and enzymes.
Formed elements (about 45%: cellular components)
- Red blood cells (RBC, erythrocytes)
- Structure: biconcave, anucleate in mammals, ~7–8 μm diameter — large surface area for gas exchange and flexible to pass capillaries.
- Function: transport O2 (bound to haemoglobin) and assist CO2 transport.
- Haemoglobin: each molecule = 4 globin chains + 4 heme groups (each heme binds one O2).
- Life span ≈120 days; produced in red bone marrow (erythropoiesis) under control of erythropoietin (kidney hormone).
- Normal counts (approx.): males 4.5–5.5 ×10^6/µL, females 4.0–5.0 ×10^6/µL; Hb ≈13.5–17.5 g/dL (males), 12.0–15.5 g/dL (females).
- White blood cells (WBC, leukocytes)
- Types: granulocytes — neutrophils (phagocytosis, 50–70%), eosinophils (parasites, allergy, 1–4%), basophils (inflammation, <1%); agranulocytes — lymphocytes (B & T cells, 20–40%), monocytes (differentiate to macrophages, 2–8%).
- Functions: defence against infection, immunity, inflammation and tissue repair.
- Platelets (thrombocytes)
- Small, anucleate cell fragments derived from megakaryocytes; count ≈150,000–400,000/µL.
- Function: primary haemostasis — form platelet plug and release factors that promote clotting; important in wound repair.
Hematopoiesis
All formed elements arise from pluripotent haematopoietic stem cells in bone marrow. Differentiation is regulated by growth factors/cytokines (e.g., erythropoietin for RBCs, thrombopoietin for platelets, various interleukins and colony-stimulating factors for WBCs).
Clinical significance / Examples: anaemia (low Hb/RBC → fatigue), polycythemia (high RBC → increased viscosity), leucopenia/leukocytosis (low/high WBC → vulnerability or infection/inflammation), thrombocytopenia (bleeding tendency), effects of dehydration (increased haematocrit) and altitude (increased RBC production).
Normal reference values summary (approx.)
- Plasma: ~55% of blood volume
- RBC: 4–6 ×10^6/µL
- WBC: 4,000–11,000/µL
- Platelets: 150,000–400,000/µL
- Hb: males ~13.5–17.5 g/dL, females ~12–15.5 g/dL
Key practical tests: Complete Blood Count (CBC) gives RBC, WBC, platelet counts, Hb, haematocrit (PCV) and red cell indices (MCV, MCH, MCHC) used to diagnose types of anaemia and other disorders.
- Blood donation: removal of ~350–450 mL reduces RBC mass temporarily; body restores volume via plasma expansion then RBCs over weeks — illustrates plasma vs formed element replacement.
- Anaemia (iron deficiency): low haemoglobin and MCV (microcytic anaemia); causes fatigue and pallor — shows importance of haemoglobin/RBC in oxygen transport.
- Dehydration: loss of plasma water increases haematocrit (PCV) even though total RBC number unchanged — explains changes in blood concentration.
- Living at high altitude: hypoxia stimulates erythropoietin → increased RBC production and higher haematocrit to carry more oxygen.
- Injury and bleeding: platelets form a plug and fibrinogen is converted to fibrin to stop bleeding — demonstrates clotting role of plasma proteins and platelets.
- Packed cell volume (PCV or haematocrit) = (Volume of RBCs / Total blood volume) × 100%
- Mean Corpuscular Volume (MCV in fL) = (Haematocrit (%) × 10) / RBC count (10^6/µL)
- Mean Corpuscular Hemoglobin (MCH in pg) = (Hemoglobin (g/dL) × 10) / RBC count (10^6/µL)
- Mean Corpuscular Hemoglobin Concentration (MCHC g/dL) = (Hemoglobin (g/dL) × 100) / Haematocrit (%)
- Approximate blood volume = body mass × blood volume factor (males ≈ 70 mL/kg, females ≈ 65 mL/kg)
Plasma
What is plasma?
Plasma is the liquid, extracellular portion of blood in which cells (red blood cells, white blood cells and platelets) are suspended. It constitutes about 55% of total blood volume and is a pale yellow, slightly viscous fluid whose main role is transport and homeostasis.
Composition (approximate normal values)
- Water: 90–92% (solvent for solutes)
- Proteins: 7–8 g/dL (≈7–8% by weight) — mainly: albumin (~60% of plasma proteins), globulins (~36%), fibrinogen (~4%)
- Electrolytes & inorganic ions: Na+ ≈ 135–145 mmol/L, K+ ≈ 3.5–5 mmol/L, Cl- ≈ 98–106 mmol/L, HCO3- ≈ 22–28 mmol/L, Ca2+ (total) ≈ 2.2–2.6 mmol/L
- Gases: dissolved O2, CO2 (most CO2 carried as bicarbonate in plasma)
- Nutrients/wastes/hormones: glucose ≈ 70–110 mg/dL, amino acids, lipids, urea, creatinine, hormones
- Other: clotting factors (e.g., fibrinogen), antibodies (immunoglobulins), transport proteins
Key functions
- Transport: carries nutrients, hormones, gases (dissolved), metabolic wastes and heat.
- Osmotic balance and fluid distribution: plasma proteins (mainly albumin) generate oncotic (colloid osmotic) pressure that retains water in the vascular compartment.
- Buffering: plasma bicarbonate and proteins help maintain blood pH (~7.4).
- Immunity: globulins (immunoglobulins) provide humoral immunity.
- Coagulation: plasma contains clotting factors (fibrinogen) required for blood clot formation.
- Homeostasis and transport of drugs and metabolites via binding to plasma proteins.
Plasma vs Serum
Plasma is obtained from anticoagulated blood and contains fibrinogen and clotting factors. Serum is obtained after blood clotting and therefore lacks fibrinogen and most clotting factors.
Clinical importance and regulation
- Low plasma albumin (hypoalbuminaemia) reduces oncotic pressure → fluid leaks into interstitium → edema (seen in malnutrition, liver disease, nephrotic syndrome).
- Plasma volume changes with hydration: dehydration reduces plasma volume and can concentrate plasma solutes; intravenous fluids (e.g., normal saline) expand plasma volume.
- Plasma is used therapeutically (fresh frozen plasma, plasma-derived products) and diagnostically (biochemical tests performed on plasma/serum).
- Plasma proteins are synthesized mainly in the liver (except immunoglobulins produced by plasma cells).
Role in capillary exchange — Starling forces (brief)
Fluid exchange between plasma (capillary) and interstitium is governed by hydrostatic and oncotic pressures: capillary hydrostatic pressure tends to push fluid out; plasma oncotic pressure (mainly due to albumin) tends to pull fluid in. Disturbances in these forces cause edema.
Normal numeric values (summary)
- Plasma volume ≈ 55% of blood; blood plasma protein concentration ≈ 7–8 g/dL
- Plasma osmolarity ≈ 285–295 mOsm/L
- Plasma oncotic pressure ≈ 25 mmHg (approx)
- pH ≈ 7.35–7.45
- Dehydration after vigorous exercise: plasma volume falls, plasma becomes more concentrated (higher hematocrit), and athletic performance may be impaired.
- Kwashiorkor or severe liver disease: low albumin production → decreased plasma oncotic pressure → generalized edema.
- Plasma donation and plasma transfusion (e.g., Fresh Frozen Plasma) used to replace clotting factors in hemorrhage or coagulopathy.
- Administration of intravenous saline or colloid plasma expanders to restore plasma volume in hypovolemic shock.
- Hyperlipidemia producing turbid (lipemic) plasma visible after blood centrifugation; used as a clinical clue.
- Measurement of blood glucose and electrolytes in plasma/serum for diagnosis and monitoring of diabetes and electrolyte disorders.
- Hematocrit (%) = (Volume of RBCs / Total blood volume) × 100
- Plasma volume = Blood volume × (1 − Hematocrit fraction)
- Estimated blood volume (approx.): adult male ≈ 70 mL/kg × body weight (kg); adult female ≈ 65 mL/kg × body weight
- Van't Hoff (osmotic pressure, ideal approximation): π = nRT / V or π = CRT (C = molar concentration, R = gas constant, T = temperature)
- Starling equation (net fluid movement across capillary): Jv = Kf × [(Pc − Pi) − σ(πc − πi)] where Pc = capillary hydrostatic pressure, Pi = interstitial hydrostatic pressure, πc = capillary oncotic pressure, πi = interstitial oncotic pressure, Kf = filtration coefficient, σ = reflection coefficient
Plasma Proteins
Definition & overview: Plasma proteins are soluble proteins present in blood plasma that perform key roles in maintaining fluid balance, transport, defence, coagulation and buffering. Total plasma protein concentration in a healthy human is about 6.5–8.0 g/dL (65–80 g/L).
Major classes:
- Albumin (≈55–60% of total): smallest and most abundant plasma protein, synthesized in the liver. Maintains colloid (oncotic) pressure, transports fatty acids, bilirubin and drugs.
- Globulins (α1, α2, β, γ): include transport proteins, acute-phase proteins and immunoglobulins. γ-globulins (immunoglobulins) are produced by plasma cells (B‑lymphocytes).
- Fibrinogen (0.2–0.4 g/dL): soluble clotting factor synthesized in the liver; converted to fibrin during coagulation.
- Regulatory proteins: enzymes, hormones and complement proteins.
Synthesis & turnover: Most plasma proteins (albumin, fibrinogen, many globulins) are synthesized in the liver; immunoglobulins are made by plasma cells. Proteins are cleared by the reticuloendothelial system and renal loss (if filtration barrier damaged). Approximate half-lives: albumin ≈ 20 days, IgG ≈ 21 days (others shorter).
Functions:
- Colloid osmotic (oncotic) pressure: albumin is the main contributor (≈70–80% of oncotic pressure), preventing excessive plasma water loss into interstitium and thus preventing oedema.
- Transport: lipids, hormones, bilirubin, metal ions and many drugs bind to plasma proteins (mainly albumin and some globulins).
- Immunity: antibodies (γ‑globulins) neutralize pathogens; complement proteins aid opsonization and lysis.
- Coagulation: fibrinogen and clotting factors are essential for blood clot formation.
- Buffering & enzyme activity: plasma proteins contribute to acid–base buffering and include many enzymes.
Clinical correlations (short):
- Hypoproteinaemia/hypoalbuminaemia (e.g., nephrotic syndrome, liver disease, malnutrition/kwashiorkor) → reduced oncotic pressure → oedema.
- Hyperproteinaemia (relative) in dehydration — proteins concentrate because of water loss.
- Multiple myeloma → monoclonal increase in γ‑globulins visible as an M‑spike on serum protein electrophoresis.
- Acute inflammation → increased acute‑phase proteins (CRP, fibrinogen, α1/α2 globulins) and decreased albumin (negative acute‑phase protein).
Laboratory & diagnostic points: Serum protein electrophoresis separates albumin and globulin fractions and shows characteristic peaks (albumin largest). Total protein, albumin and globulin fractions (or albumin/globulin ratio) are routine tests.
Normal numeric ranges (typical):
- Total plasma protein: 6.5–8.0 g/dL (65–80 g/L)
- Albumin: 3.5–5.0 g/dL (35–50 g/L)
- Globulins (total): 2.5–3.5 g/dL (25–35 g/L)
- Fibrinogen: 0.2–0.4 g/dL (2–4 g/L)
- Albumin : Globulin (A/G) ratio: ≈ 1.1–2.5
Takeaway: Plasma proteins are essential for maintaining vascular volume (oncotic pressure), transporting substances, defending against infection, and enabling coagulation. Changes in concentration or pattern point to specific clinical states (liver disease, kidney disease, inflammation, plasma cell disorders).
- Nephrotic syndrome: large loss of albumin in urine → hypoalbuminaemia → decreased plasma oncotic pressure → generalized oedema.
- Kwashiorkor (severe protein malnutrition): low plasma proteins, especially albumin → oedema and fatty liver.
- Multiple myeloma: proliferation of a single clone of plasma cells produces excess monoclonal immunoglobulin → spike in γ globulin region on serum protein electrophoresis; may cause hyperviscosity.
- Acute inflammation or infection: increased acute-phase proteins such as C‑reactive protein and fibrinogen (α and β globulin fractions) with relative decrease in albumin.
- Total plasma protein (g/dL) = Albumin (g/dL) + Globulins (g/dL)
- A/G ratio = Albumin (g/dL) / Globulins (g/dL)
- Conversion: 1 g/dL = 10 g/L (so 6.5 g/dL = 65 g/L)
- Van 't Hoff (ideal solute approximation for osmotic pressure): π = C·R·T (π = osmotic pressure, C = molar concentration, R = gas constant, T = temperature). Note: plasma proteins are not ideal solutes, but van 't Hoff gives conceptual basis; albumin provides ~70–80% of colloid osmotic pressure in physiological range.
Formed elements
Definition: Formed elements are the cellular components suspended in blood plasma — red blood cells (erythrocytes), white blood cells (leukocytes) and platelets (thrombocytes). They are produced mainly in bone marrow from hematopoietic stem cells and perform transport, defense and clotting functions.
Components & key features
- Red blood cells (RBCs / erythrocytes): Biconcave, anucleate cells (in mammals) about 7–8 μm in diameter, rich in haemoglobin. Primary function: transport O2 (bound to Hb) and CO2 (dissolved/converted to bicarbonate). Lifespan ≈120 days; removed by spleen/liver.
- White blood cells (WBCs / leukocytes): Nucleated immune cells. Two major groups:
- Granulocytes: neutrophils (phagocytosis of bacteria), eosinophils (parasites, allergy), basophils (inflammation, histamine)
- Agranulocytes: lymphocytes (B cells, T cells — adaptive immunity), monocytes (differentiate into macrophages; phagocytosis)
- Platelets (thrombocytes): Small membrane-bound cell fragments formed from megakaryocytes. Key role in blood clotting (hemostasis) by forming platelet plug and supporting coagulation cascade. Lifespan ≈7–10 days.
Normal clinical ranges (typical): RBC: ~4–6 million/µL (varies by sex/age); Hb: ~12–17 g/dL; WBC: ~4,000–11,000/µL; Platelets: ~150,000–450,000/µL; Hematocrit (PCV): ~38–52% (sex-dependent). These are guideline values used in diagnosis (anemia, leucocytosis, thrombocytopenia, etc.).
Physiological notes: Hematopoiesis in bone marrow maintains counts. Counts change with conditions: e.g., high altitude, training or erythropoietin increase RBC; bacterial infection raises neutrophils; viral infection often raises lymphocytes; dengue can cause severe thrombocytopenia causing bleeding risk.
Clinical importance: CBC (complete blood count) measures formed elements and indices (MCV, MCH, MCHC, hematocrit) — essential for diagnosing anemia types, infections, clotting disorders and monitoring therapy.
- A person with iron-deficiency anemia shows low haemoglobin, low RBC count and low MCV (microcytic anemia).
- Bacterial infection often results in neutrophilia (raised neutrophil count) observed in WBC differential.
- Dengue fever may cause thrombocytopenia (low platelet count) leading to bleeding tendencies.
- Living at high altitude increases RBC count and haemoglobin as adaptation to lower oxygen availability.
- Bone marrow transplant restores normal formed elements in patients with aplastic anaemia or leukemia after treatment.
- Hematocrit (PCV, %) ≈ (RBC count in millions/µL × MCV in fL) / 10
- MCV (mean corpuscular volume, fL) = (Hematocrit (%) × 10) / RBC (millions/µL)
- MCH (mean corpuscular haemoglobin, pg) = (Hemoglobin (g/dL) × 10) / RBC (millions/µL)
- MCHC (mean corpuscular haemoglobin concentration, g/dL) = (Hemoglobin (g/dL) × 100) / Hematocrit (%)
- Total WBC count (cells/µL) = sum of all leucocyte types; Differential count (%) gives proportion of each type — absolute count of a type = (differential % × total WBC) / 100
Formed Elements of Blood
Definition & overview: Formed elements are the cellular components suspended in blood plasma. They constitute about 40–45% of blood volume (hematocrit), the remainder being plasma. The main formed elements are erythrocytes (red blood cells, RBCs), leukocytes (white blood cells, WBCs) and thrombocytes (platelets).
Erythrocytes (Red blood cells)
- Structure: Biconcave, disc-shaped cells; ~7–8 µm diameter in humans; anucleate in mature mammalian RBCs to maximize space for hemoglobin.
- Function: Transport O2 (bound to hemoglobin) from lungs to tissues and help transport a small fraction of CO2 back to lungs.
- Key facts: Normal count ≈ 4.5–6.0 million/µL in males, 4.0–5.5 million/µL in females. Life span ≈ 120 days. Produced in bone marrow (erythropoiesis) under control of erythropoietin (EPO).
- Clinical relevance: Anemia (low RBC/Hb) → fatigue; polycythemia (high RBC) → increased blood viscosity.
Leukocytes (White blood cells)
- Divided into granulocytes and agranulocytes:
- Granulocytes:
- Neutrophils — most abundant; first responders to bacterial infection (phagocytosis).
- Eosinophils — combat parasites; involved in allergic responses.
- Basophils — release histamine & heparin; mediate inflammatory/allergic reactions.
- Agranulocytes:
- Lymphocytes — B cells (antibody production) and T cells (cell-mediated immunity); key to adaptive immunity.
- Monocytes — circulate briefly then become macrophages in tissues (phagocytosis, antigen presentation).
- Key facts: Normal total WBC count ≈ 4,000–11,000/µL. Lifespans vary: neutrophils hours–days, lymphocytes months–years.
- Clinical relevance: Leukocytosis = infection/inflammation; leukopenia = immunosuppression; leukemia = malignant proliferation of WBCs.
Platelets (Thrombocytes)
- Structure & origin: Small (2–4 µm) cell fragments derived from megakaryocytes in bone marrow.
- Function: Primary hemostasis — adhere to damaged endothelium, form platelet plug; provide surface for coagulation cascade leading to fibrin clot formation.
- Key facts: Normal count ≈ 150,000–450,000/µL. Lifespan ≈ 7–10 days.
- Clinical relevance: Thrombocytopenia → bleeding risk; thrombocytosis → thrombosis risk; hemophilia involves deficiency of clotting factors (not platelets).
Hematopoiesis & regulation: All formed elements arise from multipotent hematopoietic stem cells (HSCs) in bone marrow. Specific hormones regulate lineages: erythropoietin (RBCs), thrombopoietin (platelets), various cytokines for WBCs.
Summary of typical values (adult, approximate):
- Hematocrit (Hct): males ~40–54%, females ~37–47%
- RBC count: 4.0–6.0 ×10^6/µL
- WBC count: 4.0–11.0 ×10^3/µL
- Platelets: 150–450 ×10^3/µL
Clinical/functional link: Changes in counts or morphology of formed elements are diagnostic (e.g., RBC indices identify types of anemia; differential WBC count points to bacterial vs viral infection; platelet count and function explain bleeding disorders).
- Anemia after heavy menstrual bleeding: reduced RBC count and hemoglobin → tiredness and pallor.
- Acute bacterial infection: neutrophil count increases (neutrophilia) — helps identify bacterial cause.
- After bone marrow suppression (chemotherapy): pancytopenia — low RBC, WBC and platelets leading to fatigue, infections, and bleeding.
- Hemophilia A: normal platelet count but deficient clotting factor VIII → excessive bleeding; shows that platelets and clotting factors are distinct components of hemostasis.
- Polycythemia in high altitude dwellers: increased RBC count and hematocrit to improve O2-carrying capacity.
- Immune response to viral infection: lymphocytosis (increased lymphocytes) as adaptive immunity ramps up.
- Hematocrit (Hct, %) = (Volume of RBCs / Total blood volume) × 100
- MCV (mean corpuscular volume, fL) = (Hct (%) × 10) / RBC count (millions/µL)
- MCH (mean corpuscular hemoglobin, pg) = (Hemoglobin (g/dL) × 10) / RBC count (millions/µL)
- MCHC (mean corpuscular hemoglobin concentration, g/dL) = (Hemoglobin (g/dL) × 100) / Hct (%)
- Absolute count of a WBC type = Total WBC count × (% of that type in differential) / 100
Erythrocytes and haemoglobin
Overview
Erythrocytes (red blood cells, RBCs) are biconcave, anucleate cells specialized for respiratory gas transport. Haemoglobin (Hb) is the iron-containing protein inside RBCs that binds oxygen (O2) and carbon dioxide (CO2).
Structure and physical features of erythrocytes
- Shape: biconcave disc — increases surface area and deformability.
- Size: ~7–8 µm diameter; thickness ~2 µm at rim, 1 µm at centre.
- Nucleus: absent in mature RBCs (in mammals) to maximize space for Hb.
- Lifespan: ~120 days in peripheral blood; removed by spleen, liver (Kupffer cells).
- Number (normal ranges):
- Males: ~4.5–5.5 million/µL
- Females: ~4.0–4.9 million/µL
Haemoglobin: composition and types
- Each Hb molecule = 4 globin polypeptide chains + 4 heme groups.
- Heme = protoporphyrin IX + central ferrous iron (Fe2+) that binds O2.
- Adult Hb types: HbA (α2β2, ~97%), HbA2 (α2δ2, ~2.5%), HbF (α2γ2, ~<1%).
- 1 g Hb can bind ~1.34 mL O2 when fully saturated.
- Normal Hb concentration:
- Males: ~13.5–17.5 g/dL
- Females: ~12.0–15.5 g/dL
Erythropoiesis (formation of RBCs)
- Site: fetal — yolk sac, liver, spleen; after birth — red bone marrow (vertebrae, ribs, sternum, pelvis, proximal limb bones).
- Stages: haematopoietic stem cell → CFU-E → proerythroblast → basophilic → polychromatophilic → orthochromatic erythroblast → reticulocyte → mature RBC.
- Regulation: erythropoietin (EPO) from kidney in response to hypoxia stimulates RBC production.
Functions
- Oxygen transport: Hb binds O2 in lungs (high PO2) and releases in tissues (low PO2).
- Carbon dioxide transport: CO2 carried as dissolved CO2, carbaminohaemoglobin (bound to globin), and mostly as bicarbonate (HCO3−) after conversion by carbonic anhydrase inside RBCs.
- Buffering: Hb helps maintain acid–base balance by binding H+.
Oxygen binding kinetics and cooperativity
- Binding is cooperative: when one O2 binds, Hb's affinity for the next O2 increases; dissociation curve is sigmoidal (oxygen dissociation curve).
- Factors shifting the curve right (decreasing O2 affinity, promoting O2 release): ↑CO2, ↓pH (Bohr effect), ↑temperature, ↑2,3-BPG. Left shifts have the opposite effects.
CO2 transport and the chloride shift
- CO2 enters RBCs → converted to H2CO3 by carbonic anhydrase → dissociates to H+ and HCO3−. HCO3− is exchanged for Cl− (chloride shift) to export bicarbonate into plasma.
- Some CO2 binds directly to amino groups on globin to form carbaminohaemoglobin.
Clinical correlations
- Anemia: low Hb or RBC count — symptoms include pallor, fatigue, breathlessness. Common types: iron-deficiency (microcytic), megaloblastic (B12/folate deficiency, macrocytic), hemolytic, aplastic.
- Polycythemia: elevated RBC mass (e.g., high altitude, doping with EPO) increases blood viscosity.
- Hemoglobinopathies: sickle cell disease (mutant β chain, polymerization on deoxygenation), thalassemias (reduced globin chain synthesis).
- Laboratory indices used to evaluate RBCs and Hb: Hb concentration, hematocrit (PCV), RBC count, MCV, MCH, MCHC, reticulocyte count.
Important laboratory values
- Hematocrit / Packed cell volume (PCV): males ~40–54%, females ~37–47%.
- Mean corpuscular volume (MCV): ~80–100 fL.
- Mean corpuscular hemoglobin (MCH) and mean corpuscular hemoglobin concentration (MCHC): used to classify anemia.
Summary
Erythrocytes and haemoglobin are central to respiration and acid–base homeostasis. Their formation, structure, and biochemical properties (cooperativity, Bohr effect) explain how O2 and CO2 are efficiently loaded and unloaded in lungs and tissues. Abnormalities in numbers, structure or Hb function lead to clinically important disorders.
- Iron-deficiency anemia in adolescent girls — low Hb, microcytic RBCs, fatigue and pallor; diagnosed by low Hb, low MCV and low serum ferritin.
- High-altitude acclimatization — sustained low oxygen triggers increased erythropoietin (EPO) → higher RBC mass and Hb (polycythemia) to improve O2 transport.
- Sickle cell disease — single amino-acid substitution in β chain (Glu → Val) causes HbS polymerization on deoxygenation, deforming RBCs and causing vaso-occlusion and hemolysis.
- Blood transfusion therapy — raises circulating Hb quickly in severe anemia; blood typing and crossmatch required because Hb/RBCs are cellular products.
- Athletic doping with recombinant EPO — increases RBC mass and performance but raises risk of thrombosis due to hyperviscosity.
- Packed cell volume (PCV, %) = (Volume of RBCs / Total blood volume) × 100
- Mean corpuscular volume (MCV, fL) = (PCV (%) × 10) / RBC count (million/µL)
- Mean corpuscular hemoglobin (MCH, pg) = (Hemoglobin (g/dL) × 10) / RBC count (million/µL)
- Mean corpuscular hemoglobin concentration (MCHC, g/dL) = (Hemoglobin (g/dL) × 100) / PCV (%)
- Oxygen content of arterial blood (mL O2 per 100 mL blood) = (1.34 × Hb (g/dL) × SaO2 (as fraction)) + (0.003 × PaO2 (mm Hg))
- Oxygen carrying capacity approximation: 1 g Hb binds ≈ 1.34 mL O2 (useful to estimate O2 bound to Hb)
Erythrocytes (RBCs)
Definition: Erythrocytes or red blood cells (RBCs) are the most abundant blood cells whose primary function is transport of respiratory gases (mainly O2) and contribution to CO2 transport and blood buffering.
Structure & important features:
- Shape: biconcave disc (7–8 µm diameter in humans) — increases surface area and flexibility.
- Nucleus: absent in mature mammalian RBCs (enucleated) — more space for haemoglobin; non-mammalian vertebrates have nucleated RBCs.
- Major component: haemoglobin (Hb) — a globular protein with 4 subunits, each containing a heme group that binds one O2; so one Hb binds up to 4 O2 molecules.
- Quantity: each RBC contains ~200–300 million Hb molecules (often quoted ≈270 million).
- Lifespan: ~120 days in humans; senescent RBCs removed by macrophages in spleen, liver and bone marrow.
Functions:
- Oxygen transport from lungs to tissues via haemoglobin.
- Partial CO2 transport: CO2 binds to Hb and is also carried as HCO3– in plasma (major route).
- Buffering of blood pH through haemoglobin.
Formation and regulation (Erythropoiesis):
- Site: red bone marrow (primarily in vertebral bodies, ribs, pelvis, ends of long bones in adults).
- Stages: haematopoietic stem cell → proerythroblast → erythroblast (normoblast) → reticulocyte → mature RBC. Nucleus is expelled in the erythroblast stage; reticulocytes enter blood and mature in 1–2 days.
- Regulation: erythropoietin (EPO) secreted by kidney (in response to hypoxia) stimulates RBC production.
- Requirements: iron (for heme), vitamin B12 and folic acid (for DNA synthesis), and amino acids.
Destruction and recycling: Senescent RBCs are phagocytosed by macrophages (mainly spleen). Iron from heme is recycled to marrow; heme is converted to bilirubin and excreted in bile.
Normal values (approx.):
- RBC count: males ≈ 4.5–5.5 × 10^6/µL; females ≈ 4.0–5.0 × 10^6/µL.
- Hemoglobin: males ≈ 13.5–17.5 g/dL; females ≈ 12.0–15.5 g/dL.
- Hematocrit (PCV): males ≈ 40–54%; females ≈ 37–47%.
Clinical relevance / common abnormalities:
- Anemia: reduced RBC count or Hb (iron deficiency, vitamin B12/folate deficiency, hemolytic anemia). Presents with pallor, fatigue, breathlessness.
- Polycythemia: increased RBC mass (primary or secondary e.g., at high altitude) — increases blood viscosity.
- Sickle cell disease: mutation in β-globin → sickled RBCs that block capillaries and hemolyse.
- Malaria: protozoan parasites (Plasmodium spp.) infect and destroy RBCs causing fever and anemia.
Key laboratory indices (brief): Red cell indices help classify anemia:
- MCV (mean corpuscular volume) — size of RBC (microcytic, normocytic, macrocytic).
- MCH (mean corpuscular hemoglobin) — average Hb per RBC.
- MCHC (mean corpuscular hemoglobin concentration) — Hb concentration in packed RBCs (hypochromic, normochromic).
- PCV or hematocrit — fraction of blood volume occupied by RBCs.
Physiology notes: Hemoglobin shows cooperative O2 binding — oxygen dissociation curve is sigmoid. Factors that shift the curve right (lower O2 affinity) include increased CO2, increased H+ (lower pH, Bohr effect), increased temperature and 2,3-BPG — these promote O2 release in tissues.
Summary: Erythrocytes are specialized, flexible, enucleated cells packed with haemoglobin designed for efficient gas transport and buffering. Their production, structure and destruction are tightly regulated to maintain oxygen delivery and metabolic balance.
- High-altitude adaptation: increased RBC count and hematocrit due to higher EPO secretion — improves O2 carrying capacity but increases blood viscosity.
- Iron-deficiency anemia: low hemoglobin and microcytic, hypochromic RBCs — common cause of fatigue and pallor; treated with iron supplements.
- Sickle cell disease: abnormal haemoglobin (HbS) causes RBCs to sickle under low O2, leading to vaso-occlusive crises and hemolysis.
- Blood donation: temporary decrease in RBC mass; bone marrow replaces RBCs over weeks (EPO-mediated).
- Malaria infection: Plasmodium parasites invade and destroy RBCs causing episodic fever and anemia.
- Hematocrit (PCV, %) = (Volume of packed RBCs / Total blood volume) × 100
- MCV (fL) = (Hematocrit (%) × 10) / RBC count (×10^6/µL)
- MCH (pg) = (Hemoglobin (g/dL) × 10) / RBC count (×10^6/µL)
- MCHC (g/dL) = (Hemoglobin (g/dL) × 100) / Hematocrit (%)
Leucocytes
Definition: Leucocytes (white blood cells, WBCs) are nucleated blood cells that defend the body against infection, foreign substances and play roles in immunity.
Basic features:
- Present in blood and tissue fluids; produced mainly in bone marrow (haematopoiesis).
- Normal total WBC count: 4,000–11,000 cells per mm3 (µL).
- Two major groups: granulocytes (have cytoplasmic granules) and agranulocytes (lack visible granules).
Types and characteristics:
- Neutrophils (60–70%): multilobed nucleus; primary phagocytes against bacteria and fungi; short-lived (hours–days); first responders in acute inflammation.
- Eosinophils (1–4%): bilobed nucleus; combat parasitic worms and modulate allergic responses (release enzymes that damage parasites).
- Basophils (0.5–1%): release histamine and heparin; involved in allergic and inflammatory responses.
- Lymphocytes (20–30%): include B cells (produce antibodies), T cells (cell-mediated immunity: helper, cytotoxic) and NK cells (destroy infected/tumour cells); may live days to years.
- Monocytes (2–8%): largest WBCs; circulate for a day then enter tissues to become macrophages/dendritic cells — important for phagocytosis and antigen presentation.
Key functions:
- Phagocytosis: engulfing and digesting microbes (neutrophils, monocyte-derived macrophages).
- Immune response coordination: antigen presentation (macrophages, dendritic cells) and antibody production (B lymphocytes).
- Inflammation mediation: release of cytokines, histamine and other mediators (basophils, mast cells, macrophages).
- Cell-mediated cytotoxicity: T cytotoxic cells and NK cells kill infected or abnormal cells.
Movement and action:
- Diapedesis: WBCs squeeze through capillary endothelium into tissues.
- Chemotaxis: movement toward chemical signals (attractants at infection sites).
- Opsonization: pathogens coated by complement or antibodies are more readily phagocytosed.
Clinical significance:
- Leukocytosis: raised WBC count — common in infections, inflammation, stress, leukaemia.
- Leukopenia: low WBC count — seen in viral infections, bone marrow failure, some drugs (higher infection risk).
- Differential WBC counts help diagnose conditions (e.g., neutrophilia → bacterial infection; lymphocytosis → viral infection; eosinophilia → parasitic/allergic).
Summary: Leucocytes are diverse cells central to innate and adaptive immunity. Their counts, types and behaviour (phagocytosis, antigen presentation, antibody production) determine the body’s response to pathogens and injury.
- Bacterial infection: neutrophil count rises (neutrophilia); pus formed at wound sites contains many dead neutrophils.
- Viral infection (e.g., influenza): lymphocyte proportion increases (lymphocytosis) as adaptive immunity develops.
- Parasitic infestation (e.g., intestinal worms): eosinophil numbers increase to attack parasites.
- Allergy (e.g., hay fever): basophils and mast cells release histamine causing allergic symptoms.
- Leukemia: uncontrolled proliferation of abnormal WBCs leading to very high WBC counts and impaired immunity.
- Absolute count of a WBC type = (Total WBC count per mm³ × Differential % of that WBC) / 100 — Example: if total WBC = 8,000/mm³ and neutrophils = 65%, absolute neutrophils = (8000 × 65) / 100 = 5200/mm³.
- Conversion: 1 mm³ = 1 µL. To convert count per µL to per L multiply by 10⁶ (e.g., 8,000/µL = 8 × 10⁹/L).
- Normal total WBC range (reference) = 4,000–11,000 cells/mm³ (µL).
Leukocytes (WBCs)
Definition
Leukocytes or white blood cells (WBCs) are nucleated cells of blood that defend the body against infections, remove debris, and play major roles in innate and adaptive immunity. They are fewer in number than RBCs and are produced in the bone marrow and some lymphoid organs.
Origin and site of formation
All leukocytes originate from pluripotent haematopoietic stem cells in the bone marrow. Lymphocytes further mature in lymphoid organs: T cells in thymus, B cells in bone marrow (and some maturation in spleen/lymph nodes).
Classification
Leukocytes are classified into two major groups:
- Granulocytes (polymorphonuclear leukocytes): have cytoplasmic granules and multilobed nucleus. Includes
- Neutrophils — most abundant; multilobed nucleus; phagocytic; primary responders to bacterial infection.
- Eosinophils — bilobed nucleus; red/orange granules; combat parasites and participate in allergic responses.
- Basophils — least common; large blue-black granules; release histamine and heparin in allergic/inflammatory reactions.
- Agranulocytes: lack visible granules under light microscope. Includes
- Lymphocytes — small (T cells, B cells, NK cells); major cells of adaptive immunity; antibody production (B cells) and cell-mediated responses (T cells).
- Monocytes — largest WBC; kidney-shaped nucleus; become macrophages/dendritic cells in tissues; phagocytic and antigen-presenting.
Normal counts & differential
Total WBC count in healthy individuals: about 4,000–11,000 cells/mm3 (per µL). Typical differential percentages (approximate):
- Neutrophils: 40–70%
- Lymphocytes: 20–40%
- Monocytes: 2–8%
- Eosinophils: 1–4%
- Basophils: 0.5–1%
Key functional processes
- Diapedesis (emigration): WBCs squeeze through capillary endothelium to reach tissues at sites of infection.
- Chemotaxis: directed movement of leukocytes toward chemical signals (e.g., bacterial products, complement fragments).
- Phagocytosis: engulfment and digestion of microbes/debris. Steps: recognition & attachment → engulfment (phagosome) → fusion with lysosome (phagolysosome) → digestion → exocytosis of residues.
- Antigen presentation: monocytes/macrophages and dendritic cells process antigens and present peptide fragments on MHC II to helper T cells to initiate adaptive responses.
- Antibody production & cell-mediated immunity: B lymphocytes differentiate into plasma cells that secrete antibodies; T lymphocytes (CD8+, CD4+) perform cytotoxic and helper functions.
Lifespan
Varies by type: neutrophils — hours to a few days; eosinophils/basophils — days; monocytes circulate ~1–3 days then become tissue macrophages that can live months to years; lymphocytes — weeks to years (memory cells persist long-term).
Clinical significance / common disorders
- Leukocytosis: increased WBC count — seen in infections (neutrophilia in bacterial infections), inflammation, stress, some leukemias.
- Leukopenia: decreased WBC count — seen in viral infections, certain drugs, aplastic anemia, chemotherapy.
- Neutropenia: low neutrophils — predisposes to bacterial infections.
- Eosinophilia: increased eosinophils — associated with parasitic infections and allergic diseases (asthma, hay fever).
- Abnormal cells (leukemia): uncontrolled proliferation of abnormal leukocytes; diagnosis by blood smear and bone marrow studies.
Identification & staining
Peripheral blood smear stained with Romanowsky stains (Leishman/Giemsa) is used to visualise WBC types (nucleus shapes and granules help identify each type).
Summary
Leukocytes are diverse, mobile immune cells essential for host defence. Their types, counts, and behaviour (phagocytosis, antigen presentation, antibody production) form the basis of innate and adaptive immunity and are important diagnostic indicators in medicine.
- Bacterial infection (e.g., acute appendicitis) causes neutrophilia — a raised neutrophil percentage and total WBC count.
- Viral infections (e.g., infectious mononucleosis) commonly produce lymphocytosis — increased lymphocyte numbers.
- Parasitic worm infection (e.g., filariasis) leads to eosinophilia — higher eosinophil counts.
- Allergic asthma triggers basophil and eosinophil activity and elevated eosinophil percentage in blood.
- Chemotherapy can cause leukopenia by suppressing bone marrow, lowering total WBC count and increasing infection risk.
- Absolute count of a WBC type = Total WBC count × (Differential % of that type) / 100
- Example: Absolute neutrophil count (ANC) = WBC (cells/µL) × (percent neutrophils + percent bands) / 100
- Reference ranges: Total WBC ≈ 4,000–11,000 cells/mm³ (µL); ANC normal often > 1,500 cells/µL (clinically significant neutropenia if ANC < 1,500/µL)
Platelets and Haemostasis
Introduction
Platelets (thrombocytes) are small, anucleate cell fragments derived from megakaryocytes in bone marrow. They are essential for primary haemostasis (formation of platelet plug) and contribute to secondary haemostasis (coagulation/fibrin clot formation).
Origin, structure and normal values
- Produced by fragmentation of megakaryocyte cytoplasm under control of thrombopoietin (TPO).
- Size: 2–4 µm; contain granules (alpha granules with clotting factors, fibrinogen, vWF; dense granules with ADP, Ca2+, serotonin) and contractile proteins (actin–myosin).
- Normal count: 150,000–450,000 platelets/µL (1.5–4.5 × 10^5/µL). Lifespan ~7–10 days.
Steps of Haemostasis
- 1. Vascular spasm (vasoconstriction): Immediate reflex constriction of the injured vessel to reduce blood loss.
- 2. Primary haemostasis — Platelet plug formation
- Endothelial injury exposes subendothelial collagen. von Willebrand factor (vWF) binds collagen and platelets via GPIb receptor (adhesion).
- Platelets become activated, change shape, release ADP, thromboxane A2 (TXA2) and Ca2+ from dense granules (activation).
- Released ADP and TXA2 recruit and activate more platelets; fibrinogen links activated platelets via GPIIb/IIIa receptors (aggregation) to form a temporary platelet plug.
- 3. Secondary haemostasis — Coagulation cascade and fibrin clot
- Coagulation is a series of proteolytic activations leading to thrombin (factor IIa) generation. Thrombin converts soluble fibrinogen (factor I) into insoluble fibrin strands that stabilise the platelet plug.
- Two initiating pathways converge to the common pathway:
- Extrinsic pathway: Tissue factor (TF, factor III) released from damaged tissue activates factor VII — fast.
- Intrinsic pathway: Contact activation (PK, HMWK) activates factor XII → XI → IX (with VIII) — slower but amplifies clotting.
- Common pathway: X → Xa (with V) converts prothrombin (II) to thrombin → fibrin → cross-linking by factor XIII.
- 4. Clot retraction and repair: Platelets contain actin–myosin which contract to compress and stabilise the clot, bringing wound edges closer while platelets release growth factors to help vessel repair.
- 5. Fibrinolysis: As healing occurs, plasminogen (incorporated into clot) is activated by tissue plasminogen activator (tPA) to plasmin, which digests fibrin and dissolves the clot. Regulation prevents excessive bleeding or thrombosis (antithrombin III, protein C & S, thrombomodulin).
Important biochemical cofactors
- Ca2+ (factor IV) is required at multiple steps in the cascade.
- Vitamin K is needed for gamma-carboxylation (activation) of factors II, VII, IX and X and proteins C & S.
Clinical correlations
- Thrombocytopenia (low platelets): bleeding/bruising, petechiae; causes — immune thrombocytopenic purpura, bone marrow failure, dengue.
- Thrombocytosis (high platelets): risk of thrombosis (clot formation).
- Disorders of coagulation: haemophilia A (factor VIII deficiency) causes prolonged bleeding; vitamin K deficiency or warfarin therapy prolongs PT/INR.
- Drugs: Aspirin irreversibly inhibits COX-1 in platelets, reducing TXA2 and platelet aggregation; heparin increases antithrombin activity; warfarin inhibits vitamin K recycling; tPA is used to dissolve life-threatening clots (e.g., in ischemic stroke, MI).
Diagnostic tests
- Platelet count (CBC): quantitative.
- Bleeding time (Ivy): assesses platelet function and primary haemostasis (now less used).
- Prothrombin time (PT) and International Normalised Ratio (INR): evaluate extrinsic & common pathways (factors VII, X, V, II, I).
- Activated partial thromboplastin time (aPTT): evaluates intrinsic & common pathways (XII, XI, IX, VIII, X, V, II, I).
Summary
Platelets initiate and stabilise haemostasis by forming a primary plug, supplying factors and surfaces for coagulation, and contracting clots. Balanced activation and regulation of haemostasis prevent both excessive bleeding and unwanted thrombosis.
- Small cut on the finger: immediate vasoconstriction and platelet plug formation stops bleeding within minutes; a fibrin clot forms later to stabilise the repair.
- Aspirin use: a low-dose aspirin irreversibly inhibits platelet COX‑1, reducing thromboxane A2 and lowering platelet aggregation — used to reduce risk of arterial thrombosis but increases bleeding time.
- Dengue fever: virus-induced thrombocytopenia leads to dangerously low platelets and bleeding tendencies (petechiae, mucosal bleeding).
- Warfarin therapy monitoring: PT/INR is used to adjust warfarin dose because it inhibits vitamin K–dependent clotting factor activation, increasing bleeding risk if INR is too high.
- Acute ischemic stroke treated with tPA (tissue plasminogen activator): promotes plasmin formation and fibrin breakdown to dissolve the clot (time-sensitive therapy).
- Normal platelet count range (per µL): 150,000 – 450,000 platelets/µL
- Conversion: platelets per L = (platelets per µL) × 10^6. Example: 250,000/µL = 250,000 × 10^6 = 2.5 × 10^11/L
- INR (International Normalised Ratio) = (PT_patient / PT_normal)^ISI where ISI = instrument/manufacturer calibration index
- Relationship (qualitative) of thrombin generation: small initiating trigger → amplification (positive feedback via factors V, VIII, XI) → burst of thrombin → fibrin formation (no single simple algebraic formula, but conceptually: thrombin(t) shows a lag phase then rapid exponential rise before being regulated)
Blood Groups and Blood Transfusion
Overview
Blood groups are classifications of blood based on the presence or absence of specific antigenic molecules on the surface of red blood cells (RBCs). The two clinically most important systems are the ABO system and the Rh (D) system. Correct blood grouping and matching are essential for safe blood transfusion.
ABO system
- Antigens: A and B (carbohydrate molecules) on RBC membrane.
- Alleles: IA, IB (codominant) and i (recessive).
- Genotypes and phenotypes:
- IAIA or IAi → blood group A
- IBIB or IBi → blood group B
- IAIB → blood group AB
- ii → blood group O
Rh (D) system
- Antigen: D (protein). If present → Rh-positive (D+); absent → Rh-negative (D−).
- Anti-D antibodies are not naturally present; they develop after exposure (transfusion or pregnancy) and are usually IgG (can cross placenta).
Compatibility rules
- Transfuse RBCs so recipient has no antibodies against donor RBC antigens.
- ABO rule examples: Donor O is safest for ABO because O has no A/B antigens; recipient AB is universal for ABO because AB has no anti-A/anti-B.
- Considering Rh: Rh-negative recipients must not receive Rh-positive blood unless emergency and informed precautions taken.
- Common shorthand: O− = universal donor (for RBC transfusion); AB+ = universal recipient.
Blood typing and cross-matching
- Forward typing: Mix patient RBCs with anti-A and anti-B sera — agglutination shows presence of that antigen.
- Reverse typing: Mix patient plasma with known A and B RBCs — agglutination shows presence of antibodies.
- Anti-D (anti-Rh) serum tests Rh status.
- Cross-match: Mix donor RBCs with recipient serum to detect incompatibility (agglutination or hemolysis indicates mismatch).
Transfusion reactions
- Acute hemolytic transfusion reaction: Occurs minutes–hours after incompatible transfusion (often ABO mismatch). Symptoms: fever, chills, flank pain, hypotension, hemoglobinuria, DIC, shock. Mechanism: recipient antibodies (IgM/IgG) bind donor RBCs → complement activation → intravascular hemolysis.
- Delayed hemolytic reaction: Days to weeks later, usually due to less common RBC antigens; milder hemolysis.
- Allergic and febrile non-hemolytic reactions: due to plasma proteins or cytokines in stored blood.
- Prevention: correct typing, cross-matching, careful monitoring.
Hemolytic disease of the newborn (Erythroblastosis fetalis)
- Occurs when an Rh− mother carries an Rh+ fetus. If fetal RBCs enter maternal circulation (delivery, miscarriage, trauma), the mother may become sensitized and form anti-D IgG. In subsequent Rh+ pregnancies, maternal IgG crosses placenta and causes fetal RBC hemolysis → anemia, hydrops fetalis, jaundice.
- Prevention: Administer anti-D immunoglobulin (Rho(D) immune globulin) to Rh− mothers after delivery of an Rh+ baby and after events causing fetomaternal hemorrhage; this prevents maternal sensitization by neutralizing fetal RBCs before antibody formation.
Storage and blood components
- Whole blood is usually separated into packed RBCs, platelets, fresh frozen plasma (FFP), cryoprecipitate.
- Typical storage times: packed RBCs (with anticoagulant) ~35–42 days depending on preservative; platelets ~5 days at room temperature; FFP frozen up to 1 year.
Practical principles for transfusion
1. Verify patient identity and indication.
2. Confirm blood group and cross-match.
3. Use compatible component (packed RBCs for anemia/bleeding, platelets for thrombocytopenia, FFP for clotting factor deficiencies).
4. Monitor during transfusion for signs of reaction.
Summary
Understanding ABO and Rh antigen–antibody relationships, accurate typing and cross-matching, and Rh prophylaxis are central to safe transfusion practice and prevention of neonatal hemolytic disease.
- Emergency trauma: A road-traffic accident patient with massive blood loss may be given O negative packed RBCs if there is no time for typing, because O− is least likely to cause an immediate hemolytic reaction.
- Rh incompatibility in pregnancy: An Rh− mother who delivered an Rh+ infant receives anti-D immunoglobulin within 72 hours to prevent sensitisation and protect future pregnancies (prevents erythroblastosis fetalis).
- Blood donation drive: A college blood donation camp screens donors for ABO and Rh groups; knowing local population frequencies (e.g., B and O common in India) helps manage inventory of components.
- Cross-match prevents reaction: A patient with prior transfusions develops antibodies to a rare RBC antigen; cross-matching detects incompatibility even when ABO/Rh appear compatible, preventing delayed hemolytic reaction.
- ABO genotype → phenotype mapping: I^A I^A or I^A i => A; I^B I^B or I^B i => B; I^A I^B => AB; ii => O.
- Simple Punnett probability: If one parent is I^A i and the other I^B i, genotype probabilities are: 1/4 I^A I^B (AB), 1/4 I^A i (A), 1/4 I^B i (B), 1/4 ii (O). Convert to percentage: P(AB) = (1/4)*100 = 25%.
- Rh inheritance probability (D dominant): If father is heterozygous Dd and mother is dd (Rh−), chance of Rh+ child = 1/2 = 50%.
- Percent formula for expected frequency: percent = (number of favorable outcomes / total outcomes) × 100.
Coagulation cascade and clotting
Definition: Coagulation (blood clotting) is a controlled cascade of enzymatic reactions that converts blood from a fluid to a gel (fibrin clot) to stop bleeding after vascular injury. Hemostasis has three sequential steps: vascular spasm, platelet plug formation, and coagulation (the coagulation cascade).
Steps of haemostasis
- Vascular spasm: Immediate vasoconstriction of the damaged vessel to reduce blood loss.
- Platelet plug formation: Platelets adhere to exposed collagen (via von Willebrand factor), become activated, release ADP and thromboxane A2, aggregate and form a temporary platelet plug.
- Coagulation (coagulation cascade): A series of proteolytic activations of clotting factors leading to formation of insoluble fibrin that stabilises the platelet plug.
Coagulation cascade overview
The cascade is traditionally divided into two pathways that converge into a common pathway:
- Intrinsic pathway (contact activation): activated when blood contacts negatively charged surfaces. Major factors involved: XII → XI → IX (with VIII as cofactor) → activation of factor X. Measured by activated partial thromboplastin time (aPTT).
- Extrinsic pathway (tissue factor pathway): initiated when tissue factor (TF, factor III) from damaged tissues binds factor VII, forming TF–VIIa complex that activates factor X. Measured by prothrombin time (PT) and INR.
- Common pathway: Factor X (with Va and Ca2+) forms prothrombinase which converts prothrombin (factor II) to thrombin (IIa). Thrombin converts fibrinogen (factor I) to fibrin (Ia) and activates factor XIII to XIIIa, which cross-links fibrin fibres to stabilise the clot.
Key molecules and roles
- Factor I: Fibrinogen → Fibrin (insoluble polymer)
- Factor II (Prothrombin) → Thrombin (active protease)
- Factor III: Tissue Factor (TF) — extrinsic trigger
- Factor IV: Ca2+ — essential cofactor in several steps
- Factors II, VII, IX, X — vitamin K dependent (synthesised in liver)
- Factor XIII: stabilises/cross-links fibrin
- vWF (von Willebrand factor): mediates platelet adhesion
- Plasmin (from plasminogen): digests fibrin (fibrinolysis) to remove the clot when repair is done
Clot retraction and fibrinolysis
After fibrin forms, platelets contract (actin–myosin) to pull the edges of the wound together (clot retraction). Later, tissue plasminogen activator (tPA) converts plasminogen to plasmin, which digests fibrin and dissolves the clot (fibrinolysis).
Regulation and clinical relevance
- Anticoagulant proteins (antithrombin III, protein C and S) limit clot growth.
- Vitamin K deficiency or liver disease reduces synthesis of several clotting factors and leads to bleeding tendency.
- Excessive clotting (thrombosis) can cause deep vein thrombosis, pulmonary embolism, myocardial infarction, or stroke. Anticoagulant drugs (heparin, warfarin, direct oral anticoagulants) alter parts of the cascade.
- Inherited disorders: Hemophilia A (factor VIII deficiency) and Hemophilia B (factor IX deficiency) cause prolonged bleeding.
Simple sequence (summary): Vessel injury → vasoconstriction → platelet adhesion/aggregation → activation of intrinsic/extrinsic pathways → factor X activation → prothrombin (II) to thrombin (IIa) → fibrinogen (I) to fibrin → fibrin stabilised by XIIIa → clot retraction → fibrinolysis.
- A small cut on the finger stops bleeding after a few minutes because platelets and the coagulation cascade form a clot.
- Hemophilia A (factor VIII deficiency) causes prolonged bleeding after injuries and spontaneous joint bleeds.
- Warfarin (a vitamin K antagonist) reduces synthesis of factors II, VII, IX and X — used to prevent thrombosis but increases bleeding risk.
- Deep vein thrombosis: a clot forms in a leg vein when blood flow is slow and coagulation is activated, potentially causing a pulmonary embolism.
- Prothrombin (II) --(prothrombinase complex: factor Xa + Va + Ca2+)--> Thrombin (IIa)
- Fibrinogen (I) --(Thrombin IIa)--> Fibrin (Ia) --(Factor XIIIa)--> Cross-linked fibrin clot
- INR = (PT_patient / PT_control) ^ ISI (ISI = international sensitivity index of thromboplastin)
- Normal ranges (typical): PT ≈ 11–13.5 s; aPTT ≈ 25–35 s; INR ≈ 0.8–1.2
Erythropoiesis and regulation
Definition: Erythropoiesis is the process of formation and development of red blood cells (erythrocytes) from pluripotent hematopoietic stem cells in the bone marrow.
Site: In adults, erythropoiesis occurs mainly in the red bone marrow of ribs, vertebrae, pelvis and proximal ends of long bones.
Stages of development:
- Pluripotent haematopoietic stem cell (haemocytoblast)
- Myeloid progenitor cell
- Proerythroblast (large, basophilic)
- Early erythroblast / basophilic erythroblast (intense ribosomal activity; Hb synthesis begins)
- Polychromatic erythroblast (mixed staining as Hb increases)
- Orthochromatic erythroblast (nucleus condensed)
- Normoblast (nucleus expelled) → Reticulocyte (immature RBC with residual ribosomal RNA)
- Mature erythrocyte (biconcave, anucleate, ~7–8 µm)
Key biochemical requirements: Iron (for heme), vitamin B12 and folic acid (DNA synthesis for precursor division), vitamin B6, copper, and vitamin C (enhances iron absorption). Hemoglobin synthesis occurs simultaneously with maturation.
Regulation (main mechanism): The primary regulator is erythropoietin (EPO), a glycoprotein hormone produced mainly by interstitial fibroblasts in the kidney (and small amounts in the liver). EPO secretion increases in response to tissue hypoxia (low O2 delivery) detected by oxygen-sensing cells in the kidney. EPO acts on erythroid progenitors in bone marrow to increase proliferation, accelerate maturation and enhance RBC release.
Feedback loop: Low arterial O2 → increased EPO → ↑ erythropoiesis → ↑ RBC mass & Hb → improved O2 delivery → decreased EPO (negative feedback).
Other modulators: Thyroid hormones, androgens (testosterone), growth hormone and corticosteroids can stimulate erythropoiesis. Chronic kidney disease reduces EPO → anaemia of chronic disease. Chronic hypoxia (e.g., high altitude, lung disease) elevates EPO and RBC count (polycythemia).
Lifespan and destruction: Mature RBCs live ≈120 days. Senescent RBCs are removed by macrophages in spleen, liver and bone marrow; hemoglobin is degraded and iron is recycled to marrow (transferrin carries iron in plasma). Bilirubin (from heme) is processed by the liver and excreted in bile.
Clinical correlations: Iron deficiency → microcytic hypochromic anemia. Vitamin B12/folate deficiency → macrocytic anemia. Aplastic anemia → failure of marrow. Polycythemia vera → uncontrolled RBC production. Blood doping/EPO abuse raises RBC mass and risk of thrombosis.
Normal reference values (approximate): RBC count: males 4.5–5.5 ×10^6/µL, females 4.0–5.0 ×10^6/µL. Hemoglobin: males 13–18 g/dL, females 12–16 g/dL. Hematocrit (PCV): males ~40–54%, females ~37–47% (ranges vary).
- High-altitude adaptation: At high altitude atmospheric O2 is low → kidney senses hypoxia → increased EPO → higher RBC count and hematocrit to improve oxygen delivery (seen in mountain dwellers).
- Iron-deficiency anemia: Insufficient dietary iron or blood loss reduces hemoglobin synthesis; bone marrow produces smaller, pale (microcytic hypochromic) RBCs.
- Chronic kidney disease: Damaged kidneys produce less EPO → decreased erythropoiesis → normocytic anemia; treated clinically with recombinant EPO.
- Athletic blood doping: Some athletes take recombinant EPO or blood transfusions to raise RBC mass and oxygen-carrying capacity — improves performance but increases risk of clotting and is banned in sport.
- Hematocrit (PCV) (%) = (Volume of RBCs / Total blood volume) × 100
- Mean Corpuscular Volume (MCV, fL) = (Hematocrit (%) × 10) / RBC count (millions/µL)
- Mean Corpuscular Hemoglobin (MCH, pg) = (Hemoglobin (g/dL) × 10) / RBC count (millions/µL)
- Mean Corpuscular Hemoglobin Concentration (MCHC, g/dL) = (Hemoglobin (g/dL) × 100) / Hematocrit (%)
Tissue Fluid and Lymph
Tissue Fluid and Lymph
Tissue fluid (also called interstitial fluid) is the fluid that surrounds body cells in tissues. It is formed from blood plasma when fluid leaks out of capillaries under the influence of hydrostatic and osmotic forces. Tissue fluid supplies cells with nutrients and oxygen and collects metabolic wastes.
Formation — the role of Starling forces
Fluid movement across capillary walls is governed by differences in hydrostatic and oncotic (colloid osmotic) pressures. Key pressures are:
- Capillary hydrostatic pressure (Pc): pushes fluid out of the capillary into interstitium.
- Interstitial hydrostatic pressure (Pi): pushes fluid into the capillary (usually small).
- Capillary oncotic (colloid osmotic) pressure (πc): produced mainly by plasma proteins (albumin); pulls water into capillary.
- Interstitial oncotic pressure (πi): pulls water out of capillary into interstitium (usually small).
Simple net filtration pressure (NFP) can be written as:
NFP = (Pc + πi) − (Pi + πc)
More generally (including membrane reflection coefficient σ and filtration coefficient K):
Volume flow = K × [(Pc − Pi) − σ(πc − πi)] (Starling equation)
Typical textbook values and what they mean
- Pc (arterial end) ≈ 35 mmHg; Pc (venous end) ≈ 16 mmHg
- πc (plasma oncotic) ≈ 25 mmHg
- Pi ≈ 0–1 mmHg; πi ≈ 3 mmHg
- Using the simple NFP formula: arterial end NFP ≈ (35+3) − (1+25) = +12 mmHg (net filtration outwards). Venous end NFP ≈ (16+3) − (1+25) = −7 mmHg (net reabsorption).
Lymph — formation and pathway
Not all fluid filtered at the arterial end is reabsorbed at the venous end. The excess interstitial fluid (about 3–4 L/day in adults) is collected by blind-ended lymphatic capillaries and becomes lymph. Lymph is similar to tissue fluid but contains lymphocytes and, from the intestine after a fatty meal, chyle (milky lymph rich in absorbed fats — chylomicrons).
Lymph flow pathway: lymphatic capillaries → larger lymphatic vessels (with valves) → lymph nodes (filtering, immune surveillance) → right lymphatic duct (drains right upper limb, right side of head/thorax) → thoracic duct (drains remainder of body) → drains into respective subclavian veins.
Functions of tissue fluid and lymph
- Provide medium for exchange of gases, nutrients and wastes between blood and cells.
- Return excess fluid and plasma proteins to the bloodstream (maintains blood volume).
- Transport fats absorbed from intestine (as chyle) into circulation.
- Immune function: lymph carries antigen-presenting cells and lymphocytes to lymph nodes for immune responses.
Clinical correlations
- Edema — accumulation of excess tissue fluid, caused by increased Pc (e.g., heart failure), decreased πc (hypoproteinemia from malnutrition or liver disease), increased capillary permeability (inflammation), or lymphatic obstruction (surgical removal of nodes, parasitic infection).
- Lymphedema — localized swelling due to lymphatic blockage (e.g., filariasis/elephantiasis or post-mastectomy node removal).
Summary
Tissue fluid is produced by filtration of plasma at the capillary arterial end (driven by hydrostatic pressure) and mostly reabsorbed at the venous end (driven by plasma oncotic pressure). Excess fluid is returned to the blood as lymph via the lymphatic system, which also functions in fat transport and immunity. The balance of Starling forces determines net filtration or absorption; disturbance of these forces or lymph flow leads to edema.
- Swelling after a mosquito bite: local inflammation increases capillary permeability so more plasma proteins and fluid leak into tissue, causing edema and redness.
- Pitting edema in heart failure: reduced cardiac output raises venous pressure, increasing capillary hydrostatic pressure (Pc) and causing generalized fluid accumulation in tissues (ankles, legs).
- Elephantiasis (filariasis): obstruction of lymphatic vessels by parasites (Wuchereria bancrofti) causes severe lymphedema of limbs.
- Chyle in the lacteals after a fatty meal: absorbed dietary fats are transported as milky lymph (chyle) via intestinal lymphatics into the thoracic duct and then blood.
- Simple net filtration pressure (NFP): NFP = (Pc + πi) − (Pi + πc)
- Starling (general) equation: Fluid flow = K × [(Pc − Pi) − σ(πc − πi)] (K = filtration coefficient, σ = reflection coefficient)
- Example numeric estimate: arterial end NFP ≈ (35 + 3) − (1 + 25) = +12 mmHg (net filtration); venous end NFP ≈ (16 + 3) − (1 + 25) = −7 mmHg (net reabsorption).
Blood groups and transfusion
Overview
Blood groups are classifications of blood based on the presence or absence of specific antigens on the surface of red blood cells (RBCs). The two clinically most important systems are the ABO system and the Rh (Rhesus) system. Matching donor and recipient blood groups correctly is essential to avoid immune reactions during transfusion.
1. ABO blood group system
- Antigens: A and B antigens are carbohydrate markers on RBC membranes.
- Antibodies: Individuals produce naturally occurring antibodies in plasma against the A or B antigen they do not have: anti-A and/or anti-B (IgM).
- Groups and antigen/antibody profile:
- Group A: A antigen on RBCs; anti-B antibodies in plasma.
- Group B: B antigen on RBCs; anti-A antibodies in plasma.
- Group AB: Both A and B antigens; no anti-A or anti-B antibodies (hence AB is universal plasma donor and universal recipient of RBCs).
- Group O: No A/B antigens on RBCs; both anti-A and anti-B antibodies in plasma (O is universal RBC donor in emergencies).
Genetics (basic)
The ABO gene has three common alleles: I(A), I(B) and i. Genotypes:
- Type A: I(A)I(A) or I(A)i
- Type B: I(B)I(B) or I(B)i
- Type AB: I(A)I(B)
- Type O: ii
2. Rh system (D antigen)
- The most important Rh antigen is the D antigen. Presence = Rh positive (Rh+); absence = Rh negative (Rh-).
- Rh+ is dominant over Rh- genetically.
- Unlike ABO antibodies, anti-D (anti-Rh) antibodies are usually produced only after exposure to Rh+ blood (e.g., transfusion or pregnancy).
3. Compatibility and clinical rules
- Transfusion reactions occur if recipient antibodies attack donor RBC antigens (acute hemolytic reaction).
- Basic compatibility (RBC transfusion):
- O negative (O-) donors: generally considered universal RBC donors (no A/B/D antigens).
- AB positive (AB+): universal RBC recipients (they have no anti-A/anti-B and are Rh+).
- For plasma transfusion the antibody side matters: AB plasma is 'universal plasma donor' because it lacks anti-A and anti-B antibodies; O plasma contains both anti-A and anti-B and is therefore risky for many recipients.
4. Blood grouping and cross-matching
Routine tests before transfusion:
- Blood typing: determines ABO and Rh type (using known anti-A, anti-B, anti-D sera and observing agglutination).
- Cross-match: mixing donor RBCs with recipient serum to check for agglutination — the final safety check to detect unexpected antibodies.
5. Hemolytic disease of the newborn (erythroblastosis fetalis)
If an Rh- mother carries an Rh+ fetus, fetal RBCs entering maternal circulation during delivery or trauma can sensitize the mother, who then makes anti-D IgG. In subsequent Rh+ pregnancies maternal IgG can cross the placenta and destroy fetal RBCs, causing anemia, jaundice, hydrops fetalis or fetal death. Prevention: give anti-D immunoglobulin (Rho(D) immune globulin) to Rh- mothers after delivery of an Rh+ baby or after sensitizing events.
6. Components and modern transfusion practice
Whole blood is rarely transfused; instead components are used:
- Packed red blood cells (PRBCs) — for anemia/bleeding.
- Platelets — for thrombocytopenia or platelet dysfunction.
- Fresh frozen plasma (FFP) — for clotting factor deficiencies.
- Cryoprecipitate — for fibrinogen, factor VIII concentrates.
7. Transfusion reactions and management
Types: acute hemolytic (life-threatening), febrile non-hemolytic, allergic, transfusion-related acute lung injury (TRALI), delayed hemolytic, transfusion-associated circulatory overload (TACO). If reaction suspected: stop transfusion immediately, maintain IV access with saline, notify blood bank and follow institutional protocol.
Quick summary
ABO and Rh determine compatibility. Always perform typing + cross-match. O- for emergency RBCs; AB plasma can be given widely. Prevent Rh sensitization to avoid hemolytic disease of newborn.
- Emergency road-traffic accident: A patient arrives unconscious and needs immediate blood. If there is no time for typing, O-negative packed RBCs (universal donor) are given to minimize risk.
- A pregnant Rh-negative mother gives birth to an Rh-positive baby. To prevent sensitization that could affect future pregnancies, the mother is given anti-D immunoglobulin (RhoGAM) after delivery.
- Before elective surgery, a patient’s blood is typed as B positive and cross-matched with donor B+ units. If cross-match shows no agglutination, PRBCs are transfused during surgery to replace lost blood safely.
- Population screening: A blood bank analyses donors and finds frequency of blood groups in that region (e.g., 40% O, 30% B, 20% A, 10% AB) to plan inventory of different blood types.
- Estimated blood volume (adult) ≈ body weight (kg) × 70 mL/kg (approximate; males ~70 mL/kg, females ~65 mL/kg)
- Hematocrit (PCV %) = (Volume of RBCs / Total blood volume) × 100
- Mean corpuscular volume (MCV, fL) = (Hematocrit (%) × 10) / RBC count (million/µL)
- Mean corpuscular hemoglobin (MCH, pg) = (Hemoglobin (g/dL) × 10) / RBC count (million/µL)
- Mean corpuscular hemoglobin concentration (MCHC, g/dL) = (Hemoglobin (g/dL) / Hematocrit (%)) × 100
Lymphatic System
Lymphatic System
The lymphatic system is a blind-ended, low-pressure network of vessels and organs that collects excess tissue fluid (lymph), returns it to the blood circulation, absorbs fats from the intestine, and participates in immune defence. It works alongside the cardiovascular system to maintain fluid balance and to provide immune surveillance.
Major components
- Lymph: A clear or slightly yellow fluid composed of tissue fluid, proteins, lipids (from intestines), and immune cells (mainly lymphocytes).
- Lymphatic capillaries: Extremely permeable blind-ended capillaries in tissues that collect interstitial fluid. They have overlapping endothelial cells that act as one-way valves.
- Lymphatic vessels: Possess valves to prevent backflow and transport lymph toward larger lymph nodes and trunks. Larger vessels have thin smooth muscle in their walls.
- Lymph nodes: Small, bean-shaped filters located along vessels that trap pathogens and contain immune cells that mount responses. Sites of lymphocyte activation and proliferation.
- Trunks and ducts: Major channels that drain lymph into the venous system. Key ducts are the thoracic duct (drains most of the body into left subclavian vein) and the right lymphatic duct (drains right upper quadrant into right subclavian vein).
- Lymphoid organs/tissues: Thymus (T cell maturation), spleen (filters blood, immune responses to blood-borne antigens, removes old RBCs), tonsils, Peyer’s patches, bone marrow.
How lymph is formed
Lymph formation begins as tissue fluid produced by capillary filtration. The balance of hydrostatic and oncotic pressures across capillary walls (Starling forces) determines net filtration. At the arterial end of systemic capillaries there is net filtration into interstitium; at the venous end there is partial reabsorption. The small remainder of filtered fluid (about 2–4 litres per day in humans) is taken up by lymphatic capillaries and returned to the blood.
Mechanisms of lymph transport
- Skeletal muscle contraction compresses lymphatic vessels and propels lymph (one-way valves prevent backflow)
- Respiratory movements create pressure changes that aid flow
- Intrinsic rhythmic contractions of smooth muscle in larger lymphatics
- Arterial pulsations near lymphatics can help move lymph
Functions
- Return of excess interstitial fluid and plasma proteins to the bloodstream (prevents tissue swelling)
- Transport of absorbed fats and fat-soluble vitamins from the intestine via lacteals (chyle)
- Immune surveillance and response: lymph nodes filter pathogens, antigen presentation and lymphocyte activation occur here
- Removal of cellular debris and cancer cells from tissues
Clinical correlations (brief)
- Lymphedema: accumulation of lymph and swelling when lymph drainage is compromised (e.g., after removal of axillary lymph nodes in mastectomy, or congenital causes)
- Filariasis (elephantiasis): parasitic blockage of lymphatics causes severe swelling
- Swollen, tender lymph nodes (lymphadenitis) indicate local infection; enlarged non-tender nodes may suggest malignancy
- Splenomegaly: enlarged spleen in infections like malaria or haematologic diseases
Summary
The lymphatic system is essential for fluid balance, fat transport from the gut, and immune defence. Its low-pressure, valved network returns filtered fluid and proteins to the blood, filters pathogens through lymph nodes, and helps coordinate adaptive immune responses.
- After eating a fatty meal, chylomicrons are absorbed by intestinal lacteals; lymph (chyle) in the lacteals carries absorbed fats into the thoracic duct and then into the bloodstream.
- Following removal of axillary lymph nodes during breast cancer surgery, patients may develop lymphedema of the arm due to impaired lymph drainage.
- Swollen, painful cervical lymph nodes often occur with a throat infection (tonsillitis); this is lymph nodes responding and proliferating immune cells.
- Elephantiasis in filariasis: parasitic worms (Wuchereria bancrofti) block lymph vessels causing extreme swelling of legs or genitalia.
- Simplified Starling balance (net filtration): Net filtration = (Capillary hydrostatic pressure + Interstitial oncotic pressure) - (Interstitial hydrostatic pressure + Capillary oncotic pressure)
- Full Starling equation: Net fluid flow = Kf [ (Pc - Pi) - sigma (πc - πi) ] where Pc = capillary hydrostatic pressure, Pi = interstitial hydrostatic pressure, πc = capillary oncotic (colloid osmotic) pressure, πi = interstitial oncotic pressure, Kf = filtration coefficient, sigma = reflection coefficient.
- Typical daily fluid volumes (approximate): Plasma filtered across capillaries ≈ 20 L/day; reabsorbed ≈ 17 L/day; lymph returned to circulation ≈ 2–4 L/day.
Blood disorders
Overview
Blood disorders are conditions that affect the cellular components (RBCs, WBCs, platelets) or plasma constituents of blood, altering its functions — oxygen transport, immunity and clotting. In Class 11 context the most important disorders are those of red cells (anemias, polycythemia, sickle cell, thalassemia), white cells (leukaemia) and platelets/clotting (haemophilia, thrombocytopenia).
Common disorders — causes, pathology and key features
- Anemia — reduced haemoglobin (Hb) concentration or RBC number/volume causing decreased O2 delivery. Causes: iron deficiency (most common), folate/B12 deficiency (megaloblastic), haemolysis (autoimmune, hereditary spherocytosis), aplastic (bone marrow failure). Symptoms: fatigue, pallor, breathlessness, tachycardia. Diagnosis: CBC, peripheral smear, reticulocyte count, iron studies, B12/folate levels.
- Sickle cell anaemia — genetic mutation in β‑globin (Glu→Val) produces HbS. Under low O2 RBCs sickle, causing vaso‑occlusion, hemolysis, painful crises and organ damage. Inherited autosomal codominant; common in malaria‑endemic regions.
- Thalassemia — decreased synthesis of α or β globin chains. Severity ranges from trait (mild) to major (severe transfusion‑dependent anaemia). Expansion of marrow, bone deformities and iron overload from transfusions are characteristic.
- Polycythemia (erythrocytosis) — increased RBC mass (primary: bone marrow disorder; secondary: high altitude, chronic hypoxia). Results in hyperviscosity, headache, hypertension and risk of thrombosis.
- Leukaemia — malignant proliferation of white blood cell precursors in bone marrow (acute — rapid onset, immature blasts; chronic — more indolent). Presents with anaemia, recurrent infections, bleeding and bone pain. Diagnosed by CBC, peripheral smear and bone marrow biopsy.
- Haemophilia — X‑linked deficiency of clotting factor VIII (haemophilia A) or IX (haemophilia B) causing prolonged bleeding, hemarthroses. Mainly affects males; managed by replacement therapy with the deficient factor.
- Thrombocytopenia — low platelet count leading to easy bruising, petechiae, prolonged bleeding. Causes include immune destruction, bone marrow failure, certain drugs.
Pathophysiological consequences
Anemias reduce O2 delivery → tissue hypoxia (fatigue, pallor, tachycardia). Haemolytic anemias increase bilirubin (jaundice) and raise reticulocyte count. Polycythemia increases blood viscosity → sluggish flow, risk of thrombosis. Coagulation disorders impair haemostasis causing excessive bleeding.
Diagnosis — typical tests
- Complete blood count (CBC): Hb, RBC count, WBC count, platelet count, hematocrit (PCV)
- Peripheral blood smear (cell morphology: micro/macrocytic RBCs, sickled cells, blasts)
- MCV, MCH, MCHC indices (help classify anemias)
- Special tests: iron studies, B12/folate levels, haemoglobin electrophoresis (sickle cell, thalassemia), bone marrow biopsy, coagulation tests (bleeding time, clotting time, PT, aPTT)
Treatment and prevention (brief)
Treat underlying cause: iron/folate/B12 supplements for deficiency anaemias; transfusions and iron chelation for thalassemia major; hydroxyurea and supportive care for sickle cell; factor replacement for haemophilia; chemotherapy/bone marrow transplant for leukaemia. Preventive measures include balanced diet, antenatal screening/genetic counselling (thalassemia, sickle cell), vaccination and avoidance of precipitating drugs.
Clinical significance & real-life impact
Blood disorders affect growth, learning and productivity (e.g., iron deficiency anaemia in adolescent girls causing poor school performance). Genetic disorders like thalassemia and sickle cell affect families and require long‑term management; haemophilia influences sports/activities and needs planned care for surgery/injuries.
- Iron deficiency anemia in adolescent girls due to poor diet and heavy menstrual bleeding — presents with pallor, fatigue; treated with oral iron supplements and dietary changes.
- Sickle cell disease in a child from a malaria‑endemic region — recurrent painful crises and infections; managed with hydration, pain control, hydroxyurea and prophylactic antibiotics/vaccinations.
- Thalassemia major — child with severe anemia, bone deformities and growth retardation requiring repeated transfusions and iron chelation; definitive cure possible by bone marrow transplant.
- Haemophilia A — a boy with prolonged bleeding after circumcision and recurrent joint bleeds; treated with factor VIII replacement and preventive care.
- Acute lymphoblastic leukaemia (ALL) in a child presenting with fever, bone pain, bruising and high blast count on peripheral smear; treated with chemotherapy and sometimes bone marrow transplant.
- Hemoglobin (Hb) — measured directly in g/dL (normal: males ≈ 13–17 g/dL, females ≈ 12–15 g/dL).
- Packed Cell Volume (PCV) or Hematocrit (%) = (Volume of RBCs / Total blood volume) × 100.
- Mean Corpuscular Volume (MCV, fL) = (Hematocrit (%) × 10) / RBC count (million/µL).
- Mean Corpuscular Hemoglobin (MCH, pg) = (Hemoglobin (g/dL) × 10) / RBC count (million/µL).
- Mean Corpuscular Hemoglobin Concentration (MCHC, g/dL) = (Hemoglobin (g/dL) / Hematocrit (%)) × 100.
- RBC count units: ×10^6/µL; Platelet count normal ≈ 150,000–450,000/µL.
Structure of the Heart
Overview
The heart is a muscular pump that propels blood through the circulatory system. Located in the thoracic cavity between the lungs (mediastinum), it is about the size of a fist and roughly weighs 200–300 g in adults. The heart is covered by a double-walled sac called the pericardium.
External features
- Apex: pointed tip directed downwards, forwards and to the left.
- Base: broad upper surface where great vessels emerge.
- Auricles: small ear-like flaps of the atria that increase atrial volume.
- Grooves (sulci): coronary (atrioventricular) sulcus and anterior/posterior interventricular sulci house coronary vessels and mark chamber boundaries.
Internal structure (chambers and septa)
- The heart has four chambers: two atria (upper, receiving chambers) and two ventricles (lower, pumping chambers).
- Atrial septum separates right and left atria; ventricular septum separates right and left ventricles.
- Right side handles pulmonary (lung) circulation; left side handles systemic circulation. Left ventricular wall is much thicker because it pumps blood at higher pressure to the whole body.
Valves and one-way flow
- Atrioventricular (AV) valves: between atria and ventricles — tricuspid (right) and bicuspid/mitral (left). Chordae tendineae and papillary muscles prevent valve prolapse during ventricular contraction.
- Semilunar valves: pulmonary valve (right ventricle → pulmonary trunk) and aortic valve (left ventricle → aorta). These prevent backflow into ventricles after ejection.
- Valves ensure unidirectional blood flow: veins → atria → ventricles → arteries.
Heart wall layers
- Epicardium: outer visceral layer of pericardium.
- Myocardium: thick middle cardiac muscle layer responsible for contraction (greatest in left ventricle).
- Endocardium: inner endothelial lining continuous with blood vessel endothelium.
Conduction system (coordinated contraction)
- Sinoatrial (SA) node: pacemaker located in right atrium; initiates impulses (~60–100 bpm in resting adults).
- Atrioventricular (AV) node: receives atrial impulse and delays it briefly to allow ventricular filling.
- Bundle of His → bundle branches → Purkinje fibres: rapidly conduct impulse through ventricles for synchronized contraction.
- This electrical activity is recorded as ECG (P wave: atrial depolarization; QRS: ventricular depolarization; T: ventricular repolarization).
Coronary circulation
Coronary arteries (right and left) branch from the ascending aorta to supply myocardium. Major branches include the left anterior descending (LAD) artery and circumflex artery. Blockage of these arteries causes myocardial ischemia/infarction (heart attack).
Fetal structures (brief)
Fetal shunts — foramen ovale (between atria) and ductus arteriosus (between pulmonary trunk and aorta) — bypass the nonfunctional fetal lungs. These normally close after birth.
Clinical relevance
- Myocardial infarction (blockage of coronary artery) damages myocardium and reduces pump function.
- Valve defects (stenosis or regurgitation) alter flow and cause murmurs; severe defects may need repair or replacement.
- Hypertension increases afterload, leading to left ventricular hypertrophy (thickening of wall).
Summary flow of blood through heart
Deoxygenated blood: body → superior/inferior vena cava → right atrium → (tricuspid) → right ventricle → (pulmonary valve) → pulmonary trunk → lungs. Oxygenated blood: lungs → pulmonary veins → left atrium → (mitral valve) → left ventricle → (aortic valve) → aorta → body.
- Myocardial infarction: blockage of a coronary artery (e.g., LAD) causes death of myocardial tissue supplied by it — illustrates importance of coronary circulation.
- Valve regurgitation: a leaky mitral valve causes blood to flow back into left atrium during ventricular contraction — produces a systolic murmur and can lead to atrial enlargement.
- Athlete's heart: regular endurance training causes physiological left ventricular hypertrophy (increased wall thickness and chamber size) to increase stroke volume.
- Newborn transition: closure of the foramen ovale and ductus arteriosus after birth redirects blood to the lungs — demonstrates fetal shunts linked to structure.
- Cardiac Output (CO) = Stroke Volume (SV) × Heart Rate (HR). Typical resting CO ≈ 5 L/min (SV ≈ 70 mL × HR ≈ 70 bpm).
- Stroke Volume (SV) = End-Diastolic Volume (EDV) − End-Systolic Volume (ESV).
- Mean Arterial Pressure (MAP) ≈ Diastolic Pressure + 1/3(Systolic − Diastolic).
- Ohm's law for circulation: Flow (Q) = ΔP / R (where ΔP is pressure difference and R is resistance).
- Cardiac Index = CO / Body Surface Area (BSA) — normal ≈ 2.5–4.0 L·min⁻¹·m⁻².
Cardiac Cycle
Definition: The cardiac cycle is the sequence of electrical and mechanical events that occur from the start of one heartbeat to the start of the next. It includes phases of contraction (systole) and relaxation/filling (diastole) of the atria and ventricles.
Overview and timing (typical resting heart rate ~75 bpm):
- Duration of one cycle ≈ 0.8 s (75 beats/min). Total = atrial systole + ventricular systole + complete diastole.
- Atrial systole ≈ 0.1 s (helps top-up ventricular filling).
- Ventricular systole ≈ 0.3 s (isovolumetric contraction + ejection).
- Ventricular diastole ≈ 0.4 s (isovolumetric relaxation + passive filling).
Phases in detail:
- Atrial systole: Following the P wave on ECG (atrial depolarisation), atria contract, giving final filling of ventricles (the atrial "kick"). A-V valves (mitral & tricuspid) are open; semilunar valves closed.
- Isovolumetric ventricular contraction: Ventricles begin to contract after the QRS complex (ventricular depolarisation). All valves are closed briefly, so ventricular pressure rises sharply while volume remains constant. When ventricular pressure exceeds arterial pressure, semilunar valves open.
- Ventricular ejection: Blood is ejected into aorta and pulmonary artery. Ventricular volume falls from end-diastolic volume (EDV) toward end-systolic volume (ESV). Aortic pressure rises to systolic levels (approx. 120 mmHg in left ventricle/aorta).
- Isovolumetric relaxation: After the T wave (ventricular repolarisation), ventricles relax. Semilunar valves close (second heart sound S2), all valves closed briefly and ventricular pressure falls with no change in volume.
- Ventricular filling (rapid filling + diastasis): When ventricular pressure falls below atrial pressure, AV valves open. Rapid passive filling occurs, followed by slow filling (diastasis). Cycle repeats.
Valves and heart sounds: Closing of AV valves (mitral & tricuspid) produces the first heart sound (S1) at the start of ventricular systole. Closing of semilunar valves (aortic & pulmonary) produces S2 at the start of ventricular diastole. Occasional S3/S4 may be heard in specific conditions.
Relation to ECG: P wave = atrial depolarisation and precedes atrial systole. QRS = ventricular depolarisation and precedes ventricular contraction. T wave = ventricular repolarisation and corresponds to ventricular relaxation.
Important volumes and pressures (approximate normal values):
- End-diastolic volume (EDV) ≈ 110–130 ml
- End-systolic volume (ESV) ≈ 40–60 ml
- Stroke volume (SV = EDV − ESV) ≈ 60–80 ml
- Cardiac output (CO = HR × SV) ≈ 4.5–6.0 L/min at rest
- Left ventricular systolic pressure ≈ 120 mmHg; diastolic pressure ≈ 5–12 mmHg; aortic diastolic ≈ 80 mmHg (typical)
Special features seen on pressure traces: Atrial pressure shows small waves labelled a, c and v: 'a' from atrial contraction, 'c' from ventricular contraction bulging the AV valve, and 'v' from venous filling of the atrium during ventricular systole.
Clinical relevance: Changes in heart rate, valve disorders (regurgitation/stenosis), myocardial infarction and heart failure alter the timing, volumes and pressures observed during the cardiac cycle. Understanding the cycle is essential for interpreting ECG, heart sounds, blood pressure and echocardiography findings.
- During exercise: heart rate (HR) increases and stroke volume often increases, so cardiac output (CO = HR × SV) rises from about 5 L/min at rest to 15–20 L/min or more in trained individuals.
- A patient with mitral regurgitation: during ventricular systole some blood flows back into the left atrium, altering filling volumes and producing a characteristic murmur during systole.
- Measuring pulse and blood pressure: systolic BP approximates peak aortic pressure during ventricular ejection; diastolic BP approximates aortic pressure during ventricular diastole.
- Fainting (syncope) can result from an abrupt fall in cardiac output — e.g., too slow HR or poor ventricular filling — causing insufficient cerebral perfusion.
- Stroke Volume (SV) = End-Diastolic Volume (EDV) − End-Systolic Volume (ESV)
- Cardiac Output (CO) = Heart Rate (HR) × Stroke Volume (SV)
- Ejection Fraction (EF) = (SV / EDV) × 100% (normal ≈ 55–70%)
- Mean Arterial Pressure (approx) MAP ≈ Diastolic BP + 1/3 (Systolic BP − Diastolic BP)
Lymph and lymphatic system
Introduction: Lymph is a clear to slightly milky fluid derived from interstitial fluid that bathes body tissues. The lymphatic system is a unidirectional network of blind-ended capillaries, vessels with valves, lymph nodes, trunks and ducts that collects this fluid and returns it to the blood circulation while participating in fat absorption and immune defence.
Composition of lymph
- Water and dissolved solutes (electrolytes).
- Proteins: lower concentration than plasma but higher than interstitial fluid; contains immunoglobulins produced in nodes.
- Cells: mainly lymphocytes (T‑ and B‑cells) and occasional macrophages.
- Fats: after a fatty meal, lymph from intestinal lacteals becomes milky (chyle) because of chylomicrons.
Formation of lymph
Lymph forms when plasma leaks out of blood capillaries into interstitial spaces. Most of this fluid is reabsorbed at venous ends of capillaries; the excess (~2–4 L/day in a healthy adult) enters lymphatic capillaries. The movement of fluid across capillaries is governed by hydrostatic and oncotic pressure differences (Starling forces).
Structure of the lymphatic system
- Lymphatic capillaries: blind-ended, highly permeable (overlapping endothelial cells act as one-way valves).
- Lymphatic vessels: have valves and smooth muscle in larger vessels; arranged in superficial and deep plexuses.
- Lymph nodes: encapsulated structures placed along vessels; filtering stations where immune responses are mounted.
- Lymphatic trunks and ducts: major trunks drain regions and converge into thoracic duct (drains most of body) and right lymphatic duct (drains right upper quadrant), which empty into subclavian veins.
- Lacteals: specialized lymphatic capillaries in intestinal villi for absorption of dietary fats.
Mechanisms of lymph transport
- Intrinsic pumping: rhythmic contractions of smooth muscle in larger lymphatic vessels.
- Extrinsic pumping: skeletal muscle contractions, arterial pulsations, respiratory movements and tissue compression push lymph forward; valves prevent backflow.
- Net flow depends on interstitial fluid formation rate and the above pumps.
Functions
- Return of excess interstitial fluid and proteins to the blood, maintaining fluid balance.
- Transport of absorbed fats (as chyle) from the intestine to the blood.
- Immune surveillance: lymph nodes filter pathogens and activate lymphocytes; transport of antigen-presenting cells.
- Pathway for metastasis: tumour cells can spread via lymphatics to regional nodes.
Clinical relevance
- Lymphedema: swelling due to impaired lymph drainage (e.g., post-surgical removal of nodes, trauma).
- Filariasis (elephantiasis): parasitic blockage of lymphatics causing massive edema.
- Enlarged (tender) lymph nodes during infection; firm, non-tender nodes may suggest malignancy.
- Sentinel lymph node biopsy: used to assess metastasis in cancers like breast cancer and melanoma.
Summary: The lymphatic system complements the circulatory system by returning fluid and proteins to the blood, transporting absorbed fats, and providing a major route for immune cells to detect and respond to pathogens. Proper function depends on capillary permeability, valves, muscular activity and lymph node filtering.
- After a fatty meal, intestinal lacteals absorb chylomicrons and lymph becomes milky (chyle) — you can observe a rise in lymphatic flow supplying blood lipids.
- Elephantiasis (filariasis) caused by Wuchereria bancrofti: parasites block lymphatic vessels leading to chronic swelling of limbs.
- Mastectomy with axillary lymph node removal can cause lymphedema in the arm due to interrupted lymph drainage.
- During a throat infection, cervical lymph nodes become tender and swollen as they filter pathogens and activate immune cells.
- Cancer metastasis often follows lymphatic routes — sentinel node biopsy identifies first draining node for staging.
- Poiseuille's law (flow in a vessel): Q = (π r^4 ΔP) / (8 η l) — lymph flow in a vessel increases strongly with radius (r4 dependence), ΔP = pressure difference, η = fluid viscosity, l = vessel length.
- Ohm-like relationship for flow: Q = ΔP / R — flow (Q) is pressure difference divided by resistance (useful as a conceptual formula for lymphatic flow).
- Simplified Starling forces (net filtration tendency): Net filtration ≈ (Pc − Pi) − (πc − πi) where Pc = capillary hydrostatic pressure, Pi = interstitial hydrostatic pressure, πc = capillary oncotic (colloid) pressure, πi = interstitial oncotic pressure.
- Van't Hoff law for osmotic pressure (useful for oncotic pressure concepts): π = i M R T (π = osmotic pressure, M = molar concentration, R = gas constant, T = temperature, i = van't Hoff factor).
Heart Sounds and Electrocardiogram (ECG)
Overview
Heart sounds and the electrocardiogram (ECG) are complementary ways to study cardiac function. Heart sounds are audible events produced by valve closures and blood flow; ECG records the heart's electrical activity and helps time mechanical events.
Heart sounds
There are two normal heart sounds: S1 ('lub') and S2 ('dub'). S1 is produced by closure of the atrioventricular (AV) valves (mitral and tricuspid) at the start of ventricular systole. S2 is produced by closure of the semilunar valves (aortic and pulmonary) at the start of ventricular diastole. Extra sounds: S3 (early diastolic, from rapid ventricular filling—may be normal in children but pathological in adults with volume overload/heart failure) and S4 (late diastolic atrial contraction sound—seen in stiff ventricles, e.g., LV hypertrophy).
Murmurs
Murmurs are due to turbulent blood flow from valve stenosis or regurgitation, septal defects, or high flow states. Timing classifies murmurs as systolic (between S1 and S2), diastolic (between S2 and next S1), or continuous (e.g., patent ductus arteriosus).
ECG basics
An ECG records summed electrical potentials from the heart, typically shown as waves and intervals: P wave (atrial depolarization), PR interval (time from atrial depolarization to start of ventricular depolarization — includes AV nodal delay), QRS complex (ventricular depolarization), ST segment (early ventricular repolarization/plateau), and T wave (ventricular repolarization). Sometimes a U wave follows T.
Relation between sounds and ECG
Electrical events precede mechanical events: atrial contraction (seen as the P wave) precedes ventricular filling; S1 occurs just after the QRS complex (onset of ventricular systole) when AV valves close; S2 occurs near the end of the T wave/start of diastole when semilunar valves close. Thus, ECG timing helps interpret heart sounds and murmurs.
Clinical importance
Auscultation (stethoscope) and phonocardiography detect abnormal sounds and murmurs. ECG is essential for diagnosing arrhythmias (e.g., atrial fibrillation: absent P waves and irregular RR intervals), myocardial ischaemia/infarction (ST-segment elevation/depression, pathological Q waves), conduction blocks (prolonged PR interval in AV block), and rate assessment. Continuous ECG monitoring (Holter) detects intermittent rhythm problems. Stress ECGs assess exercise-induced ischemia.
Normal reference values (typical)
P wave duration < 0.12 s; PR interval 0.12–0.20 s; QRS duration < 0.12 s; QT interval ≈ 0.35–0.44 s (varies with HR). Heart sounds: S1 and S2 are the primary normal sounds; S3/S4 are usually abnormal in adults.
- Primary-care checkup: Doctor uses a stethoscope to hear 'lub-dub'; a loud systolic murmur heard at the apex suggests mitral regurgitation and prompts echocardiography.
- Emergency: Patient with chest pain and ST-elevation in leads V1–V4 on ECG — indicates anterior wall myocardial infarction; rapid reperfusion therapy is required.
- Arrhythmia detection: A Holter monitor records intermittent palpitations; ECG shows atrial fibrillation (irregularly irregular rhythm, absent P waves), guiding anticoagulation and rate-control therapy.
- Exercise ECG (stress test): ECG recorded during treadmill exercise shows ST-segment depression at peak exertion, suggesting coronary artery disease and need for further evaluation.
- Heart rate (bpm) = 60 / (RR interval in seconds)
- Common ECG quick rules for heart rate: HR ≈ 300 / (number of large boxes between consecutive R waves) or HR ≈ 1500 / (number of small boxes between R waves) (standard paper speed 25 mm/s)
- Cardiac output (CO) = Heart rate (HR) × Stroke volume (SV) (CO in L/min when SV in L and HR in beats/min)
Types of circulatory systems
Overview
The circulatory system moves fluids (blood/hemolymph) that transport gases, nutrients, wastes and signalling molecules. Based on whether the circulating fluid is confined to vessels, circulatory systems are broadly classified into open and closed systems. Closed systems are further classified into single and double circulation. Specialised portal systems also occur where blood flows through two consecutive capillary beds.
1. Open circulatory system
- Definition: Blood (hemolymph) is not entirely confined to vessels; it bathes organs directly in a body cavity (haemocoel).
- Components: Simple heart(s) or pulsatile vessels, ostia (in some arthropods), sinuses or haemocoel.
- Flow pattern: Heart pumps hemolymph into sinuses; exchange occurs between hemolymph and tissues; hemolymph returns to heart through ostia or by diffusion.
- Advantages: Low energy cost, tolerates variable volume; suitable for small or less active animals.
- Disadvantages: Lower pressure and slower flow; less efficient transport; cannot support high metabolic rates.
Examples
Most arthropods (insects, crustaceans) and many molluscs (except cephalopods) have open systems.
2. Closed circulatory system
- Definition: Blood is confined to vessels and circulates in a continuous, closed loop driven by a heart.
- Components: Heart, arteries, arterioles, capillaries, venules, veins. Exchange between blood and tissues occurs across capillary walls.
- Advantages: Higher blood pressure, faster and more directed flow, efficient transport of gases and nutrients — supports higher metabolic activity.
- Disadvantages: More energetically expensive to build and maintain.
Subtypes of closed systems
a) Single circulation
Blood passes through the heart once during each complete circuit of the body. The heart pumps deoxygenated blood to the gills (or respiratory surface) where it gets oxygenated, then it flows directly to the body and back to the heart.
Example: Fishes (teleosts). Structure: two-chambered heart (one atrium, one ventricle). Advantage: simple design; Limitation: blood pressure falls after gill capillaries, so systemic perfusion is at lower pressure.
b) Double circulation
Blood passes through the heart twice during each circuit: once in the pulmonary (or respiratory) circuit and once in the systemic circuit. This allows separation of oxygenated and deoxygenated blood and maintenance of higher systemic blood pressure.
- Partial (incomplete) double circulation: Amphibians and most reptiles — a three-chambered heart (two atria, one partly divided ventricle) with some mixing of blood. In reptiles (except crocodilians) an incomplete ventricular septum may reduce mixing.
- Complete double circulation: Birds and mammals — a four-chambered heart (two atria, two ventricles) fully separates pulmonary and systemic circuits, preventing mixing and allowing high metabolic rates.
- Crocodilians: Have a four-chambered heart but possess special shunts (e.g., foramen of Panizza) that allow controlled mixing during diving.
3. Portal systems (specialised closed circuits)
In portal systems blood flows through two capillary beds arranged in series before returning to the heart. This allows substances absorbed in one region to be delivered directly to another region at relatively high concentrations.
- Hepatic portal system: Blood from gastrointestinal tract capillaries passes to liver capillaries before returning to the heart — important for nutrient processing and detoxification.
- Hypophyseal (pituitary) portal system: Blood from hypothalamic capillaries goes to anterior pituitary capillaries to carry releasing/inhibiting hormones.
- Renal portal system: Present in some vertebrates and many invertebrates — blood from body capillaries passes through kidney capillaries.
Comparative summary
- Open: hemolymph bathes tissues; lower pressure; common in arthropods.
- Closed single: one-pass heart → gills → body → heart; typical of fishes.
- Closed double: separate pulmonary and systemic circuits; partial (amphibians/reptiles) or complete (birds/mammals).
Physiological significance
Type of circulation correlates with metabolic demand and activity level. Active, endothermic animals (birds, mammals) require high-pressure, efficient closed double circulation to deliver oxygen rapidly to tissues. Aquatic animals with gills (fish) use single circulation which suits their gas exchange method. Open systems suit small or less active animals because they are cost-effective.
Suggested classroom diagrams
- Simple labelled diagrams: open circulatory system (haemocoel, ostia) vs closed system (heart, vessels).
- Flow diagrams: single circulation in fish; double circulation in amphibian (show partial mixing) and mammal (complete separation).
- Portal system schematic: GI tract capillaries → hepatic portal vein → liver capillaries.
Note: Diagrams should emphasise direction of flow with arrows and show oxygenated (red) and deoxygenated (blue) blood where relevant.
- Open circulatory system: Most insects (e.g., grasshopper), many crustaceans (e.g., prawns), and some molluscs.
- Closed single circulation: Teleost fishes (e.g., carp, salmon) — two-chambered heart (1 atrium, 1 ventricle).
- Closed double, partial (incomplete): Amphibians (e.g., frog) — three-chambered heart with some mixing; most reptiles (e.g., lizards) with incomplete ventricular septum.
- Closed double, complete: Mammals (e.g., humans) and birds (e.g., pigeon) — four-chambered heart fully separating pulmonary and systemic circuits.
- Portal systems: Hepatic portal circulation in humans (intestine → liver → heart); hypophyseal portal system (hypothalamus → anterior pituitary).
- Exceptions: Cephalopod molluscs (e.g., octopus) have a closed circulatory system despite being molluscs.
- Cardiac Output (CO) = Stroke Volume (SV) × Heart Rate (HR). Units: ml/min or L/min.
- Blood flow (volume flow rate) Q = ΔP / R where ΔP = pressure difference, R = resistance.
- Poiseuille's law for laminar flow in a vessel: Q = (π × ΔP × r^4) / (8 × η × l). Shows flow ∝ r^4 (r = radius, η = viscosity, l = length).
- Resistance of a vessel: R = (8 × η × l) / (π × r^4). Small changes in radius produce large changes in resistance and flow.
- Mean arterial pressure (approximation): MAP ≈ Diastolic BP + 1/3 × (Systolic BP − Diastolic BP).
Conducting System and Regulation of Heart
Overview
The heart's conducting system is a specialised network of cardiac muscle and nodal tissue that generates and conducts electrical impulses to produce coordinated atrial and ventricular contractions. Regulation of heart function is achieved by intrinsic properties (pacemaker activity and Frank–Starling mechanism), autonomic nervous system control, and endocrine influences.
Main components of the conducting system
- Sinoatrial (SA) node – the primary pacemaker located at the right atrial wall near the SVC entrance. Intrinsic rate: ~60–100 beats/min. Initiates the action potential (normal sinus rhythm).
- Atrial conduction pathways – carry impulses across atria causing atrial systole (P wave on ECG).
- Atrioventricular (AV) node – located in the interatrial septum near the tricuspid valve. Slows conduction (PR delay) to allow ventricular filling. Intrinsic rate: ~40–60 beats/min.
- Bundle of His (AV bundle) – conducts from AV node into interventricular septum and splits into right and left bundle branches.
- Purkinje fibres – rapidly conduct impulses through ventricles causing coordinated ventricular contraction. Intrinsic rate: ~20–40 beats/min.
Conduction speed (approximate)
- Atrial muscle: ~0.3–1.0 m/s
- AV node: ~0.05 m/s (slowest; causes delay)
- His–Purkinje system: ~2–4 m/s (fastest)
Cardiac cycle and ECG correlates
- Electrical events: SA node fire → atrial depolarisation (P wave) → AV node delay (PR interval) → ventricular depolarisation (QRS complex) → ventricular repolarisation (T wave).
- Mechanical events: atrial systole (tops up ventricles) → isovolumetric ventricular contraction → ventricular ejection → isovolumetric relaxation → passive ventricular filling.
Regulation of heart rate and contractility
- Autonomic nervous system
- Sympathetic (cardiac nerves, norepinephrine acting on β1 receptors): increases SA node firing rate (↑HR), shortens AV delay, increases contractility (↑stroke volume), increases conduction velocity.
- Parasympathetic (vagus nerve, acetylcholine on M2 receptors): decreases SA node firing rate (↓HR), increases AV delay, minimal effect on ventricular contractility.
- Hormonal – catecholamines (epinephrine, norepinephrine) increase HR and contractility; thyroid hormones increase sensitivity and basal rate.
- Intrinsic (Frank–Starling law) – increased venous return → increased end-diastolic volume (EDV) → greater stretch of ventricular muscle fibers → increased stroke volume.
- Reflexes
- Baroreceptor reflex: carotid sinus & aortic arch baroreceptors sense BP changes and adjust HR and vessel tone via autonomic pathways.
- Bainbridge reflex: increased venous return/stretch of atria increases HR via sympathetic activation.
- Chemoreceptor reflex: changes in pO2, pCO2, pH alter sympathetic/parasympathetic outflow.
Clinical and physiological notes
- ECG interpretation links electrical events to mechanical function (e.g., prolonged PR interval = AV block; widened QRS = bundle branch block).
- Pacemaker implants replace SA node function when intrinsic pacemaking or conduction is inadequate (e.g., complete heart block).
- Drugs: β-blockers reduce HR and contractility; vagomimetics slow HR; atropine blocks vagal effects and increases HR.
Normal numeric values (resting adult)
- Heart rate (HR): 60–100 bpm
- Stroke volume (SV): ~60–100 mL (commonly ~70 mL)
- Cardiac output (CO): ~4–6 L/min (CO = SV × HR)
Summary
The conducting system ensures orderly spread of excitation for efficient pumping. Heart function is adjusted rapidly by nerves and hormones and intrinsically by preload (Frank–Starling). Clinical tests (ECG, pressure traces) and interventions (drugs, pacemakers) act by modifying conduction or regulation mechanisms.
- Exercise: sympathetic activation raises HR and contractility; stroke volume and cardiac output increase to meet skeletal muscle oxygen demand.
- Carotid sinus massage: increases baroreceptor firing (simulating high BP) → increased vagal output → slowed AV conduction and decreased heart rate (used diagnostically for certain tachycardias).
- Vasovagal syncope: excessive vagal activation + reduced sympathetic tone → sudden bradycardia and vasodilation → fainting due to transient cerebral hypoperfusion.
- Beta-blocker therapy: blocks β1 receptors → reduces heart rate and contractility; used in hypertension, arrhythmias, and post-MI management.
- Sick sinus syndrome or complete heart block: intrinsic pacemaker/conduction failure requiring an artificial pacemaker to maintain adequate heart rate.
- Cardiac output (CO) = Stroke volume (SV) × Heart rate (HR)
- Stroke volume (SV) = End-diastolic volume (EDV) − End-systolic volume (ESV)
- Ejection fraction (EF) = (SV / EDV) × 100%
- Mean arterial pressure (MAP) ≈ Cardiac output (CO) × Total peripheral resistance (TPR)
- Approximate MAP from BP: MAP ≈ DBP + 1/3 × (SBP − DBP)
- Pulse pressure = Systolic BP − Diastolic BP
Human circulatory system overview
The human circulatory system is a closed, double circulatory system whose primary job is to transport gases, nutrients, hormones and wastes; regulate body temperature and pH; and help defend the body against disease. It comprises three major components: blood, heart and blood vessels, plus the lymphatic system which returns excess tissue fluid to blood.
- Blood: A fluid connective tissue made of plasma (water, ions, proteins, nutrients, wastes, hormones) and formed elements (red blood cells, white blood cells, platelets). Functions: transport, immune defence, clotting and homeostasis.
- Heart: A four-chambered muscular pump (right atrium, right ventricle, left atrium, left ventricle) with valves (tricuspid, pulmonary, mitral, aortic) that ensures unidirectional flow. Contraction and relaxation of chambers constitute the cardiac cycle (atrial systole, ventricular systole with isovolumetric contraction and ejection, and diastole with isovolumetric relaxation and filling).
- Blood vessels: Arteries (carry blood away from heart, thick elastic walls), arterioles (resistance vessels), capillaries (sites of exchange; thin walls), venules and veins (return blood to heart; contain valves in limbs). Vessel radius greatly influences resistance and flow.
- Circulation types: Pulmonary circulation (right heart ↔ lungs) for gas exchange; systemic circulation (left heart ↔ body tissues) for delivering oxygen and nutrients; coronary circulation supplies the heart muscle itself; fetal circulation has shunts (foramen ovale, ductus arteriosus) eliminated at birth.
- Transport and exchange: In capillaries, exchange occurs by diffusion (O2, CO2, small solutes), bulk flow (filtration and reabsorption controlled by hydrostatic and osmotic pressures) and transcytosis for larger molecules.
- Physiological control: Heart rate and contractility are regulated by autonomic nervous system (sympathetic increases rate and force; parasympathetic decreases rate), hormones (adrenaline), and local factors (metabolites) that alter vessel tone. Baroreceptor reflex maintains short-term blood pressure stability.
- Clinical relevance: Blood pressure (measured as systolic/diastolic) and cardiac output are key indicators of cardiovascular health. Disorders include hypertension, atherosclerosis, myocardial infarction, varicose veins, edema and lymphatic obstruction.
Key concepts to remember: humans have a double (pulmonary + systemic) closed circulation; cardiac output equals heart rate times stroke volume; blood flow depends on pressure gradient and vascular resistance; arterioles are the primary site of resistance and blood pressure regulation; capillaries are the primary site of exchange.
- Measuring pulse at the radial artery to estimate heart rate and detect rhythm abnormalities.
- Tourniquet applied temporarily to a limb during venipuncture causes veins to bulge — demonstrates venous return and valves.
- Blood donation reduces blood volume temporarily; body adjusts cardiac output and vascular tone to compensate.
- Athlete's bradycardia: trained athletes often show lower resting heart rate with maintained or increased stroke volume, so cardiac output remains sufficient.
- Hypertension example: sustained high systolic/diastolic pressure increases risk of heart attack and stroke due to arterial damage.
- Edema in lymphedema: blockage of lymphatic vessels causes accumulation of interstitial fluid and swelling.
- Cardiac output (CO) = Heart rate (HR) × Stroke volume (SV). Units: L/min. Example: HR 70/min × SV 70 mL = 4900 mL/min ≈ 4.9 L/min.
- Ohm's-law analogue for blood flow: Flow (Q) = ΔP / R, where ΔP is pressure difference between two points and R is vascular resistance.
- Mean arterial pressure (MAP) ≈ Diastolic BP + 1/3 (Systolic BP − Diastolic BP).
- Pulse pressure = Systolic BP − Diastolic BP.
- Poiseuille's law (idealized for laminar flow): Q = (π ΔP r^4) / (8 η l), showing flow is proportional to fourth power of vessel radius (r).
- Capillary filtration: Net filtration pressure ≈ (Capillary hydrostatic pressure − Interstitial hydrostatic pressure) − (Capillary oncotic pressure − Interstitial oncotic pressure) (Starling forces).
Cardiac Output and Stroke Volume
Definitions
Stroke volume (SV) is the volume of blood ejected by one ventricle in a single heartbeat. Cardiac output (CO) is the volume of blood pumped by a ventricle per minute.
Key relationships and units
CO = SV × HR (heart rate). Typical resting values: SV ≈ 60–100 mL/beat (commonly ~70 mL), HR ≈ 60–80 beats/min, so CO ≈ 4–6 L/min. Units: SV in mL/beat, HR in beats/min, CO in L/min or mL/min.
How SV is determined
SV = EDV − ESV, where EDV is end‑diastolic volume (ventricle filled at end of diastole) and ESV is end‑systolic volume (volume remaining after contraction). Three major physiological determinants of SV are:
- Preload (venous return / EDV): increased preload stretches myocardium and increases SV (Frank–Starling law).
- Afterload (arterial pressure the heart works against): increased afterload (e.g., high arterial pressure) tends to reduce SV.
- Contractility (inotropy): sympathetic stimulation or positive inotropes raise contractility and increase SV for a given preload.
Frank–Starling mechanism
Within physiological limits, the more the ventricular muscle is stretched during filling (higher EDV), the stronger the subsequent contraction and the larger the SV. This balances output between the two sides of the heart and matches venous return to cardiac output.
Effects on cardiac output
Any change in SV or HR changes CO. During exercise both HR and SV increase, so CO rises markedly (rest ~5 L/min → intense exercise 15–25 L/min in non‑athletes, higher in trained athletes). In heart failure, SV falls and CO may be maintained only by increasing HR, but this is often insufficient.
Clinical/physiological notes
Ejection fraction (EF = SV/EDV ×100%) is a measure of pump efficiency (normal EF ≈ 55–70%). Cardiac index (CI = CO/body surface area) normalizes CO to body size (normal ≈ 2.5–4.0 L/min/m²).
- Simple calculation: If SV = 70 mL and HR = 70 beats/min, CO = 70 mL/beat × 70 beats/min = 4900 mL/min ≈ 4.9 L/min.
- During moderate exercise HR may rise to 120/min and SV to 100 mL/beat → CO = 12 L/min (increased oxygen delivery to muscles).
- Hemorrhage reduces venous return (preload) → EDV falls → SV and CO drop; compensatory tachycardia can partially maintain CO.
- Endurance athletes often have high SV at rest (e.g., 100 mL) and low resting HR (e.g., 50/min) → CO ≈ 5 L/min but with greater reserve during exercise.
- In left ventricular failure EF falls (e.g., EF <40%), SV and CO decrease producing fatigue and breathlessness.
- CO = SV × HR (Cardiac output = Stroke volume × Heart rate)
- SV = EDV − ESV (Stroke volume = End‑diastolic volume − End‑systolic volume)
- EF (%) = (SV / EDV) × 100 (Ejection fraction as percentage)
- Cardiac index (CI) = CO / body surface area (normal ≈ 2.5–4.0 L/min/m²)
Heart: structure and chambers
Overview: The heart is a muscular pump located in the thoracic cavity, between the lungs in the mediastinum. It is roughly the size of the owner's clenched fist and weighs about 200–350 g (male ≈ 300 g, female ≈ 250 g). The heart pumps blood through two connected circuits: the pulmonary circuit (to lungs) and the systemic circuit (to body).
External coverings and layers
The heart is enclosed by the pericardium (fibrous pericardium + serous pericardium). Its wall has three layers:
- Epicardium (outer serous layer)
- Myocardium (thick cardiac muscle layer responsible for contraction)
- Endocardium (inner endothelial lining continuous with blood vessels)
Chambers and septa
The heart has four chambers arranged in two input (atria) and two output (ventricles) chambers:
- Right atrium – receives deoxygenated blood from the superior and inferior venae cavae and coronary sinus.
- Right ventricle – pumps deoxygenated blood into the pulmonary trunk toward the lungs.
- Left atrium – receives oxygenated blood from pulmonary veins.
- Left ventricle – pumps oxygenated blood into the aorta for systemic distribution.
Chambers are separated by septa: the interatrial septum (between atria) and the interventricular septum (between ventricles). The left side is separated from the right side so that oxygenated and deoxygenated blood do not mix.
Valves and internal structures
Valves ensure unidirectional blood flow:
- Atrioventricular (AV) valves: tricuspid (right; 3 cusps) and bicuspid/mitral (left; 2 cusps). These close during ventricular contraction.
- Semilunar valves: pulmonary (between right ventricle and pulmonary trunk) and aortic (between left ventricle and aorta). These prevent backflow into ventricles after ejection.
Support structures: chordae tendineae (tendinous cords) attach valve cusps to papillary muscles in ventricles to prevent valve prolapse during systole. Internal ventricular surfaces show trabeculae carneae; the right ventricle may have the moderator band.
Wall thickness and functional adaptations
Wall thickness varies by chamber because of differing workload. Typical approximate thicknesses: atria ~2–3 mm, right ventricle ~3–5 mm, left ventricle ~8–12 mm. The left ventricle develops high pressure to pump blood systemically, so it has the thickest myocardium.
Coronary circulation
The myocardium is supplied by coronary arteries (left and right coronary arteries and their branches). Coronary veins drain into the coronary sinus and then the right atrium. Blockage of a coronary artery causes myocardial ischemia (heart attack).
Blood flow sequence (simplified)
- Deoxygenated blood → superior/inferior vena cava → right atrium
- Right atrium → tricuspid valve → right ventricle
- Right ventricle → pulmonary valve → pulmonary trunk → lungs (oxygenation)
- Oxygenated blood → pulmonary veins → left atrium
- Left atrium → mitral valve → left ventricle
- Left ventricle → aortic valve → aorta → systemic circulation
Clinical correlations (brief)
- Myocardial infarction: blockage in coronary artery → necrosis of myocardium supplied.
- Valvular disorders: stenosis or regurgitation of AV or semilunar valves → murmurs, reduced efficiency.
- Septal defects (ASD, VSD): openings in septa cause abnormal shunting of blood.
- Measuring pulse at the wrist: each pulse corresponds to a ventricular contraction (heart rate).
- Exercise: increased sympathetic activity raises heart rate (HR) and, initially, stroke volume (SV) — together increasing cardiac output (CO) to meet higher oxygen demand.
- Myocardial infarction: a blocked coronary artery reduces oxygen delivery to a portion of the myocardium; corresponding chest pain and loss of contractile tissue may lower stroke volume and CO.
- Mitral regurgitation: faulty mitral valve allows backflow from left ventricle to left atrium during systole, producing a characteristic murmur and reducing forward stroke volume.
- Cardiac output (CO) = Heart rate (HR) × Stroke volume (SV). Typical resting CO ≈ 70 beats/min × 70 mL ≈ 4900 mL/min (~5 L/min).
- Stroke volume (SV) = End-diastolic volume (EDV) − End-systolic volume (ESV).
- Ejection fraction (EF) = (SV / EDV) × 100%. Normal EF ≈ 55–70%.
- Mean arterial pressure (MAP) ≈ CO × Total peripheral resistance (TPR) (useful for systemic pressure relations).
- Pressure–flow relation (Ohm's law for circulation): ΔP = Flow × Resistance (ΔP often = arterial pressure − venous pressure).
Cardiac conduction system and cardiac cycle
Overview
The heart is an electrically driven pump. The cardiac conduction system generates and conducts electrical impulses that coordinate atrial and ventricular contraction, producing an efficient cardiac cycle of filling and ejection.
Cardiac conduction system (structure & function)
- Sino‑atrial (SA) node – the primary pacemaker located in the right atrial wall near the superior vena cava. It spontaneously generates impulses (normal rate ≈ 60–100 beats/min).
- Atrial conduction pathways / internodal tracts – conduct impulses across the atria causing atrial depolarization and contraction.
- Atrioventricular (AV) node – located at the interatrial septum near the tricuspid valve. It slows conduction (AV delay ≈ 0.08–0.12 s) allowing ventricles to fill before they contract.
- AV bundle (Bundle of His) – conducts impulses from AV node into the interventricular septum.
- Right and left bundle branches – carry impulses down each side of the septum toward the apex.
- Purkinje fibers – fast conducting fibers that distribute impulse through ventricular myocardium, producing coordinated ventricular contraction.
Pacemaker physiology (simple)
Pacemaker cells (SA node) have unstable resting membrane potentials: slow diastolic depolarization (’pacemaker potential’) due to inward Na+ (funny current, If) and Ca2+ currents until threshold is reached and an action potential fires. Autonomic input modulates rate: sympathetic ↑ (noradrenaline → ↑If and Ca2+ currents) increases heart rate; parasympathetic (vagus) ↓ (acetylcholine → ↑K+ conductance) decreases rate.
Cardiac cycle (mechanical events)
- Diastole (relaxation & filling) – ventricles relaxed, AV valves open; passive filling of ventricles from atria. Late in diastole atrial systole (atrial contraction) tops up ventricular volume (important during high heart rates).
- Isovolumetric contraction – ventricles begin to contract; all valves closed for a brief interval; pressure rises but volume is unchanged.
- Ventricular ejection – when ventricular pressure exceeds aortic/pulmonary pressure, semilunar valves open and blood is ejected (stroke volume).
- Isovolumetric relaxation – ventricles relax; semilunar valves close (second heart sound) and all valves are closed until pressure drops below atrial pressure.
Heart sounds
S1 (’lub’) = closure of AV valves (mitral & tricuspid) at start of ventricular systole. S2 (’dup’) = closure of semilunar valves (aortic & pulmonary) at start of ventricular diastole.
Electrical–mechanical correlation (ECG)
- P wave – atrial depolarization → atrial systole (helps late ventricular filling).
- PR interval – conduction time from atria to ventricles (includes AV nodal delay).
- QRS complex – ventricular depolarization → onset of ventricular systole; atria repolarize during this but the signal is hidden in QRS.
- ST segment – ventricular plateau (ventricles contracting / ejection phase).
- T wave – ventricular repolarization → ventricles begin to relax (diastole).
Important typical values (approx.)
- Resting heart rate ≈ 60–100 bpm (typical 72 bpm)
- End‑diastolic volume (EDV) ≈ 120 mL, end‑systolic volume (ESV) ≈ 50 mL
- Stroke volume (SV) ≈ 70 mL, Cardiac output (CO) at rest ≈ 5 L/min
- Conduction speeds: Purkinje ≈ 2–4 m/s (fast), ventricular muscle ≈ 0.3–1 m/s; AV nodal delay ≈ 0.08–0.12 s.
Clinical relevance / regulation
Arrhythmias occur when impulse generation or conduction is abnormal (e.g., SA node failure, heart block at AV node). Artificial pacemakers can replace SA node function. Drugs: beta‑blockers ↓ heart rate and contractility; vagal stimulation ↓ heart rate. Exercise ↑ sympathetic drive → ↑HR and SV → ↑CO to meet metabolic demand.
- During exercise: sympathetic stimulation increases SA node firing rate and contractility, so HR and stroke volume rise; cardiac output may increase from ~5 L/min at rest to 20–30 L/min in trained athletes.
- Heart block (AV block): if the AV node is damaged, impulses are delayed or blocked; a complete block may require an artificial pacemaker to maintain ventricular rate.
- Electrocardiogram (ECG) monitoring: the P wave, QRS complex and T wave are used in hospitals to detect arrhythmias, myocardial infarction (ST elevation), and conduction delays.
- Athlete’s bradycardia: well‑trained athletes often have resting HR <60 bpm due to high vagal tone and increased stroke volume.
- Stroke Volume (SV) = End‑Diastolic Volume (EDV) − End‑Systolic Volume (ESV)
- Cardiac Output (CO) = Stroke Volume (SV) × Heart Rate (HR)
- Ejection Fraction (EF) = (SV / EDV) × 100% (normal ≈ 55–70%)
- Mean Arterial Pressure (approx.) MAP ≈ Diastolic BP + 1/3 × (Systolic BP − Diastolic BP)
- CO (L/min) example: CO = 70 mL × 72 beats/min ≈ 5040 mL/min ≈ 5.04 L/min
Key Concepts
- Intracellular fluid (ICF)
- Fluid contained within cells, rich in potassium and organic phosphates, that maintains cell shape and biochemical reactions.
- Extracellular fluid (ECF)
- Fluid outside cells including plasma and interstitial fluid, involved in transport of nutrients and waste between blood and cells.
- Plasma
- Liquid component of blood (about 55%) composed of water, ions, proteins (albumin, globulins, fibrinogen), nutrients, hormones and wastes.
- Serum
- Plasma without clotting factors (mainly fibrinogen), obtained after blood has clotted.
- Lymph
- A clear fluid derived from interstitial fluid that circulates in lymphatic vessels and returns proteins and excess fluid to the blood.
- Erythrocyte (Red blood cell)
- Biconcave, anucleate cell containing hemoglobin that transports oxygen and carbon dioxide.
- Leukocyte (White blood cell)
- Nucleated blood cells involved in immune defence; include neutrophils, lymphocytes, monocytes, eosinophils and basophils.
- Platelets (Thrombocytes)
- Cell fragments derived from megakaryocytes that initiate blood clotting and help seal damaged vessels.
- Hemoglobin
- Iron-containing pigment in RBCs that binds oxygen in the lungs and releases it in tissues.
- Hematocrit
- Percentage of blood volume occupied by red blood cells; an indicator of oxygen-carrying capacity.
- Blood groups (ABO)
- Classification of blood based on presence or absence of A and B antigens on RBCs; determines compatibility in transfusion.
- Rh factor
- A protein (D antigen) on RBCs; presence (Rh+) or absence (Rh−) is important in pregnancy and transfusion reactions.
- Coagulation (blood clotting)
- Cascade of enzyme activations converting fibrinogen to fibrin to form a stable blood clot and prevent excessive bleeding.
- Heart (structure)
- A four-chambered muscular organ with two atria and two ventricles that pumps blood through pulmonary and systemic circuits.
- Cardiac cycle
- Sequence of events in one heartbeat including atrial systole, ventricular systole and diastole, resulting in blood flow through the heart.
- Sinoatrial (SA) node
- Specialized pacemaker tissue in the right atrium that generates rhythmic impulses to initiate the heartbeat.
- Atrioventricular (AV) node
- Conduction tissue between atria and ventricles that delays impulses to allow ventricular filling before contraction.
- Blood vessels (arteries, veins, capillaries)
- Network of tubes: arteries carry blood away from heart under high pressure, veins return blood to heart with valves, capillaries allow exchange with tissues.
- Double circulation
- Two separate blood flow circuits: pulmonary circulation (heart↔lungs) for gas exchange and systemic circulation (heart↔body) for nutrient delivery.
- Coronary circulation
- Blood supply to the heart muscle provided by coronary arteries and drained by cardiac veins; essential for myocardial oxygenation.
End-of-Chapter Trial Paper & Test Questions
Topic-wise questions to test your understanding of every concept in this chapter.
-
Differentiate between plasma and serum. / प्लाज्मा और सीरम में अंतर बताइए।
Show answer
Plasma is the liquid part of anticoagulated blood and contains fibrinogen and clotting factors, whereas serum is plasma minus the clotting proteins, obtained after blood has clotted. / प्लाज्मा थक्कारोधी रक्त का तरल भाग है जिसमें फाइब्रिनोजन तथा थक्का बनाने वाले कारक होते हैं, जबकि सीरम रक्त के थक्का बनने के बाद प्राप्त होता है और इसमें थक्का बनाने वाली प्रोटीनें नहीं होतीं।
-
Why does a deficiency of plasma albumin (hypoalbuminaemia) cause oedema? / प्लाज्मा एल्ब्यूमिन की कमी (हाइपोएल्ब्यूमिनीमिया) एडिमा क्यों उत्पन्न करती है?
Show answer
Albumin generates most of the plasma oncotic (colloid osmotic) pressure that pulls water into capillaries; when it falls, fluid is not retained in the vessels and leaks into the interstitial space, causing oedema. / एल्ब्यूमिन प्लाज्मा का अधिकांश ऑनकोटिक (कोलॉइड परासरणी) दाब उत्पन्न करता है जो जल को केशिकाओं में खींचता है; इसकी कमी होने पर जल वाहिकाओं में नहीं रुकता और अंतरालीय स्थान में रिसकर एडिमा उत्पन्न करता है।
-
A dehydrated patient shows a raised haematocrit although total RBC number is unchanged. Explain. / एक निर्जलित रोगी में कुल RBC संख्या अपरिवर्तित रहने पर भी हीमैटोक्रिट बढ़ा हुआ दिखता है। समझाइए।
Show answer
Dehydration reduces plasma (water) volume, so the same number of RBCs now occupy a larger proportion of the reduced total blood volume, raising the measured haematocrit. / निर्जलीकरण से प्लाज्मा (जल) का आयतन घट जाता है, अतः समान संख्या के RBC अब घटे हुए कुल रक्त आयतन का बड़ा अनुपात घेरते हैं, जिससे मापा गया हीमैटोक्रिट बढ़ जाता है।
-
Name the three main plasma proteins and state one function of each. / तीन मुख्य प्लाज्मा प्रोटीनों के नाम लिखिए और प्रत्येक का एक कार्य बताइए।
Show answer
Albumin maintains oncotic pressure and transports molecules; globulins (immunoglobulins) provide humoral immunity and transport; fibrinogen is converted to fibrin during blood clotting. / एल्ब्यूमिन ऑनकोटिक दाब बनाए रखता है तथा अणुओं का परिवहन करता है; ग्लोब्युलिन (इम्यूनोग्लोब्युलिन) हास्य प्रतिरक्षा एवं परिवहन प्रदान करते हैं; फाइब्रिनोजन रक्त के थक्के बनने के दौरान फाइब्रिन में बदलता है।
-
Calculate the plasma volume if total blood volume is 5 L and haematocrit is 45%. / यदि कुल रक्त आयतन 5 L तथा हीमैटोक्रिट 45% हो तो प्लाज्मा आयतन ज्ञात कीजिए।
Show answer
Plasma volume = Blood volume × (1 − Hct fraction) = 5 × (1 − 0.45) = 5 × 0.55 = 2.75 L. / प्लाज्मा आयतन = रक्त आयतन × (1 − Hct भिन्न) = 5 × (1 − 0.45) = 5 × 0.55 = 2.75 L।
-
Explain how a fibrin clot is formed at the site of a vessel injury. / वाहिका की चोट के स्थान पर फाइब्रिन का थक्का कैसे बनता है, समझाइए।
Show answer
Platelets adhere to the injured site forming a platelet plug, and the coagulation cascade activates thrombin which converts soluble fibrinogen into insoluble fibrin threads that mesh and stabilise the clot; Ca2+ and vitamin K are required. / प्लेटलेट्स चोट वाले स्थान पर चिपककर प्लेटलेट प्लग बनाते हैं, तथा स्कंदन श्रृंखला थ्रॉम्बिन को सक्रिय करती है जो घुलनशील फाइब्रिनोजन को अघुलनशील फाइब्रिन तंतुओं में बदल देता है जो जाल बनाकर थक्के को स्थिर करते हैं; इसके लिए Ca2+ तथा विटामिन K आवश्यक हैं।
-
Why does a person living at high altitude develop a higher RBC count and haemoglobin level? / उच्च ऊँचाई पर रहने वाले व्यक्ति में RBC संख्या तथा हीमोग्लोबिन स्तर अधिक क्यों हो जाते हैं?
Show answer
Low oxygen (hypoxia) at high altitude stimulates erythropoietin release, which increases erythropoiesis (RBC production), raising RBC count and haemoglobin to improve oxygen-carrying capacity. / उच्च ऊँचाई पर कम ऑक्सीजन (हाइपोक्सिया) एरिथ्रोपोइटिन के स्राव को उद्दीपित करता है, जो लाल रक्त कोशिका निर्माण (एरिथ्रोपोइसिस) बढ़ाकर RBC संख्या और हीमोग्लोबिन बढ़ाता है ताकि ऑक्सीजन वहन क्षमता सुधरे।
-
How is the structure of a mature mammalian erythrocyte adapted to its function? / स्तनधारी की परिपक्व लाल रक्त कोशिका की संरचना उसके कार्य के लिए कैसे अनुकूलित है?
Show answer
It is biconcave to maximise surface area for gas exchange and stay flexible to pass through capillaries, and it is anucleate so that more space is available to pack haemoglobin for oxygen transport. / यह उभयावतल (बाइकोनकेव) होती है जिससे गैस विनिमय हेतु अधिकतम सतह क्षेत्र मिलता है और यह केशिकाओं से गुजरने के लिए लचीली रहती है, तथा यह केंद्रकविहीन होती है जिससे ऑक्सीजन परिवहन हेतु अधिक हीमोग्लोबिन भरने के लिए अधिक स्थान मिलता है।
Related Laws & Principles
Explore allFoundational laws & principles behind this chapter. Each one opens a full page — what it says, why it matters, five practice questions and the mistakes to avoid.