Overview
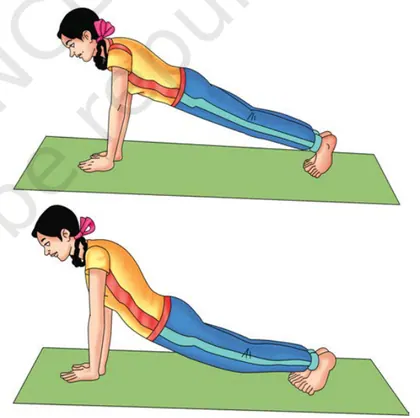
Introduction: This chapter (Class 11 Physical Education — NCERT) explains the concepts of test, measurement and evaluation in physical education. It distinguishes measurement (quantifying physical attributes), test (a tool or procedure to obtain measurements) and evaluation (judging performance using measurements). Importance: Measurement and evaluation help teachers and learners to monitor progress, design training programmes, identify strengths and weaknesses, select and predict talent, ensure safety and motivate students. Key themes: types of tests (criterion-referenced vs norm-referenced), domains of assessment (cognitive, psychomotor, affective), components of fitness (cardiorespiratory endurance, strength, speed, flexibility, agility, body composition), anthropometric measures (height, weight, BMI, skinfolds), psychometric properties of tests (reliability, validity, objectivity, accuracy, feasibility) and standards (norms and scoring). Practical aspects: standardization of procedures, administration protocols (warm-up, instructions, equipment calibration), recording and reporting results, use of basic statistics (mean, median, mode, standard deviation, percentiles) and…
Learning Objectives
- Define measurement, evaluation, testing and norms in the context of physical education
- Explain the purposes and functions of measurement and evaluation in school physical education
- Differentiate between formative and summative evaluation, and between norm‑referenced and criterion‑referenced assessment
- Describe the characteristics of a good test (reliability, validity, objectivity, practicality, sensitivity)
- Calculate measures of central tendency and dispersion (mean, median, mode, variance, standard deviation) for given data
- Calculate and interpret reliability coefficients using test‑retest, inter‑rater and split‑half methods
- Apply percentile ranks, z‑scores and T‑scores to interpret individual test results against norms
- Construct a simple test battery for motor fitness and justify the choice of tests and scoring procedures
Topics in this chapter
17 topics · tap a topic title to jump straight to it.
Introduction: Test, Measurement, Evaluation
Overview
In Physical Education, learning about fitness, skill and performance relies on three linked processes: test, measurement and evaluation. Together they help teachers, coaches and students identify current status, monitor progress and make decisions for training, selection and health.
Definitions
- Test – A specific tool or procedure used to assess a particular physical ability, skill or attribute (for example, a 50 m sprint to test speed).
- Measurement – The process of assigning numbers or values to the results of a test using standard units (for example, time in seconds, distance in centimetres, BMI value).
- Evaluation – The interpretation of measured data to judge performance, make comparisons, classify ability, diagnose strengths/weaknesses and plan improvement (for example, deciding whether a student’s endurance is 'satisfactory' or 'needs improvement').
Key differences (concise)
- Test = tool/procedure; Measurement = quantification; Evaluation = judgement/interpretation.
- Testing produces raw data; measurement gives numerical values; evaluation converts numbers into meaningful conclusions.
Purposes of Testing, Measurement and Evaluation
- Placement and selection (e.g., sports teams).
- Diagnosis of strengths/weaknesses to plan training.
- Monitoring progress and improvement over time.
- Motivation and providing feedback to learners.
- Research and program evaluation.
Characteristics of a Good Test
- Validity – Test measures what it claims to measure.
- Reliability – Test yields consistent results over repeated trials.
- Objectivity – Scoring is not influenced by tester bias.
- Practicality/Feasibility – Test is economical, safe and easy to administer.
- Standardization – Procedures and conditions are uniform so results are comparable.
Types and Domains
- Domains: Psychomotor (skills, fitness), Cognitive (knowledge), Affective (attitudes).
- Types of interpretation: Norm-referenced (compare to peers) and Criterion-referenced (compare to fixed standards).
- Levels of measurement: Nominal, Ordinal, Interval, Ratio — important for choosing appropriate statistical methods.
Steps in a Typical Evaluation Process
- Define what to measure (objective).
- Select or design an appropriate test.
- Administer the test under standard conditions.
- Record measurements carefully.
- Apply statistical tools (mean, SD, percentiles) as needed.
- Interpret results and give feedback, set goals or intervene.
Use of Basic Statistics
Statistics such as mean, median, mode, standard deviation, percentiles and correlation are commonly used to summarize scores, study variability, compare groups and assess relationships between different tests.
Practical considerations for teachers/coaches
- Ensure safety, correct warm-up and standardized instructions.
- Use multiple trials where appropriate to improve reliability.
- Combine objective data with observation for a full evaluation.
- 50 m sprint: Test = 50 m dash; Measurement = time in seconds; Evaluation = compare time against class norms to judge speed.
- Sit-and-reach test: Test measures flexibility; Measurement = distance (cm); Evaluation = classify as poor/average/good using criterion values.
- BMI calculation: Measurement of weight and height produces BMI value; Evaluation = categorize underweight/normal/overweight using standard cut-offs.
- Harvard Step Test: Measures cardiovascular endurance by recording recovery heart rates; Evaluation = compute fitness index and interpret fitness level.
- Selection for school team: Use multiple test scores (speed, agility, skill tests) to evaluate and select players.
- Diagnostic use: Low scores in shuttle run (agility/endurance) lead to targeted training program and periodic re-testing to monitor improvement.
- BMI = weight (kg) / [height (m)]^2 — used for body composition screening.
- Percentage score = (Obtained marks / Total marks) × 100.
- Mean (average) = Σx / n where Σx is sum of all scores and n is number of observations.
- Standard deviation (sample) = sqrt [ Σ(x - x̄)^2 / (n - 1) ] where x̄ is the sample mean.
- Z-score = (X - mean) / SD — shows how many standard deviations a score X is from the mean.
- Percentile rank ≈ (number of scores below X / total number of scores) × 100 — gives relative standing among peers.
Objectives and Importance
Objectives
- Diagnose strengths and weaknesses: To identify an individual’s physical fitness, motor ability and skill levels so teachers/coaches can design appropriate training and instruction.
- Placement and selection: To select and place students or athletes in teams, events or specialized training programs based on measured ability.
- Measure progress and improvement: To monitor changes over time (formative evaluation) and evaluate final achievement (summative evaluation).
- Standardisation and comparison: To compare performances against norms, standards or criterion-referenced benchmarks for fair assessment.
- Motivation and feedback: To give learners objective feedback, set realistic goals and motivate improvement.
- Curriculum and programme planning: To inform planning of classes, training loads and individualized programmes based on measured needs.
- Research and policy-making: To provide data for studies, policy decisions and development of training methods and health promotion.
Importance
- For teachers/coaches: Provides objective data to diagnose learning needs, adapt instruction, and evaluate effectiveness of teaching methods.
- For students/athletes: Clarifies current status, sets targets, tracks progress and increases accountability.
- For administrators and selectors: Enables fair selection, talent identification and resource allocation based on documented measures.
- Improving safety and health: Identifies health risks (e.g., obesity, poor cardiovascular endurance) and prevents inappropriate training loads.
- Quality control: Ensures tests are valid, reliable and standardized so results are meaningful and reproducible.
- Motivation and reinforcement: Objective evidence of improvement encourages continued participation and effort.
How objectives and importance work together (brief process): Choose appropriate tests → administer reliably → analyse results using simple statistics → interpret vs norms or criteria → use findings to plan training, give feedback and re-test periodically.
- A PE teacher gives the 100 m sprint test at start and end of term. A student improves from 14.5 s to 13.8 s. Percentage improvement = ((13.8 - 14.5)/14.5) × 100 = -4.83% (time decreased, performance improved). The teacher uses this to adjust the student’s sprint training.
- For team selection, coaches use timed agility and endurance tests. A player consistently in top 10% of a normative table for the sprint and endurance tests is selected for the school team.
- A coach measures push‑ups at month 0 and month 3. Raw scores are converted to z‑scores (z = (X - mean)/SD) to compare improvement relative to the group when group means differ.
- A health screening finds several students with high BMI and low beep test scores. The school introduces targeted fitness lessons and monitors progress monthly to reduce health risk.
- Mean (average) = Σx / n
- Median = middle value when data are ordered (or average of two middle values if n is even)
- Mode = most frequently occurring score
- Range = Maximum value − Minimum value
- Variance (population) = Σ(x − mean)² / n
- Standard deviation (SD) = sqrt[Σ(x − mean)² / n]
Characteristics of a Good Test
Overview: A good test in physical education (or any educational/measurement context) must measure what it intends to measure, do so consistently, be fair and practical, and provide useful information for decision-making. The main characteristics are validity, reliability, objectivity, practicality (usability and economy), sensitivity and discrimination, standardization, and comprehensiveness.
- Validity: The degree to which a test actually measures the specific skill, ability or trait it claims to measure. Types include content validity (coverage of curriculum/tasks), criterion-related validity (correlation with a gold standard), and construct validity (measures the theoretical construct).
- Reliability: Consistency or repeatability of test scores. A reliable test yields similar results when repeated under similar conditions (test–retest), when split into halves (split‑half), or across items (internal consistency).
- Objectivity: Scoring should be independent of the scorer’s personal bias or opinion. Objective tests have clear, unambiguous scoring rules (e.g., timed runs with a stopwatch, multiple‑choice answers).
- Practicality (Feasibility and Economy): The test should be feasible to administer given available time, space, equipment, expertise and cost. Simple, low-cost, and safe tests are preferred when equivalent in quality.
- Sensitivity and Discrimination: A good test can detect small but meaningful differences among individuals and discriminate well between high and low performers (high discrimination index for items).
- Standardization: Administration, instructions, environment, equipment and scoring procedures should be standardized so that differences in scores reflect differences in ability, not testing conditions.
- Comprehensiveness and Relevance: The test content should reflect the important elements of the curriculum or the domain being assessed and should be suitable for the age and level of examinees.
- Safety and Ethics: Especially in physical tests, safety precautions must be built in; tests should be appropriate given the participants’ health and consent.
How these characteristics interact: Validity is most important — a test that is not valid is of little use even if it is reliable. Reliability is necessary for validity (you cannot validly interpret a score that is not consistent). Objectivity and standardization improve reliability. Practicality and economy influence whether a test can be used widely.
Key measurement concepts (brief): Use item analysis (difficulty and discrimination) to improve test quality; use reliability coefficients and SEM to interpret individual scores; use norms or percentiles for interpretation.
- 12-minute Cooper Run (cardio fitness): Validity—correlates with VO2max (criterion validity); Reliability—standardized distance and timing increases repeatability; Practicality—requires only a marked track and stopwatch.
- 100 m sprint: Objectivity—time measured with a stopwatch/electronic timing reduces scorer bias; Standardization—same start procedure and distance for all athletes.
- Written MCQ test on rules of a sport: Discrimination—well‑designed items distinguish between knowledgeable and less knowledgeable students; Item analysis can reveal items that are too easy, too hard, or nondiscriminating.
- Skill checklist for passing a gymnastic move: Comprehensiveness—checklist items cover all critical components (approach, takeoff, body position, landing); Objectivity—specific observable criteria for each component reduce subjective scoring.
- Item analysis numeric example: Top group (n=10) got item correct H=8, bottom group (n=10) L=3 → Difficulty P = (H+L)/(2n) = (8+3)/20 = 0.55 (moderate); Discrimination D = (H−L)/n = (8−3)/10 = 0.5 (good discrimination).
- Difficulty index (P) = (H + L) / (2n), where H = number correct in top group, L = number correct in bottom group, n = number in each group.
- Discrimination index (D) = (H − L) / n (same symbols as above).
- Split‑half (Spearman–Brown) prophecy formula: r_sb = (2 r_half) / (1 + r_half), where r_half is the correlation between the two halves.
- Standard Error of Measurement (SEM) = SD * sqrt(1 − r), where SD = standard deviation of observed scores, r = reliability coefficient.
- Cronbach’s alpha (internal consistency) (general form): alpha = (k / (k − 1)) * (1 − [Σ σ_i^2 / σ_total^2]), where k = number of items, σ_i^2 = variance of item i, σ_total^2 = variance of total test scores.
- Kuder–Richardson Formula 20 (KR‑20) for dichotomous items: KR‑20 = (k / (k − 1)) * (1 − Σ(p_i q_i) / σ_total^2), where p_i = proportion correct on item i, q_i = 1 − p_i.
Measurement Scales
Measurement scales are systems that classify, order, and quantify data. In statistics and evaluation (including Physical Education), understanding the scale of measurement tells you what mathematical operations are valid and which graphs or summary measures you can use. There are four main scales: nominal, ordinal, interval, and ratio.
- Nominal scale: Categorizes data without any order. Only equality/inequality is meaningful. Typical operations: count frequencies and calculate the mode.
- Ordinal scale: Orders observations (rankings), but the distances between ranks are not equal or known. You can determine medians and percentiles in addition to mode and frequencies.
- Interval scale: Has equal intervals between values but no true zero point (zero is arbitrary). Differences are meaningful (you can add/subtract); however, ratios are not meaningful. Example operations: mean, standard deviation, and addition/subtraction.
- Ratio scale: Has equal intervals and a true zero point, so all arithmetic operations and ratios are meaningful (e.g., twice as much). You can compute geometric means, coefficients of variation, and meaningful ratios.
Key distinctions to remember: nominal = names/categories (no order); ordinal = order only; interval = order + equal spacing (no true zero); ratio = interval + true zero (allows meaningful ratios).
In Physical Education, choosing the correct scale guides how to summarize and interpret results (for instance, you can compute average sprint time but not average jersey number). Misapplying statistics across incompatible scales leads to invalid conclusions.
- Nominal: Team names or jersey numbers (e.g., Red Team, Blue Team) — used for counting players or mode.
- Ordinal: Competition ranking (1st, 2nd, 3rd) or skill levels (Beginner, Intermediate, Advanced) — used for medians and percentiles.
- Interval: Temperature measured in Celsius during training sessions. Differences are meaningful (e.g., 5°C change), but 20°C is not 'twice' 10°C because zero is arbitrary.
- Ratio: Height, weight, distance run, time taken to finish a race, and number of goals scored. These have a true zero and allow meaningful ratios (e.g., one athlete can be twice as heavy).
- Physical example combining scales: During a track meet you record athlete bib number (nominal), finishing position (ordinal), track temperature (interval), and 100 m sprint times in seconds (ratio).
- Mean (for interval/ratio): \u03BC = (Σx_i) / n
- Median (ordinal/interval/ratio): middle value when data sorted (or average of two middle values if n is even)
- Mode (any scale with categories): most frequent value
- Range (interval/ratio): Range = max(x) - min(x)
- Standard deviation (interval/ratio): s = sqrt(Σ(x_i - x̄)^2 / (n - 1))
- Z-score (standardization, interval/ratio): z = (x - x̄) / s
Classification and Types of Tests
What is a Test? A test is a standardized procedure for sampling behaviour or performance to make inferences about ability, skill, fitness or knowledge. In Physical Education tests measure motor abilities, fitness components and sport skills.
Why classify tests? Classification helps teachers and coaches choose the right instrument for purpose (diagnosis, selection, monitoring), population (age, sex, level) and domain (cognitive, affective, psychomotor).
Main bases for classification
- By domain: Cognitive (knowledge), Affective (attitudes/values), Psychomotor (skills, fitness).
- By purpose: Diagnostic (identify strengths/weaknesses), Formative (monitor learning during instruction), Summative (final evaluation/selection).
- By administration: Group tests (e.g., shuttle run for a class) vs Individual tests (e.g., one‑rep max).
- By format/mode: Written (theory tests) vs Practical (skill/fitness assessments).
- By standardization: Standardized (norms and established procedures) vs Non‑standardized (teacher‑made or informal).
- By reference frame: Norm‑referenced (compare to peers) vs Criterion‑referenced (compare to a fixed standard).
- By time: Initial/pre‑test (baseline), Formative/in‑term (progress), Terminal/post‑test (outcome).
- By measurability: Objective (measurable scores, e.g., time/distance) vs Subjective (judgement/scoring, e.g., technique).
Types of physical tests (fitness & motor abilities)
- Speed tests: Short sprints (e.g., 50 m, 100 m) — measure maximum running velocity.
- Endurance/cardio-respiratory tests: Cooper 12‑min run, Harvard Step Test — measure aerobic capacity (VO2max or recovery index).
- Strength tests: Handgrip dynamometer, 1‑rep max protocols — measure maximal muscular force.
- Power/explosive strength: Vertical jump, Sargent jump test — measure explosive leg power.
- Flexibility: Sit and reach test — measure range of motion, especially hamstring and lower back flexibility.
- Agility: Shuttle run (4 × 10 m), T‑test — measure change of direction speed and coordination.
- Balance and coordination: Stork stand, balance beam tasks.
- Skill tests: Sport‑specific drills (dribbling in basketball, passing accuracy) — assess technique and game skills.
Selection principles
- Choose valid, reliable and objective measures where possible.
- Ensure tests are appropriate for age, gender and skill level.
- Provide clear standardized instructions and warm‑up.
- Use norm or criterion tables for interpretation, and repeat tests to establish reliability.
Interpretation & quality of tests
- Validity: Does the test measure what it claims? (content, criterion, construct validity)
- Reliability: Are results consistent across trials? (e.g., test‑retest reliability)
- Objectivity: Are results independent of the examiner?
- Practicality: Time, cost and ease of administration.
How teachers and coaches use tests: to screen for talent, set individual baselines, design training programs, monitor progress (pre‑/post‑tests) and evaluate outcomes against norms or performance goals.
- 100 m sprint — a speed test (record time in seconds).
- Cooper 12‑minute run — an endurance test (distance covered used to estimate VO2max).
- Sit and reach — a flexibility test (distance in cm behind/toes indicates hamstring flexibility).
- Harvard Step Test — cardiovascular fitness using post‑exercise recovery pulse to compute a Fitness Index.
- 4 × 10 m shuttle run — an agility test (total time measures change‑of‑direction speed).
- Handgrip dynamometer reading — measures static grip strength (kg).
- Percentage score = (Obtained score / Maximum possible score) × 100
- Z‑score = (Individual raw score − Mean score) / Standard deviation
- BMI = Weight (kg) / (Height (m))²
- Cooper 12‑min run VO2max (ml·kg⁻¹·min⁻¹) ≈ (Distance in meters − 504.9) / 44.73
- Harvard Step Test Fitness Index = (Duration of exercise in seconds × 100) / (2 × sum of recovery heartbeats in 1st, 2nd and 3rd minute)
- Standard Error of Measurement (SEM) = SD × sqrt(1 − reliability coefficient)
Components of Physical Fitness and Related Tests
Overview
Physical fitness is a set of attributes related to performing physical activity. CBSE groups them into two main categories: health-related components (important for overall health and daily functioning) and skill-related components (important for sports performance).
Health-related components
- Cardiovascular (aerobic) endurance – ability of heart, lungs and blood vessels to supply oxygen during sustained activity. Common tests: Cooper 12-minute run, 1.5-mile run, Harvard Step Test. Higher endurance gives better stamina in activities like long-distance running and swimming.
- Muscular strength – maximal force a muscle or group can produce in a single effort. Tests: 1RM estimation or handgrip dynamometer. Important for weightlifting, tackling in contact sports.
- Muscular endurance – ability of a muscle to perform repeated contractions over time without fatigue. Tests: timed sit-ups/crunches, push-up test, bent-arm hang. Crucial for activities like rowing or cycling.
- Flexibility – range of motion available at a joint. Test: Sit-and-Reach. Important for gymnastics, dance, injury prevention (low back, hamstring flexibility).
- Body composition – relative amounts of fat mass and fat-free mass. Measures: BMI, skinfolds, waist-hip ratio, BIA. Affects health risk, endurance and speed.
Skill-related components
- Speed – ability to move quickly (e.g., 50 m sprint test). Key for sprinters and many team-sport moments.
- Agility – ability to change direction rapidly and accurately (e.g., shuttle run, Illinois agility test). Important in football, basketball, badminton.
- Power – the product of strength and speed (explosive strength); tested by vertical jump or standing broad jump. Crucial for jumping, throwing.
- Coordination – ability to use senses and body parts together smoothly (e.g., wall toss test, plate tapping). Needed in racket sports, dance.
- Reaction time – time between stimulus and response (e.g., ruler drop test). Important in starts and defensive actions.
- Balance – ability to maintain equilibrium (e.g., Stork balance test). Vital for gymnastics, elderly fall prevention.
How tests are used
Tests are selected to measure specific components, to identify strengths/weaknesses, to set training goals, and to monitor progress. A typical testing battery will include one or more tests from both health- and skill-related groups to form a fitness profile.
Interpretation
Raw test scores are compared to norms (age- and sex-specific) or previous personal scores. A radar (spider) plot or bar chart typically visualizes a profile across components. Improvements are judged over weeks/months rather than day-to-day.
- A marathon runner focuses on cardiovascular endurance (Cooper 12-min run) and low body fat (skin fold/BMI) to maintain pace for long durations.
- A sprinter works on speed and power: 50 m sprint for speed, vertical jump for explosive power; also uses strength training and 1RM estimates to increase force.
- A football midfielder trains aerobic endurance (Harvard Step Test/Cooper) and agility (Illinois agility test) to sustain play and change direction quickly.
- An elderly person focuses on balance (Stork balance test) and muscular endurance (sit-to-stand or timed sit-ups) to reduce fall risk and maintain independence.
- A gymnast emphasizes flexibility (Sit-and-Reach), balance (Stork), and coordination (plate-tapping or wall toss) to perform complex routines safely.
- BMI = weight (kg) / height (m)^2
- Harvard Step Test Fitness Index = (Duration of exercise in seconds × 100) / (2 × sum of heartbeats counted in recovery periods). Note: recovery heartbeats are usually taken in specified windows after exercise (e.g., 1st, 2nd and 3rd minute).
- Cooper Test VO2max estimate (12-minute run): VO2max (ml·kg^-1·min^-1) ≈ (distance in metres − 504.9) / 44.73
- 1RM Brzycki estimation: 1RM ≈ weight lifted / (1.0278 − 0.0278 × repetitions)
- Reaction time from ruler drop (physics-based): t = sqrt(2 × d / g), where d is drop distance in metres and g ≈ 9.81 m/s^2. (Convert d from cm to m by dividing by 100.)
- Peak leg power (Sayers equation for vertical jump): Power (W) ≈ 60.7 × jump height (cm) + 45.3 × body mass (kg) − 2055
Anthropometry and Body Composition
Overview
Anthropometry is the scientific measurement of the human body's physical dimensions and proportions (height, weight, circumferences, skinfold thicknesses, breadths). Body composition refers to how the body is partitioned into compartments — most commonly the two‑compartment model: fat mass (FM) and fat‑free mass (FFM, sometimes called lean body mass).
Why it matters
- Health screening: detect underweight, overweight, and fat distribution associated with disease risk.
- Sport and fitness: tailor training and nutrition to optimize lean mass and reduce excess fat.
- Growth & development: monitor children and adolescents.
Common anthropometric measures
- Height and weight (for BMI).
- Skinfold thickness (triceps, subscapular, suprailiac, abdomen, thigh, etc.) to estimate subcutaneous fat.
- Circumferences: waist, hip, mid‑upper arm, thigh.
- Breadths: biacromial, bicondylar widths (used in somatotyping and proportion analysis).
Body composition assessment methods (summary)
- Field/simple: BMI, circumferences, waist‑to‑hip ratio (WHR), waist‑to‑height ratio, skinfold equations.
- Laboratory/more accurate: hydrostatic (underwater) weighing, air displacement plethysmography (BOD POD), dual‑energy X‑ray absorptiometry (DXA), multi‑compartment models.
- Portable tech: bioelectrical impedance analysis (BIA) — convenient but affected by hydration.
Principles & interpretation
Two‑compartment model assumes body = fat mass + fat‑free mass. Many field methods estimate body density (Db) from skinfolds or underwater weighing, then convert Db to percent body fat (BF%). Distribution of fat (central vs peripheral) is important: central (abdominal) fat raises cardiometabolic risk.
Limitations
- BMI does not distinguish muscle from fat — muscular individuals can be classified overweight.
- Skinfold accuracy depends on technician skill and appropriate equations for age/sex/ethnicity.
- Hydration and recent activity affect BIA.
- Example 1 — BMI calculation: A 17‑year‑old student weighs 60 kg and is 1.70 m tall. BMI = 60 / (1.70)^2 = 20.76 kg/m^2 (Normal: 18.5–24.9).
- Example 2 — Waist‑to‑hip ratio (WHR): Waist = 85 cm, Hip = 100 cm → WHR = 85/100 = 0.85. For women WHR > 0.85 indicates higher health risk; for men WHR > 0.90 indicates higher risk.
- Example 3 — From body density to body fat (Siri): If body density measured = 1.05 g/cm^3, BF% (Siri) = (495 / 1.05) − 450 = 21.4%. If body weight = 70 kg → Fat mass = 0.214 × 70 = 15.0 kg; Fat‑free mass = 70 − 15 = 55 kg.
- Example 4 — Skinfold approach (conceptual): Sum of three male skinfolds (chest + abdomen + thigh) is used in a Jackson‑Pollock equation to estimate body density, then converted to BF% using Siri equation. (Exact numeric equation depends on age and chosen sites.)
- Body Mass Index (BMI) = weight (kg) / [height (m)]^2
- Waist‑to‑Hip Ratio (WHR) = waist circumference (cm) / hip circumference (cm)
- Waist‑to‑Height Ratio = waist (cm) / height (cm)
- Fat mass (kg) = body weight (kg) × (BF% / 100)
- Fat‑free mass (kg) = body weight (kg) − fat mass (kg)
- Siri equation (convert body density to BF%): BF% = (495 / Body density) − 450
Physiological and Health-related Measures
Definition: Physiological and health-related measures are objective assessments of the body's functioning and health status used in physical education, fitness testing and health evaluation. They monitor cardiovascular, respiratory, metabolic and body-composition variables that reflect fitness, risk factors and adaptation to training.
Why they matter: These measures help in (1) evaluating current health and fitness, (2) identifying risk factors (e.g., obesity, hypertension), (3) designing training and health programs, and (4) tracking progress and recovery.
Key components:
- Cardiovascular measures: resting heart rate (RHR), recovery heart rate, blood pressure, tests estimating aerobic capacity (VO2max) such as Cooper test and Harvard Step Test.
- Respiratory measures: vital capacity (VC), forced vital capacity (FVC) and peak expiratory flow — usually measured by spirometry.
- Body composition: body mass index (BMI), waist–hip ratio (WHR), skinfold measurements and percent body fat estimates.
- Muscular fitness: strength (handgrip dynamometer), muscular endurance (sit-ups/push-ups), flexibility (sit-and-reach).
- Metabolic measures: basal metabolic rate (BMR) / resting metabolic rate (RMR), and energy expenditure estimates.
Common measurement methods & brief protocols:
- Resting heart rate (RHR): measure radial or carotid pulse for 60 seconds after 5–10 min seated rest. Lower RHR generally indicates better cardiovascular fitness.
- Blood pressure: use sphygmomanometer or digital monitor; report systolic/diastolic in mmHg. Follow standard positioning and cuff size.
- BMI: calculated from weight and height — quick screening for underweight/overweight.
- Waist–Hip Ratio: measure waist at narrowest or above iliac crest and hips at widest; ratio indicates central adiposity risk.
- Harvard Step Test: step at standardized height and cadence for up to 5 minutes; record recovery pulse counts to compute fitness index.
- Cooper 12-minute run: measure distance run in 12 minutes; use distance to estimate VO2max.
- Spirometry: measure VC/FVC/FEV1 to evaluate lung function (requires calibrated device and trained operator).
- Skinfolds: use calipers at standardized sites; convert sums to body density and then to percent body fat (requires formulae).
Interpreting results (typical reference ranges):
- RHR: 60–100 bpm (adults); athletes often 40–60 bpm.
- Blood pressure: Normal <120/80 mmHg; elevated 120–129 <80; hypertension ≥130/80 (follow clinical guidelines).
- BMI categories: <18.5 underweight; 18.5–24.9 normal; 25–29.9 overweight; ≥30 obesity.
- VO2max: values vary by age/sex; higher is better (e.g., 35–45 ml/kg/min typical for active young adults).
Safety and standardization: Use calibrated instruments, allow rest before cardiovascular measures, use correct cuff sizes and body landmarks, and ensure tests are appropriate for the subject's health status. Obtain medical clearance for maximal tests if needed.
How these measures are used in school physical education: Screening, setting individualized goals, teaching about healthy ranges (BMI, BP), assessing progress from training units (improvements in RHR, recovery, VO2max estimates, flexibility), and promoting lifelong health habits.
- BMI calculation: Student weight = 60 kg, height = 1.65 m. BMI = 60 ÷ (1.65²) = 60 ÷ 2.7225 = 22.0 → Normal weight.
- Waist–Hip Ratio: Waist = 80 cm, Hip = 95 cm. WHR = 80 ÷ 95 = 0.842. Interpretation: below common risk cut-offs (male <0.90, female <0.85 borderline).
- Cooper 12-minute run → estimate VO2max: If a student runs 2400 m in 12 minutes, VO2max ≈ (distance (m) − 504.9) ÷ 44.73 = (2400 − 504.9) ÷ 44.73 ≈ 42.4 ml·kg⁻¹·min⁻¹ (good aerobic capacity for a young adult).
- Harvard Step Test example: Student steps for 5 min (300 s). Recovery pulse counts at 1–1.5–2 min = 80 + 76 + 72 = 228. Harvard Index = (100 × 300) ÷ (2 × 228) ≈ 65.8 (higher index indicates better cardiovascular fitness).
- BMI = weight (kg) ÷ [height (m)]²
- Waist–Hip Ratio (WHR) = waist circumference (cm) ÷ hip circumference (cm)
- Harvard Step Test Index = (100 × duration of exercise in seconds) ÷ (2 × sum of heart beats in recovery periods)
- Cooper test VO2max estimate (ml·kg⁻¹·min⁻¹) = (distance in meters − 504.9) ÷ 44.73
- Harris–Benedict BMR (male) = 66.5 + (13.75 × weight kg) + (5.003 × height cm) − (6.755 × age years)
- Harris–Benedict BMR (female) = 655.1 + (9.563 × weight kg) + (1.850 × height cm) − (4.676 × age years)
Test Administration and Protocols
Overview: Test administration and protocols describe the standardized steps and rules followed when conducting physical fitness and skill tests. Proper administration ensures safety, reliability (consistency), validity (measuring what is intended), fairness and accurate recording.
Before the test:
- Plan: select valid tests, gather equipment, assign roles (timer, measurer, recorder).
- Environment: ensure appropriate surface, lighting, temperature and minimal distractions.
- Equipment check: calibrate timers, measure tapes, scales and ensure measuring cones, mats and stopwatches are in working order.
- Participant preparation: obtain consent, check medical clearance, explain purpose, provide written and verbal instructions, ensure correct clothing/footwear and a proper warm-up.
- Standardization: use identical instructions, demonstration and practice trials for every participant to reduce bias.
During the test:
- Give the same clear instructions and demonstration to each participant or group.
- Allow one or two practice attempts if protocol permits.
- Follow a fixed order (e.g., non-fatiguing to fatiguing tests) or known standard order to control test interference.
- Use consistent timing methods (digital stopwatch or photocells) and the same measurer when possible.
- Record results immediately on a prepared sheet; note any irregularities (false starts, weather, injuries).
After the test:
- Cool-down and attend to participant welfare.
- Double-check and sign recorded scores, enter data securely, protect confidentiality.
- Compare with norms/standards and provide feedback. If needed, repeat tests only according to predefined retest rules.
Safety and ethical considerations: medical screening, emergency plan, avoid coercion, respect privacy of results, and provide appropriate physical rest between tests to prevent injury.
Quality control (validity & reliability): ensure test measures intended ability (validity) and yields consistent results across occasions and testers (reliability). Control sources of error: tester bias, environment, equipment faults, participant condition and inconsistent instructions.
Common procedural elements to write in a test protocol:
- Test name, objective and equipment list.
- Exact instructions to give, demonstration steps and number of practice trials.
- Scoring rules and units (seconds, cm, repetitions).
- Rest intervals between trials and between different tests.
- Pass/fail or normative cut-offs and recording template.
Tips for teachers/administrators: rehearse the testing session, create printed sheets and checklists, brief assistants, keep warm-up and rest strict, use electronic timing when possible, and run pilot tests to check timing and logistics.
- 50 m dash at school sports day: Prepare track, mark start and finish, explain 'ready-set-go' commands, allow one practice start, use two timers or electronic sensor, record best time to nearest 0.01 s and note false starts. Ensure participants have warmed up and space to cool down.
- Sit-and-reach flexibility test: Place sit-and-reach box, demonstrate technique (knees extended, reach forward slowly), allow one practice trial, measure to nearest 0.5 cm. Use same box and ruler for all students and record best of two trials.
- Harvard Step Test (cardiorespiratory fitness): Set step height, metronome at set cadence (30 steps/min), explain stepping pattern, monitor participant and record recovery pulse at specified intervals. Have first aid ready and stop test if symptoms occur.
- Anthropometric measurements: Measure height with stadiometer (no shoes), weight with calibrated scale, calculate BMI. Ensure same equipment and clothing protocol for all students and record values immediately.
- Percentage score = (Obtained score / Maximum possible score) × 100
- Mean (average) = (Σx) / n — where Σx is the sum of scores and n is number of participants
- Sample standard deviation (s) = sqrt( Σ(x - x̄)² / (n - 1) )
- Z-score (standard score) = (X - mean) / standard deviation — useful to compare different tests
- BMI = weight (kg) / [height (m)]²
- Pearson correlation (reliability indicator) r = covariance(x,y) / (SDx × SDy) — used to estimate test–retest reliability
Specific Test Protocols (Practical Examples)
Overview
Specific test protocols are standardized, repeatable procedures used to measure particular physical-fitness components (cardiorespiratory endurance, muscular strength/endurance, speed, agility, flexibility, body composition, balance, coordination and reaction time). A good protocol specifies purpose, equipment, setup, step-by-step procedure, what to record, units, safety notes and norms.
Why protocols matter
- Ensure reliability and validity of measurement.
- Allow comparison across time (pre/post) and between individuals/groups.
- Reduce measurement error by standardizing instructions, environment and scoring.
Common practical protocols (concise, step-by-step)
- Harvard Step Test (Cardiorespiratory endurance)
- Equipment: bench/step (men 50 cm, women 40 cm or use a common school height), metronome (30 steps/min), stopwatch.
- Procedure: Step up and down at 30 steps/min for 5 minutes (or until exhaustion). Immediately sit and record pulse counts for 1–1.5 min, 2–2.5 min and 3–3.5 min (three 30‑second counts) or use beats for 1st, 2nd and 3rd minute after exercise per local variant.
- Score: Fitness Index = (100 × test duration in seconds) / (2 × sum of three recovery pulse counts).
- Safety: Stop if dizziness, chest pain or severe breathlessness occurs.
- Cooper 12‑Minute Run/Walk (Endurance & VO2max estimate)
- Equipment: measured track (400 m), stopwatch, markers.
- Procedure: Run or walk as far as possible in 12 minutes. Record distance in meters.
- Score/Estimate: Use VO2max formula: VO2max ≈ (distance(m) − 504.9) / 44.73 (ml·kg−1·min−1).
- 50‑m Dash (Speed)
- Equipment: marked 50 m straight course, stopwatch or timing gates.
- Procedure: From standing start, sprint maximally for 50 m. Record time to nearest 0.1 s.
- Score: Speed = distance / time (m·s−1) or compare time against norms.
- 4 × 10 m Shuttle Run (Agility)
- Equipment: two parallel lines 10 m apart, stopwatch or timing gates, cones.
- Procedure: Run 10 m to line A, back to B, back to A and finish at B (total 40 m with turns). Record total time.
- Sit‑and‑Reach Test (Flexibility)
- Equipment: sit-and‑reach box or ruler on floor, shoes off.
- Procedure: Sit with legs straight against the box, slowly reach forward with both hands, hold maximum reach for 2 seconds. Measure distance reached beyond toes (cm) or short of toes as negative value.
- One‑Minute Sit‑Up / Push‑Up Test (Muscular endurance)
- Equipment: stopwatch, mat.
- Procedure: Count maximum correct sit-ups or push-ups in one minute (maintain technique). Record number.
- Handgrip Strength (Static strength)
- Equipment: handgrip dynamometer.
- Procedure: Standing, arm by side, squeeze maximally for ~3 seconds. Take best of three trials for each hand. Record kg or newtons.
- Optional index: Relative handgrip (%) = (best grip kg / body mass kg) × 100.
- Ruler Drop Test (Reaction time)
- Equipment: 30 cm ruler marked in cm.
- Procedure: Subject catches a dropped ruler between thumb and index finger; distance fallen indicates reaction time. Convert distance to reaction time using t = sqrt(2d/g) if desired.
- BMI (Body composition indicator)
- Equipment: weighing scale, stadiometer (height).
- Procedure: Measure weight (kg) and height (m); compute BMI = weight / height².
Worked mini-examples
- Harvard Step Test: test duration = 300 s (completed 5 min), recovery pulses (30 s each) = 40 + 50 + 60 = 150. Fitness Index = (100 × 300) / (2 × 150) = 100 (interpret using norms: e.g., >90 = excellent/good depending on chart).
- Cooper Test: distance = 2400 m. VO2max ≈ (2400 − 504.9) / 44.73 ≈ 42.4 ml·kg−1·min−1.
- BMI: weight 60 kg, height 1.65 m → BMI = 60 / (1.65²) = 22.04 kg·m−2 (normal range 18.5–24.9).
Practical tips for teachers and students
- Always warm up and brief participants on technique and safety before testing.
- Use the same time of day, footwear and surface to reduce variability in repeated tests.
- Record environmental conditions (temperature, wind) for outdoor tests.
- Prefer objective timing (electronic gates) when available; otherwise use trained timers and repeat trials.
- Compare results to age‑ and sex‑appropriate norms and use percentiles or fitness categories for interpretation.
Limitations: Some tests estimate (not directly measure) physiological variables (e.g., VO2max from Cooper). Skill, motivation and test familiarity affect results. Complement single tests with a battery for a holistic profile.
- Harvard Step Test — step at 30 steps/min for up to 5 min; measure recovery pulses and compute Fitness Index.
- Cooper 12‑Minute Run — run maximum distance in 12 min on a measured track; estimate VO2max from distance.
- 4 × 10 m Shuttle Run — measure agility and quick changes of direction; record time for four lengths.
- 50‑m Dash — measure straight‑line speed from standing start; use stopwatch or timing gates.
- Sit‑and‑Reach — assess hamstring and lower‑back flexibility; measure cm reached beyond toes.
- One‑Minute Sit‑Ups/Push‑Ups — count maximal correct repetitions in 60 seconds to assess muscular endurance.
- BMI = weight (kg) / [height (m)]²
- Harvard Step Fitness Index = (100 × test duration in seconds) / (2 × sum of three 30‑second recovery pulse counts)
- Cooper VO2max estimate (12 min) ≈ (distance (m) − 504.9) / 44.73 (ml·kg⁻¹·min⁻¹)
- Speed = distance (m) / time (s) (m·s⁻¹)
- Relative handgrip (%) = (handgrip (kg) / body mass (kg)) × 100
- Reaction time (s) from drop distance d (m): t = sqrt(2·d / g) where g ≈ 9.81 m·s⁻² (optional conversion)
Scoring, Norms and Interpretation
Overview
Scoring, norms and interpretation are the steps that convert raw test results into meaningful information about a student’s physical fitness or skill level. Scoring is assigning numbers to observed performances. Norms provide reference values to compare an individual's score with a group or standard. Interpretation uses scores and norms to make judgments — e.g., grading, diagnosing strengths/weaknesses, setting goals.
Scoring
Scoring can be raw (time, distance, count), converted (percentages, weighted scores), or standardized (z-scores, T-scores, stanines). Raw scores are the basic measurements (for example 12.3 s for 100 m). Converted scores put all tests on a common scale (percentages or 0–100). Weighted scores are used when different tests contribute unequally to a composite score.
Norms
Norms are reference points derived from a sample. Types:
- Percentile norms — indicate the percent of people scoring below a given score (e.g., 85th percentile).
- Mean and standard deviation based norms — describe distribution (e.g., average VO2 max ± SD).
- Stanine and standard-score norms — compress distribution into small scales (stanine 1–9, z-scores, T-scores).
- Criterion-referenced norms — compare to predefined standards (e.g., minimum flexibility needed to perform a skill).
Interpretation
Use norms to interpret an individual's standing: relative standing (how they compare with peers) and absolute standing (whether they meet a standard). Interpretation steps: check raw score → convert/standardize if needed → locate on norm table or distribution → draw inferences (grade, readiness, improvement needs). Consider test reliability and context (age, sex, environment).
Practical considerations
Always report the test used, units, sample used to create norms (age, sex, population), and any conversions. Use graphical displays to show distribution and cutoffs. Beware of ceiling/floor effects and cultural/ regional differences in norms.
- 100 m sprint in a class: Raw times (s) for 30 students. Student A runs 12.3 s. Class mean = 13.0 s, SD = 0.8 s. z-score = (12.3 - 13.0) / 0.8 = -0.875 (below mean). Convert to percentile ≈ 19.1% (Student A is faster than about 19% of classmates) — here lower raw time is better, so interpret sign accordingly.
- Sit-and-reach flexibility: Raw score 25 cm. If the criterion standard for 'good' is ≥ 24 cm, then student meets criterion-referenced norm (pass). If percentile norms show 25 cm = 60th percentile, student is above average in the reference group.
- Composite fitness score: Tests — Run (weight 40%), Push-ups (30%), Sit-ups (30%). Raw converted to percentage: Run 85%, Push-ups 70%, Sit-ups 80%. Weighted score = 0.4*85 + 0.3*70 + 0.3*80 = 34 + 21 + 24 = 79% (overall performance).
- Converting to T-score: Student’s raw test X = 50, population mean μ = 40, SD σ = 6. z = (50 - 40)/6 = 1.667. T = 50 + 10*z = 66.67. This standardized score makes comparison across tests easy.
- Percentage score = (Obtained raw score / Maximum possible raw score) × 100
- Weighted composite = Σ (component score × weight) — e.g., 0.4*run% + 0.3*push-ups% + 0.3*sit-ups%
- z-score = (X - μ) / σ — X is individual raw score, μ is sample mean, σ is sample standard deviation
- T-score = 50 + 10 × z — rescales z to mean 50, SD 10
- Percentile rank (approx.) = [(Number of scores below X) + 0.5*(Number of scores equal to X)] / N × 100
- Min–max normalization (to 0–100) = (X - Xmin) / (Xmax - Xmin) × 100
Statistical Techniques for Evaluation
Purpose: Statistical techniques convert raw measurement data (e.g., sprint times, fitness test scores, body measurements) into meaningful information for evaluation, comparison and decision‑making in Physical Education. They help summarize central tendency, measure variation, standardize scores and examine relationships among variables.
Typical steps: collect data → arrange into a frequency distribution → display graphically → compute summary statistics (central tendency & dispersion) → standardize/compare → interpret.
Key techniques and what they tell you
- Frequency distribution: Groups raw scores into classes and frequencies so patterns (e.g., clustering, gaps) become visible.
- Measures of central tendency: Mean (average) — typical performance; Median — middle score (robust to outliers); Mode — most frequent score.
- Measures of dispersion: Range — spread between highest and lowest; Quartile deviation/Interquartile range — spread of middle 50% (robust); Variance & Standard deviation — average spread of scores around the mean (useful for comparing consistency).
- Standard scores (Z‑scores, T‑scores): Convert raw scores to units of standard deviation so scores from different tests are comparable and you can identify how many SDs above/below the mean a student is.
- Percentiles and quartiles: Rank students relative to peers (e.g., 75th percentile = better than 75% of peers).
- Correlation: Measures linear association between two variables (e.g., practice hours and performance). Pearson's r shows strength and direction; scatter plots and regression lines visualize it.
- Interpretation: Use mean + SD to set norms/standards, percentiles for grading/ranking, and correlation to understand relationships for training planning.
Practical considerations: Always check data type (continuous vs categorical) before choosing methods. For small samples use sample formulas (n−1 in variance). Use grouped formulas for classed frequency data. Watch for outliers which can distort the mean and SD — use median or IQR when needed.
- Evaluating 100m sprint times of a class: compute mean sprint time to know typical speed, SD to see consistency, and a histogram to view distribution (are most clustered or spread out?).
- Comparing fitness test scores before and after a 6‑week training program: compute mean improvement, use paired t‑test or percent change, and line graphs to show progress for each student.
- Standardizing scores from different tests (e.g., shuttle run and long jump) with Z‑scores so you can compare which students performed relatively better across tests.
- Using percentiles to classify students: those above the 85th percentile considered 'excellent', between 50–85th 'good', below 25th 'needs improvement'.
- Investigating relationship between weekly practice hours and performance score using a scatter plot and Pearson correlation; a strong positive r suggests more practice is associated with better performance.
- Arithmetic mean (ungrouped): x̄ = (Σx) / n
- Median (grouped data): Median = L + [(N/2 − cf) / f] × h (L = lower boundary of median class, cf = cumulative frequency before median class, f = frequency of median class, h = class width)
- Mode (grouped data): Mode = L + [(f1 − f0) / (2f1 − f0 − f2)] × h (f1 = frequency of modal class, f0 = previous class freq, f2 = next class freq)
- Range = Maximum − Minimum
- Quartile Deviation (QD) = (Q3 − Q1) / 2
- Percentile position (for ungrouped): Pth percentile position = (P/100) × (n + 1)
Reliability, Validity and Objectivity (Detailed)
Introduction
In Test, Measurement and Evaluation, three psychometric qualities are essential for any test: Reliability, Validity and Objectivity. They determine whether a test is consistent, measures what it is supposed to measure, and produces unbiased scores.
1. Reliability
Definition: Reliability is the degree to which a test yields consistent, stable and reproducible results under consistent conditions.
Key types of reliability
- Test–retest reliability: Stability of scores when the same test is administered to the same group on two different occasions.
- Inter-rater (or inter-observer) reliability: Agreement between different raters/observers scoring the same performance.
- Parallel (alternate) forms reliability: Consistency between two different but equivalent versions of a test.
- Internal consistency: Extent to which items within a test measure the same construct (e.g., Cronbach’s alpha).
How to improve reliability
- Use standardized procedures and written protocols.
- Give clear instructions and training to testers/raters.
- Use well-calibrated, dependable instruments.
- Increase the number of items or trials (when appropriate).
- Ensure testing conditions are similar (time of day, environment).
2. Validity
Definition: Validity is the extent to which a test actually measures what it claims to measure and the appropriateness of inferences drawn from test scores.
Types of validity
- Face validity: On the surface, the test appears to measure the intended construct (subjective).
- Content validity: The test covers the full range of the construct (e.g., a fitness test battery includes endurance, strength, flexibility).
- Criterion-related validity: How well test scores relate to an external criterion. It includes:
- Concurrent validity — correlation with a criterion measured at the same time.
- Predictive validity — ability to predict future performance or outcomes.
- Construct validity: The extent the test measures the theoretical trait (often supported by factor analysis and patterns of correlations).
How to assess and improve validity
- Define the construct clearly and build items that represent it (improves content validity).
- Compare the test with a gold standard or criterion measure (assess criterion validity).
- Use subject-matter experts to review items and content.
- Use statistical techniques (correlation, factor analysis) to examine relationships among items and tests.
3. Objectivity
Definition: Objectivity refers to the extent to which test scores are independent of the scorer’s personal bias, opinions or subjective judgments.
Ways to achieve objectivity
- Provide detailed scoring rubrics and objective criteria (e.g., timing, distances, counts).
- Use blind scoring where feasible (rater unaware of participant identity or prior score).
- Train raters and conduct inter-rater reliability checks.
- Use instruments and automated devices (timers, motion sensors) to reduce human error.
Relationships among the three
Validity depends on reliability: a test must be reliable to be valid, but a reliable test is not necessarily valid. Objectivity supports reliability and validity by reducing scorer-induced variance.
Practical thresholds (general guidance)
- Reliability coefficient (r): >0.9 is excellent, 0.8–0.9 good, 0.7–0.8 acceptable for group decisions; for high-stakes individual decisions prefer >0.9.
- Validity coefficients vary; higher correlations with criterion measures indicate stronger validity.
Summary
For effective measurement in physical education, design tests that are reliable (consistent), valid (measure the intended trait) and objective (free from scorer bias). Apply standardization, adequate item selection, expert review and statistical checks to ensure high-quality assessment.
- Test–retest reliability: A class takes a 1-mile run test on Monday and again the same group on the following Monday under the same conditions. A high correlation between the two times indicates good test–retest reliability.
- Inter-rater reliability & objectivity: Two coaches time a sprint with stopwatches. If their recorded times are consistently similar, inter-rater reliability is high. Using electronic timing gates increases objectivity and reduces rater bias.
- Parallel forms reliability: Two equivalent versions of a motor skills test (Form A and Form B) are given to the same students; similar results suggest good parallel-forms reliability.
- Content validity: A physical fitness test battery for school should include aerobic endurance, muscular strength, flexibility and body composition. If any domain is missing, content validity is reduced.
- Criterion-related validity: A field shuttle run (beep test) score correlates strongly with lab-measured VO2max; this shows concurrent validity of the shuttle run as a measure of aerobic fitness.
- Construct validity: A new agility test’s scores correlate with existing agility measures and do not correlate strongly with unrelated traits (e.g., math ability), supporting construct validity.
- Pearson correlation coefficient (r): r = [Σ(xi - x̄)(yi - ȳ)] / [√(Σ(xi - x̄)²) √(Σ(yi - ȳ)²)] — used for test–retest, criterion validity and parallel forms.
- Spearman–Brown prophecy formula (to estimate full test reliability from split-half): r_sb = (2 * r_half) / (1 + r_half)
- Cronbach's alpha (internal consistency, k items): alpha = (k / (k - 1)) * [1 - (Σ σ_i² / σ_total²)], where σ_i² is variance of item i and σ_total² is variance of total score.
- Percent agreement for inter-rater reliability: % agreement = (Number of agreements / Total observations) * 100
- Cohen's kappa (accounts for chance agreement): k = (P_o - P_e) / (1 - P_e), where P_o = observed agreement and P_e = expected agreement by chance.
- Validity coefficient (simple): validity ≈ correlation between test scores and criterion scores = r (same Pearson formula as above).
Factors Affecting Test Performance
Definition: Factors affecting test performance are the various physiological, psychological, environmental, administrative and test-design elements that influence an examinee’s score or performance on a physical education test.
Major categories and concise explanations:
- Examinee-related factors: physical fitness, strength, endurance, skill level and health status directly change capacity to perform. Psychological elements — motivation, anxiety, confidence and attention — affect effort and consistency. Fatigue, recent practice, nutrition and sleep also alter performance on the day of the test.
- Test-related factors: difficulty level, length, clarity of tasks and whether the test is valid (measures what it intends to) and reliable (gives consistent results) determine how well scores reflect true ability.
- Environmental factors: weather, temperature, humidity, surface (track or court), altitude, noise and lighting can improve or impair performance depending on the activity.
- Equipment and attire: footwear, sports equipment, measuring tools and clothing affect comfort, safety and mechanics (e.g., spikes on a wet track vs running shoes).
- Administrator/observer factors: instructions clarity, timing, encouragement, scorer bias and standardization of procedures influence outcomes and inter-rater reliability.
- Biological and demographic factors: age, sex, growth stage, genetic predisposition and prior injuries shape baseline abilities and expected norms.
- Statistical & scoring factors: scoring method (raw score, weighted score, percentile), standardization of norms and measurement error affect interpretation of results.
How these interact: Most influences act together. For example, poor sleep (examinee factor) plus cold weather (environment) and unclear instructions (administrator factor) can combine to lower an athlete’s test score. Good test design and standardized administration reduce extraneous variation so scores reflect true ability.
Practical implications for teachers/administrators: standardize instructions, use calibrated equipment, allow adequate warm-up, schedule tests at similar times, control environmental variables where possible, ensure subjects are fit and informed, and use reliable tests with clear scoring criteria.
- A 100 m sprinter who missed sleep the night before runs 0.5–1.0 s slower than usual — sleep (examinee factor) reduced reaction time and sprint power.
- Two classes take the beep test in different weather: Class A in cool, dry conditions and Class B on a wet, windy day; Class A records better VO2 estimates due to environment affecting running economy.
- A basketball shooting accuracy test shows higher scores when a coach provides consistent encouragement and clear instructions — administrator effect increasing motivation and reducing anxiety.
- Students tested without standardized footwear perform worse and more variably on vertical jump because footwear and surface change mechanical efficiency — equipment and environment influence.
- A novice and an experienced swimmer of same age show different times: skill level and prior practice (examinee factors) explain most of the difference, not just fitness.
- Percentage score = (Obtained score / Maximum possible score) × 100
- Mean (average) = Σx / n , where x are observed scores and n is the number of subjects
- Standard deviation (population) = sqrt[Σ(x - mean)² / n] (use n-1 for sample SD)
- Coefficient of Variation (CV) = (SD / Mean) × 100 — shows relative variability between groups
- Z-score = (X - mean) / SD — standardises an individual score relative to group distribution
- Pearson correlation (r) = Σ[(xi - x̄)(yi - ȳ)] / sqrt[Σ(xi - x̄)² × Σ(yi - ȳ)²] — measures relationship (e.g., anxiety vs performance)
Evaluation in Sports Context
Definition: Evaluation in sports is the process of judging the performance, progress and achievement of an athlete or team by interpreting data obtained through measurement and assessment. While measurement records numerical values (e.g., time, distance, score), evaluation interprets those values to make decisions (e.g., selection, grading, training adjustment).
Purpose of Evaluation
- Placement (selecting teams or levels)
- Diagnosing strengths and weaknesses for training planning
- Monitoring progress (formative evaluation)
- Assessing final achievement (summative evaluation)
- Motivation and feedback for athletes
Types of Evaluation
- Formative: Ongoing checks during practice or season to adjust training (e.g., weekly fitness tests).
- Summative: End-of-term or tournament evaluation (e.g., final skill assessment).
- Diagnostic: Identifies specific weaknesses to target (e.g., imbalance in muscle strength).
- Placement/Selection: Choosing squads or levels based on test results.
Evaluation Domains
- Psychomotor (skills, speed, strength)
- Cognitive (tactics, rules knowledge)
- Affective (attitude, teamwork, discipline)
Qualities of a Good Evaluation
- Validity: Measures what it is intended to measure (e.g., a sprint test for speed).
- Reliability: Produces stable, consistent results over repeated trials.
- Objectivity: Minimizes scorer bias (clear criteria, standard procedures).
- Practicality: Feasible in terms of time, cost and resources.
- Sensitivity: Able to detect small but important changes.
Principles and Process
- Define objectives of evaluation (what you want to judge).
- Select appropriate tests and tools (ensure validity and reliability).
- Standardize administration (same instructions, warm-up, environment).
- Record measurements accurately.
- Interpret using norms, criteria or standards (criterion-referenced or norm-referenced).
- Provide constructive feedback and use results to plan training.
Interpretation Approaches
- Criterion-referenced: Compare athlete to a fixed standard (e.g., minimum fitness needed for selection).
- Norm-referenced: Compare athlete to peers (e.g., percentile rank in a group).
Note on Fairness: Use age- and sex-specific norms where appropriate; ensure tests are sport-specific and culturally appropriate.
- Selection trial: Using a beep test (multi-stage shuttle run) to choose members for a football team by comparing aerobic endurance scores against selection cutoffs.
- Formative evaluation: Measuring a sprinter's 100 m time monthly; if times plateau, altering strength or technique training based on results.
- Diagnostic evaluation: Assessing shoulder strength and range of motion after a swimmer reports pain to identify specific weaknesses for rehabilitation.
- Summative evaluation: End-of-season skill rubric for gymnastics where judges score routines against defined criteria to assign final grades.
- Monitoring progress: Pre-test and post-test push-up count across a 6-week strength program; calculating percent improvement to judge program effectiveness.
- Percentage score = (Obtained score / Total possible score) × 100
- Percent improvement = ((Post-test value − Pre-test value) / Pre-test value) × 100
- Mean (average) = Σx / n (sum of all scores divided by number of scores)
- Standard deviation (sample) = sqrt[ Σ(x − mean)² / (n − 1) ] — measures spread of scores
- Z-score = (X − mean) / SD — shows how many standard deviations a score X is from the mean
- Percentile rank (approx.) = [(Number of scores below X) + 0.5] / n × 100 — position of a score in the group
Record Keeping, Reporting and Feedback
Definition & purpose: Record keeping is the systematic collection, organization and storage of test scores, measurements, attendance, health data and observational notes related to physical education. Reporting is the process of presenting these records in a clear form to students, parents, teachers and administrators. Feedback is the information given to learners (or coaches) about their performance to reinforce strengths, correct errors, and guide future training.
Why it matters:
- Tracks progress over time and shows trends.
- Helps in planning training programmes and interventions.
- Informs grading, selection and promotion decisions objectively.
- Supports health and safety monitoring (injury, BMI, BP).
- Provides motivation through evidence of improvement.
What to record:
- Personal data: name, age, sex, height, weight, medical history.
- Performance data: test scores (e.g. 100 m time, sit-ups), practice logs, competition results.
- Fitness/health measures: BMI, resting heart rate, blood pressure, flexibility measures.
- Attendance and participation.
- Observational notes: technique, behaviour, effort, injuries.
How to keep records (methods & formats):
- Manual registers and mark-sheets (tables, scorecards).
- Spreadsheets (Excel/Google Sheets) for calculations and graphs.
- Dedicated software/apps or school MIS for long-term tracking.
- Standardized forms for each test to ensure reliability.
Reporting—principles & types: Reports should be accurate, objective, clear, timely and confidential. Types include formative reports (ongoing feedback), summative reports (term/annual result), progress reports, and health reports. Reports can be numerical (scores, percentiles), descriptive (strengths/areas to improve) or combined.
Feedback—characteristics & methods:
- Timely: immediate or soon after performance for best learning.
- Specific: point out what was done well and what to improve.
- Constructive and actionable: give steps or drills to fix errors.
- Balanced: combine positive reinforcement and corrective guidance (e.g., sandwich model).
- Types: verbal, written, video replay, peer feedback, self-assessment.
Models & examples of feedback: "Situation–Behavior–Impact (SBI)" — describe the situation, the observed behaviour, and its impact. "Pendleton’s rules" — encourage learner self-assessment before giving your views. Use rubrics/checklists for objective reporting.
Validity, reliability and ethics: Maintain standardized test conditions for reliability. Use valid tests that actually measure the intended ability. Protect confidentiality: share health or sensitive data only with authorised persons and obtain parental consent where necessary.
Using records to improve teaching & learning: Analyse trends (means, improvements, variability) to identify weak areas (e.g., low flexibility in a class). Use graphs and dashboards to visualise progress. Set SMART goals for students based on records and monitor them.
- Weekly 100 m sprint times recorded in a spreadsheet: coach plots each student’s times on a line graph to show improvement and sets target times for the next four weeks.
- Pre-term health screening: record height, weight and BP for all students; calculate BMI and flag students in underweight/overweight categories to inform parents and provide advice.
- Fitness battery results (50 m dash, sit-ups, shuttle run) entered into a class mark-sheet; teacher computes class average, SD and gives written feedback on each student’s report card.
- A coach videotapes a long jump attempt, annotates technique errors and sends short clips with corrective cues as feedback to the athlete.
- Teacher uses a rubric to report skill competency (e.g., passing, receiving in football) with levels: beginner, developing, competent, excellent; discussed in parent-teacher meeting.
- Mean (average) = (Σx) / n ; use to find average score of a test.
- Standard deviation (population) σ = sqrt( Σ(x - μ)² / n ) ; measures spread of scores.
- Percent change (improvement) = ((New value - Old value) / Old value) × 100%.
- BMI = weight (kg) / (height (m))² ; quick health screening index.
- Z-score = (individual score - mean) / SD ; shows how many SDs a score is from the mean.
- Percentile rank ≈ ((number of scores below + 0.5) / n) × 100 ; positions a student within the group.
Ethical, Legal and Safety Considerations
Ethical, legal and safety considerations are essential when planning, conducting and reporting tests, measurements and evaluations in Physical Education. These considerations protect participants' health, dignity and rights, ensure fairness and validity of results, and reduce legal risk for teachers and institutions.
- Ethical principles
- Respect for persons: treat every participant with dignity, obtain informed consent (and parental consent for minors) and allow voluntary withdrawal.
- Confidentiality & privacy: keep test results secure and share them only with authorized people; present group data anonymously when possible.
- Fairness & non-discrimination: apply the same procedures, instructions and conditions to all examinees; avoid biased or discriminatory selection and interpretation of results.
- Integrity: report results honestly, avoid manipulating data, and use valid, reliable tests appropriate to age and ability.
- Legal considerations
- Duty of care and negligence: staff must provide reasonable supervision, safe facilities and qualified instruction; failure that causes harm can lead to legal liability.
- Informed consent & parental permission: obtain documented consent for tests that carry risk or collect sensitive health information.
- Mandatory reporting & child protection: follow laws and school policies for reporting abuse or serious health concerns discovered during testing.
- Record-keeping & data protection: maintain accurate records and comply with data protection laws/policies for storage and sharing of health and performance data.
- Safety considerations
- Pre-participation screening: use PAR-Q or health questionnaires to identify risks and seek medical clearance when required.
- Environment & equipment safety: ensure surfaces, apparatus and protective equipment are appropriate and maintained; check weather for outdoor tests.
- Progressive overload & appropriateness: choose age- and development-appropriate tests and progressively increase intensity to avoid injury.
- Warm-up, cool-down & technique: include proper warm-up and teach correct technique to reduce strains and overuse injuries.
- Emergency planning: have first-aid trained staff, emergency action plan, first-aid kit, and access to medical help (CPR/AED procedures known).
- Applying these to assessment practice
- Standardization: keep testing conditions (time of day, instructions, equipment) consistent so results are valid and comparable.
- Data use & interpretation: use normative data appropriate for age/sex/culture, avoid overgeneralization and communicate results clearly with recommendations.
- Safeguarding vulnerable students: adapt tests for students with disabilities and obtain specialist advice when needed.
- Consequences of ignoring considerations
- Physical: injury, worsening health conditions.
- Ethical/legal: breach of trust, complaints, legal action, loss of reputation.
- Psychological: embarrassment, stigma, reduced participation.
In sum, designing and running PE assessments requires planning for consent, confidentiality, fairness, safe procedures and clear emergency protocols so measurement and evaluation contribute positively to students' health and learning.
- Before a school fitness test, the teacher circulates a PAR‑Q and gets parental consent for students under 18; any student answering ‘yes’ is referred for medical clearance.
- A coach stores students' test scores in a password‑protected file and shares individual results only with the student and their parents, not in front of the class.
- During a shuttle run, equipment is found to be unsafe; the test is postponed until the surface is repaired to avoid injuries and potential liability.
- A PE teacher adapts a strength test for a student with a physical impairment (alternate task) and records the adjusted protocol to ensure fairness and valid comparison.
- A student faints during a long‑distance run; staff follow the emergency action plan, give first aid, call for medical help and notify parents—demonstrating duty of care.
- A school investigates suspected use of performance‑enhancing substances after sudden, unexplained performance improvements and follows anti‑doping policies.
- Body Mass Index (BMI) = weight (kg) / [height (m)]² — quick screening for underweight/overweight.
- Maximum Heart Rate (HRmax) ≈ 220 − age (years) — used to estimate safe exercise intensities.
- Karvonen (Target Heart Rate) = [(HRmax − HRrest) × desired intensity (%) ] + HRrest — for individualized training zones.
- Cooper Test VO2max estimate (12‑minute run) ≈ (distance in metres − 504.9) / 44.73 — approximate aerobic capacity.
- Mean (average) = Σxᵢ / n — central tendency of test scores.
- Percentile rank = (number of scores below the score / total number of scores) × 100 — position relative to peers.
Key Concepts
- Test
- A systematic procedure to assess a specific skill, ability or trait using tasks and scoring rules.
- Measurement
- The process of assigning numbers or labels to observed performance according to specific rules.
- Evaluation
- Judging the value or worth of a performance based on measurements and criteria to make decisions.
- Assessment
- A broader term that includes measurement and evaluation; gathering information to understand learning or performance.
- Reliability
- The consistency or repeatability of test scores over repeated administrations or different raters.
- Validity
- The extent to which a test measures what it is intended to measure.
- Objectivity
- Degree to which test results are independent of the scorer's personal bias or judgement.
- Standardization
- Administering and scoring a test uniformly so results are comparable across individuals and times.
- Norms
- Reference data derived from a representative group used to interpret an individual's test score.
- Criterion-referenced test
- A test interpreted against a fixed standard or criterion indicating a level of performance.
- Norm-referenced test
- A test interpreted by comparing an individual's performance to that of a peer group.
- Formative evaluation
- Ongoing assessment during instruction to provide feedback and guide improvement.
- Summative evaluation
- Assessment at the end of a course or period to judge overall achievement or performance.
- Measurement error
- The difference between an observed score and the true score due to random or systematic factors.
- Raw score
- The unadjusted, direct result from a test before transformations like scaling or norming.
- Percentile rank
- The percentage of scores in a reference group that a given score equals or exceeds.
- Mean
- The arithmetic average of a set of scores, found by summing scores and dividing by the number of scores.
- Standard deviation
- A measure of how spread out scores are around the mean; larger values indicate more variability.
- Test battery
- A set of related tests combined to assess multiple components of fitness or skills.
- Discrimination index
- An item-analysis statistic showing how well a test item distinguishes between high and low performers.
End-of-Chapter Trial Paper & Test Questions
Topic-wise questions to test your understanding of every concept in this chapter.
-
Distinguish between test, measurement and evaluation with a single sporting example. / एक ही खेल उदाहरण द्वारा परीक्षण (test), मापन (measurement) और मूल्यांकन (evaluation) में अंतर कीजिए।
Show answer
Test is the tool/procedure (e.g., a 50 m sprint to test speed), measurement is assigning numbers to the result (e.g., time in seconds), and evaluation is interpreting the data to judge performance (e.g., comparing the time against class norms to rate speed). / परीक्षण उपकरण/प्रक्रिया है (जैसे गति मापने हेतु 50 मीटर दौड़), मापन परिणाम को संख्या देना है (जैसे सेकंड में समय), और मूल्यांकन डेटा की व्याख्या कर प्रदर्शन का निर्णय करना है (जैसे समय की कक्षा के मानकों से तुलना कर गति आँकना)।
-
Define validity and reliability of a test, and explain why validity is considered more important. / किसी परीक्षण की वैधता (validity) और विश्वसनीयता (reliability) को परिभाषित कीजिए, और बताइए वैधता को अधिक महत्वपूर्ण क्यों माना जाता है।
Show answer
Validity is the degree to which a test measures what it claims to measure; reliability is the consistency of results over repeated trials. Validity is more important because a test that is not valid is useless even if reliable, while reliability is necessary but not sufficient for valid interpretation. / वैधता वह सीमा है जिस तक परीक्षण वही मापता है जो वह दावा करता है; विश्वसनीयता बार-बार के प्रयासों में परिणामों की संगति है। वैधता अधिक महत्वपूर्ण है क्योंकि जो परीक्षण वैध नहीं है वह विश्वसनीय होने पर भी बेकार है, जबकि विश्वसनीयता वैध व्याख्या के लिए आवश्यक तो है पर पर्याप्त नहीं।
-
Differentiate between norm-referenced and criterion-referenced evaluation. / मानक-संदर्भित (norm-referenced) और मानदंड-संदर्भित (criterion-referenced) मूल्यांकन में अंतर कीजिए।
Show answer
Norm-referenced evaluation compares an individual's score with those of a peer group (e.g., percentile rank among classmates), whereas criterion-referenced evaluation compares the score against a fixed standard or benchmark (e.g., reaching a set sit-and-reach distance). / मानक-संदर्भित मूल्यांकन व्यक्ति के अंक की उसके सहपाठी समूह से तुलना करता है (जैसे कक्षा में प्रतिशतक रैंक), जबकि मानदंड-संदर्भित मूल्यांकन अंक की एक निश्चित मानक या बेंचमार्क से तुलना करता है (जैसे निर्धारित सिट-एंड-रीच दूरी प्राप्त करना)।
-
Name the four levels of measurement and state which arithmetic operations are valid for the ratio scale. / मापन के चार स्तरों के नाम बताइए और बताइए अनुपात (ratio) स्केल के लिए कौन-सी अंकगणितीय संक्रियाएँ मान्य हैं।
Show answer
The four levels are nominal, ordinal, interval and ratio. The ratio scale has equal intervals and a true zero, so all arithmetic operations and meaningful ratios are valid (e.g., one athlete can be twice as heavy as another). / चार स्तर हैं: नामिक (nominal), क्रमिक (ordinal), अंतराल (interval) और अनुपात (ratio)। अनुपात स्केल में समान अंतराल और वास्तविक शून्य होता है, अतः सभी अंकगणितीय संक्रियाएँ और सार्थक अनुपात मान्य हैं (जैसे एक खिलाड़ी दूसरे से दोगुना भारी हो सकता है)।
-
Calculate the mean and sample standard deviation of the scores: 4, 6, 8, 10, 12. / अंकों 4, 6, 8, 10, 12 का माध्य और प्रतिदर्श मानक विचलन ज्ञात कीजिए।
Show answer
Mean = (4+6+8+10+12)/5 = 40/5 = 8. Deviations squared: (−4)²+(−2)²+0²+2²+4² = 16+4+0+4+16 = 40. Sample SD = √(40/(5−1)) = √10 ≈ 3.16. / माध्य = (4+6+8+10+12)/5 = 40/5 = 8। विचलनों के वर्ग: (−4)²+(−2)²+0²+2²+4² = 16+4+0+4+16 = 40। प्रतिदर्श मानक विचलन = √(40/(5−1)) = √10 ≈ 3.16।
-
A student runs 2400 m in the Cooper 12-minute run. Estimate VO2max. / एक विद्यार्थी कूपर 12-मिनट दौड़ में 2400 मीटर दौड़ता है। VO2max का अनुमान लगाइए।
Show answer
VO2max ≈ (distance in metres − 504.9) / 44.73 = (2400 − 504.9) / 44.73 = 1895.1 / 44.73 ≈ 42.4 ml·kg⁻¹·min⁻¹, indicating good aerobic capacity for a young adult. / VO2max ≈ (मीटर में दूरी − 504.9) / 44.73 = (2400 − 504.9) / 44.73 = 1895.1 / 44.73 ≈ 42.4 मिली·किग्रा⁻¹·मिनट⁻¹, जो एक युवा वयस्क के लिए अच्छी वायवीय क्षमता दर्शाता है।
-
Name any four health-related and two skill-related components of physical fitness with one test each for two of them. / शारीरिक स्वस्थता के कोई चार स्वास्थ्य-संबंधी और दो कौशल-संबंधी घटक बताइए तथा इनमें से दो के लिए एक-एक परीक्षण भी लिखिए।
Show answer
Health-related: cardiovascular endurance (Cooper 12-min run), muscular strength (handgrip dynamometer), muscular endurance, flexibility, body composition. Skill-related: speed and agility (e.g., 50 m sprint for speed, shuttle run for agility). / स्वास्थ्य-संबंधी: हृदय-संवहन सहनशक्ति (कूपर 12-मिनट दौड़), मांसपेशीय शक्ति (हैंडग्रिप डायनामोमीटर), मांसपेशीय सहनशक्ति, लचीलापन, शारीरिक संरचना। कौशल-संबंधी: गति और चपलता (जैसे गति हेतु 50 मीटर दौड़, चपलता हेतु शटल रन)।
-
Calculate the Harvard Step Test Fitness Index if test duration is 300 s and recovery pulse counts are 80, 76 and 72. / यदि परीक्षण अवधि 300 सेकंड है और रिकवरी नाड़ी गणनाएँ 80, 76 और 72 हैं, तो हार्वर्ड स्टेप टेस्ट फिटनेस सूचकांक ज्ञात कीजिए।
Show answer
Sum of recovery beats = 80 + 76 + 72 = 228. Fitness Index = (100 × duration) / (2 × sum of recovery beats) = (100 × 300) / (2 × 228) = 30000 / 456 ≈ 65.8 (a higher index indicates better cardiovascular fitness). / रिकवरी धड़कनों का योग = 80 + 76 + 72 = 228। फिटनेस सूचकांक = (100 × अवधि) / (2 × रिकवरी धड़कनों का योग) = (100 × 300) / (2 × 228) = 30000 / 456 ≈ 65.8 (अधिक सूचकांक बेहतर हृदय-संवहन स्वस्थता दर्शाता है)।