Overview
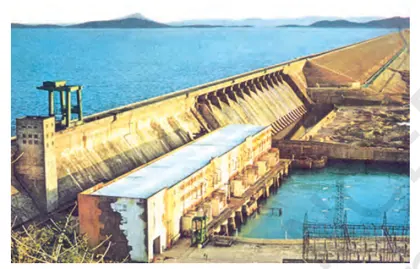
Introduction: This chapter examines India’s water resources — their distribution, uses, problems and management. It looks at surface and groundwater, major river systems and basins, multipurpose river projects, irrigation methods, and strategies for conservation and sustainable use. Importance: Water is central to agriculture, industry, power generation, ecosystems and domestic life. The chapter explains why equitable and efficient use of limited freshwater is vital for development, food security and ecological balance. Key themes: distribution and availability of freshwater, river basins and inter-state/international issues, groundwater and its depletion, types and impacts of irrigation and large dams, flood and drought management, water conservation practices (rainwater harvesting, watershed development), and policy/management approaches (community participation, integrated water resource management). What the student will learn: Students will understand where India’s water is found, how it is used, and why scarcity and pollution are growing concerns. They will learn about major water projects and their social–environmental impacts, compare irrigation methods, and evaluate…
Learning Objectives
- Define water resources and classify their major types (surface water, groundwater, and rainwater).
- Describe the distribution of water on Earth and explain the concept of freshwater availability and scarcity.
- Explain the formation, characteristics and economic importance of major river systems in India (Himalayan and Peninsular).
- Identify major methods of irrigation (flood, furrow, drip, sprinkler) and state their relative advantages and disadvantages.
- Compare traditional and modern irrigation techniques in terms of water-use efficiency and environmental impact.
- Analyze the causes and consequences of water scarcity, drought and groundwater depletion in different regions of India.
- Evaluate the role of large dams and multipurpose river projects in water resource management, citing both benefits and social/environmental costs.
- Illustrate how groundwater is recharged and explain the concept of the water table and problems of overexploitation and contamination.
Topics in this chapter
22 topics · tap a topic title to jump straight to it.
Introduction: Water as a Resource
What is water as a resource? Water is a vital natural resource essential for all life forms and for economic activities. Although Earth is a "water planet," usable freshwater is limited, unevenly distributed in space and time, and under growing pressure from population growth, pollution and overuse.
Why is water important? It is needed for drinking and domestic use, irrigation and food production, industry and energy generation, ecosystems and biodiversity, and cultural and recreational purposes.
Distribution of Earth's water
- About 97% of Earth's water is saline (oceans).
- Only about 3% is freshwater. Of that freshwater, the vast majority is locked in glaciers and ice caps (about two thirds), a large share is groundwater (roughly one third of freshwater), and a very small fraction (<1%) is surface water (rivers, lakes, wetlands) that is directly available for use.
Key characteristics
- Renewable but limited: Water is renewed via the hydrological cycle (evaporation, condensation, precipitation), but the renewability is constrained by climate and seasonal patterns.
- Uneven distribution: Some regions and seasons receive abundant water (e.g., river basins with heavy rainfall), while others face scarcity (arid and semi-arid regions or during dry seasons).
- Seasonality: Monsoons and wet/dry seasons cause large swings in water availability, affecting agriculture and supply.
- Quality matters: Pollution from sewage, industry and agriculture reduces usable water, shrinking effective supply.
Main uses of water — domestic, agricultural (largest user globally), industrial and environmental. Efficient use and allocation between these sectors is essential for sustainability.
Causes of water stress and scarcity include population growth (lowering per-capita availability), inefficient agricultural practices (flood irrigation losses), uncontrolled groundwater extraction, pollution of rivers and aquifers, and climate variability/change (altering rainfall patterns).
Sustainable management approaches include watershed management, rainwater harvesting, improving irrigation efficiency (drip/sprinkler), groundwater recharge, water recycling and treatment, river basin planning, demand management and policy measures (pricing, regulation).
Connections to daily life and policy — Water resource issues influence food security, public health, livelihoods of farmers and urban planning. National policies (e.g., inter-basin transfers, irrigation programs) and local solutions (community tanks, johads, rooftop harvesting) are both important.
- Chennai 2019 water crisis — failure of reservoirs after poor monsoon and over-extraction of groundwater led to severe urban water scarcity, highlighting the need for better storage and rainwater harvesting.
- Ralegan Siddhi (Maharashtra) — a village revival through watershed management and rainwater harvesting that improved groundwater levels and agriculture.
- Punjab and Haryana — large-scale groundwater extraction for paddy cultivation leading to falling water tables and long-term depletion.
- Traditional water-harvesting systems such as johads and check dams in Rajasthan and tanks in South India (Tamil Nadu) — local methods that store rainwater and recharge aquifers.
- Drip irrigation adoption in parts of Karnataka and Maharashtra — demonstrates significant water savings compared with flood irrigation and helps increase water-use efficiency in agriculture.
- Percentage (part of whole): Percentage = (Part / Whole) × 100. (Use to compute share of water types, e.g., freshwater as % of total water.)
- Per capita renewable water availability = Total renewable freshwater resources (volume per year) / Population. (Units: cubic metres per person per year.)
- Simple water balance (catchment scale): Precipitation = Runoff + Evapotranspiration + Change in Storage. (Useful to understand how rainfall is partitioned.)
- Runoff (approximate) = Rainfall × Runoff coefficient × Area. (Runoff coefficient depends on land cover and soil.)
- Water-use efficiency (%) = (Useful water output / Total water input) × 100. (E.g., crop yield per unit water applied.)
- Water scarcity thresholds (UN benchmarks): Water stress < 1,700 m3/person/year; Water scarcity < 1,000 m3/person/year; Absolute scarcity < 500 m3/person/year.
Sources of Water
Overview
Sources of water are the natural places where water is found and from which humans obtain water for drinking, irrigation, industry and other uses. Water exists in a continuous cycle (the hydrological cycle) and is stored and moved through several major reservoirs: the atmosphere, surface water (rivers, lakes, ponds, reservoirs), groundwater (aquifers), glaciers and ice caps, and soil moisture.
Main sources (with roles)
- Precipitation (rain and snow) – primary input to all other sources; recharges rivers, lakes and groundwater.
- Surface water – rivers, streams, lakes, ponds and reservoirs. Readily accessible for irrigation, industries and domestic supply. Example uses: river water diverted by canals; reservoirs created by dams store seasonal flows.
- Groundwater – water stored in underground aquifers accessed by wells, tube wells and borewells. Important in dry seasons and areas without surface water.
- Glaciers and snowfields – seasonal melt supplies major rivers (especially in mountainous regions) and acts as long‑term stored freshwater.
- Soil moisture and springs – important locally for agriculture and small community supplies.
Why different sources matter
- Reliability: Groundwater can supply water in dry seasons when rivers fall. Glacier melt provides steady flows in summer in mountain-fed basins.
- Quality: Surface water is more exposed to pollution; groundwater is often cleaner but can be contaminated by overuse and chemicals.
- Renewability: Precipitation replenishes surface and groundwater, but over-extraction or reduced rainfall (climate change) can make a source effectively non-renewable locally.
Threats and management
- Threats: pollution (industrial, agricultural, domestic), over-extraction of groundwater, shrinking glaciers, siltation of reservoirs, and unequal spatial/temporal distribution of rainfall.
- Management approaches: rainwater harvesting, watershed management, groundwater recharge structures (check dams, recharge wells), afforestation, demand management (efficient irrigation, reduced wastage) and inter-basin transfers where needed.
Key classroom connections
- Link the hydrological cycle to how precipitation becomes surface water or groundwater.
- Understand local examples (rivers, lakes, tube wells) and the reasons for using a particular source in a region (climate, geology, technology).
- Rivers: Ganga and its tributaries provide water for drinking and irrigation across northern India; canals divert river water to farms.
- Glaciers: Gangotri glacier supplies the Bhagirathi–Ganga in summer through meltwater.
- Groundwater: Farmers in Punjab and Haryana use tube wells and borewells to irrigate wheat and rice; many villages rely on hand pumps.
- Surface reservoirs/dams: Bhakra-Nangal and Tehri reservoirs store monsoon flows for irrigation, hydroelectricity and drinking water.
- Traditional surface storage: Tanks and small village ponds in South India capture monsoon rain for local use and groundwater recharge.
- Rainwater harvesting: Urban Chennai’s initiatives to recharge groundwater through roof-top harvesting and recharge pits.
- Water balance (basic): Precipitation (P) = Evapotranspiration (ET) + Runoff (R) + Change in Storage (ΔS).
- Per capita renewable water availability: W_pc = Total annual renewable freshwater / Population.
- Darcy’s law (groundwater flow, simplified): Q = K · A · (dh/dl), where Q = discharge, K = hydraulic conductivity, A = cross-sectional area, dh/dl = hydraulic gradient.
- Runoff coefficient (for estimating runoff): Runoff = C · P · Area, where C is runoff coefficient (0–1) depending on surface type, P = rainfall depth.
- Reservoir volume (approx.): Volume ≈ Surface area × Average depth (useful for simple capacity estimates).
Distribution of Water
Overview
Water on Earth is not distributed evenly. Understanding how water is distributed — between oceans, ice, groundwater and surface sources — and how it varies spatially and seasonally is essential for planning water use and managing scarcity.
Global distribution (key proportions – approximate)
- About 97% of Earth’s water is saline (oceans and seas).
- About 3% is freshwater. Of that freshwater:
- ~68–70% is frozen in glaciers and ice caps.
- ~29–30% is groundwater (some of which is deep and not readily available).
- ~0.3–1% is surface water (rivers, lakes, swamps) and other freshwater (soil moisture, atmosphere, biological water).
Spatial and temporal distribution
- Spatial distribution: rainfall, river flows and groundwater availability differ widely between regions because of climate (monsoons, westerlies), topography (mountains, plains), and geology (permeable vs impermeable rocks).
- Temporal distribution: in many regions water availability varies with seasons — e.g., strong monsoon rains concentrated in a few months produce floods followed by long dry spells.
Why distribution is uneven
- Atmospheric circulation and climate zones determine where precipitation falls (e.g., equatorial, tropical, temperate patterns).
- Relief and altitude: mountains capture moisture and generate rivers (snow/glacier melt stores water at high altitude).
- Soil and rock: permeability controls infiltration and groundwater recharge.
- Human factors: urbanisation, land-use change, over-extraction of groundwater, dams and inter-basin transfers change local availability.
- Transboundary river politics can affect distribution (upstream/downstream users).
Consequences
- Regions with low per‑capita renewable water face scarcity: agricultural stress, health risks and reduced industrial capacity.
- Excess water in wet seasons can cause floods; insufficient storage/recharge leads to droughts in dry seasons.
- Over-extraction of groundwater leads to falling water tables, land subsidence and reduced baseflow to rivers.
Management and solutions (to improve distribution and availability)
- Rainwater harvesting and roof/runoff capture to store seasonal rainfall.
- Watershed management: soil conservation, afforestation and check-dams to improve infiltration and slow runoff.
- Artificial recharge of aquifers and regulation of groundwater pumping.
- Efficient irrigation (drip, sprinkler) and water-saving practices in agriculture (largest water user).
- Reuse and recycling of treated wastewater for non-potable uses; desalination where economically feasible.
- Integrated water resources management and transboundary cooperation.
Summary
Only a small fraction of Earth’s water is usable freshwater, and that is distributed unevenly in space and time. Managing demand, increasing storage/recharge, and using water efficiently are key to addressing local and regional water scarcity.
- Chennai water crisis (2019–2020): City reservoirs ran near dry after a poor monsoon and high extraction, highlighting seasonal dependence on stored surface water and the need for groundwater recharge and rainwater harvesting.
- Ganges–Brahmaputra system: Large, perennial rivers fed by monsoon rainfall and Himalayan snow/ice; high water availability in parts of northeast India and Bangladesh during monsoon, but large seasonal variability.
- Punjab and Haryana groundwater depletion: Intensive irrigation (rice–wheat rotation) has caused rapid groundwater decline due to over-pumping, showing how land-use and crop choices affect distribution of usable water.
- Nile River politics: Upstream dam projects (e.g., Ethiopia's GERD) affect downstream Egypt and Sudan — an example of how transboundary rivers lead to contested distribution of water.
- Aral Sea shrinkage: Large-scale diversion of river water for irrigation in Central Asia dramatically reduced a major lake, demonstrating consequences of unsustainable redistribution of surface water.
- Monsoon variability in India: Years of excess rainfall cause floods, while deficient monsoon years cause droughts — illustrating strong temporal unevenness in water supply.
- Percentage: (Part / Whole) × 100. Example: percentage of freshwater = (freshwater volume / total water volume) × 100.
- Water balance (basic): P = ET + R ± ΔS (where P = precipitation, ET = evapotranspiration, R = runoff, ΔS = change in storage (soil moisture, groundwater, reservoirs)).
- Per capita renewable water availability: Wpc = Wtotal / Population (where Wtotal = total renewable freshwater resources per year). Thresholds: >1700 m3/person = comfortable, 1000–1700 m3 = water stressed, <1000 m3 = water scarce, <500 m3 = absolute scarcity.
- Irrigation efficiency (simple): Efficiency = (Water consumed by crops / Water diverted) × 100.
- Groundwater withdrawal percentage of recharge: %Withdrawal = (Annual withdrawal / Annual recharge) × 100. Values >100% indicate unsustainable extraction.
Uses of Water
Water is an essential natural resource used in many ways across households, agriculture, industry, environment and recreation. Although about 71% of Earth's surface is covered by water, only a tiny fraction is available as freshwater for human use. The uses of water can be grouped into major categories with different patterns of demand, seasonality and impacts.
Major uses:
- Domestic use: Water for drinking, cooking, cleaning, bathing, sanitation and household activities. Access to safe drinking water and sanitation is vital for public health.
- Agricultural use: Water for irrigation, livestock, fish farming and agro-processing. Agriculture is the largest consumer of freshwater in most countries (about 60–80% in many developing countries; roughly 70% globally).
- Industrial use: Water used as a raw material, for processing, cooling (power plants, steel, chemical industries), cleaning, and product formulation (textiles, food, pharmaceuticals).
- Energy and transportation: Water for hydroelectric power generation, cooling in thermal plants, and inland navigation.
- Environmental and ecological services: Water that sustains rivers, wetlands, aquifers, forests and biodiversity (maintaining flow regimes, water quality and habitats).
- Recreation and cultural uses: Tourism, boating, fishing, religious rituals and aesthetic uses.
Key characteristics and issues:
- Uneven distribution: Freshwater availability varies spatially and seasonally; some regions face scarcity while others have surplus during monsoon or wet seasons.
- Competition among users: Agriculture, industry and households compete for limited water — allocation and efficiency matter.
- Quality matters: Polluted water is effectively unavailable unless treated. Industrial effluents and untreated sewage reduce usable supplies.
- Groundwater dependence: In many areas groundwater meets domestic and irrigation needs; over-extraction leads to depletion and contamination (salinisation, lowering of water table).
- Sustainability: Conservation measures (drip irrigation, recycling and reuse, rainwater harvesting, wastewater treatment) increase long-term availability.
Practical takeaways: Efficient irrigation (drip/sprinkler), reducing leakages in distribution, treating and reusing wastewater, adopting water-saving appliances, and protecting watersheds and recharge areas are central to meeting future demands.
- Irrigation: A paddy field receives regular irrigation during the growing season; in India agriculture accounts for roughly 75–80% of freshwater withdrawal in many states.
- Domestic: A family uses water for drinking, cooking, bathing and cleaning; per capita domestic use varies widely—from under 20 litres/day in water-poor rural areas to 100+ litres/day in urban areas.
- Industrial: Textile mills use large volumes of water for dyeing and rinsing fabrics; untreated textile effluent can pollute rivers if discharged without treatment.
- Power generation: Hydroelectric dams (e.g., Bhakra Nangal, large reservoirs) generate electricity and regulate water flows; thermal power plants use water for cooling.
- Ecological: Wetlands like the Sundarbans provide habitat and nurseries for fish and act as buffers against floods; loss of water or quality harms biodiversity.
- Recreational/cultural: Rivers and lakes used for boating, religious rituals (e.g., immersion ceremonies) and tourism support local economies but require clean water.
- Per capita renewable water availability = Total renewable freshwater resources / Population
- Sectoral share (%) = (Water withdrawal by sector / Total water withdrawal) × 100
- Freshwater fraction (%) ≈ (Freshwater volume / Total global water volume) × 100 (freshwater ≈ 2.5–3% of global water; usable freshwater much less)
- Irrigation water requirement (simplified) = Crop water requirement (ETc × Area) − Effective rainfall
- Water footprint (total) = Blue water (surface/groundwater) + Green water (soil moisture/rainfed) + Grey water (volume to dilute pollutants)
Irrigation: Types and Methods
Irrigation — meaning and need
Irrigation is the artificial supply of water to crops when rainfall is insufficient or irregular. It stabilises crop production, allows multiple cropping, increases yields and supports agriculture in arid and semi-arid regions.
Why irrigation is needed
- Uneven temporal and spatial distribution of rainfall.
- To provide moisture during dry spells and critical stages of crop growth.
- To enable multiple cropping and higher productivity.
- To reclaim and cultivate arid lands.
Classification of irrigation — by source
- Canal irrigation: Water brought from rivers by gravity through canals (e.g. Indus–Ganga canal systems; Bhakra Nangal commands).
- Well and tube-well irrigation: Groundwater lifted by pumps or by hand (common in Punjab, Haryana, western Uttar Pradesh).
- Tank irrigation: Small reservoirs storing rainwater in hollows, widely used in peninsular India (Tamil Nadu, Karnataka).
- Lift irrigation: Water is lifted from rivers, lakes or canals to higher areas using pumps (examples: some parts of Maharashtra and Andhra Pradesh; projects like those built under the Narmada command).
Methods of applying water to fields (by technique)
1. Surface (or traditional) methods
- Flooding/Border irrigation: Whole field flooded or divided by gentle borders — simple but wasteful of water and can cause waterlogging.
- Furrow irrigation: Water runs in narrow channels (furrows) between crop rows — used for row crops (maize, cotton, sugarcane).
- Basin irrigation: Small basins made around individual trees or plots (orchards, rice paddies) — good for tree crops and paddy.
2. Localised (micro‑irrigation) methods
- Drip (trickle) irrigation: Water emitted slowly near the root zone through pipes and emitters — very water‑efficient and suitable for fruit, vegetables, plantations (grapes, bananas, sugarcane, orchards).
- Sprinkler irrigation: Water sprayed like rain through nozzles — suitable for undulating land and many field crops (wheat, pulses, vegetables).
3. Sub-surface irrigation
Water applied below the soil surface through buried pipes or porous media — reduces evaporation losses but is more technical and expensive.
Advantages and disadvantages (summary)
- Canal: Large area coverage, low operating cost where gravity works; disadvantage — high initial cost, water loss in transit, inequitable distribution.
- Wells/tube-wells: Quick, reliable supply for small farmers; disadvantage — groundwater depletion, saline intrusion, energy cost for pumping.
- Tanks: Good for local water conservation; disadvantage — siltation and limited command area.
- Drip: Highest water use efficiency, reduces weeds and evaporation, increases yield and quality for horticulture; disadvantage — high initial cost, maintenance and clogging issues.
- Sprinkler: Uniform application, useful on uneven land; disadvantage — wind drift, higher energy requirement than surface irrigation.
Problems related to irrigation
- Waterlogging and soil salinity when excess irrigation and poor drainage combine.
- Depletion of groundwater due to over‑extraction.
- Unequal distribution of canal water and conflicts over water rights.
Best practices and sustainable approaches
- Shift from flood irrigation to micro‑irrigation (drip and sprinkler) where economically feasible.
- Conjunctive use of surface and groundwater to balance supplies.
- Water-saving agronomic practices: mulching, scheduling irrigation based on crop needs, use of drought‑resistant varieties.
- Investment in infrastructure: lining canals, modernising distribution networks, check dams and watershed management.
- Canal irrigation: The Bhakra Nangal project supplies canal water to parts of Punjab, Haryana and Rajasthan, supporting wheat and rice cultivation.
- Tube-well irrigation: Intensive use of tube-wells in Punjab and western Uttar Pradesh enabled the Green Revolution but caused groundwater decline.
- Tank irrigation: Small village tanks in Tamil Nadu and Karnataka store monsoon runoff and irrigate wet-season crops and fodder lands.
- Drip irrigation: Farmers growing grapes, bananas and sugarcane in Maharashtra and Karnataka use drip systems to cut water use and increase yields.
- Sprinkler irrigation: Used for maize, pulses and vegetables on undulating fields in some parts of India where surface irrigation is difficult.
- Volume of water (m³) = Depth of water (mm) × Area (m²) / 1000. (Since 1 mm over 1 m² = 0.001 m³.)
- 1 mm of water on 1 hectare = 10 m³. Therefore Volume (m³) = Depth (mm) × Area (ha) × 10.
- Depth (mm) required = Volume (m³) / (Area (ha) × 10).
- Irrigation efficiency (%) = (Water beneficially used by crop ÷ Water withdrawn/supplied) × 100.
- Crop water requirement (simplified) = Crop evapotranspiration (ETc) − Effective rainfall + Losses (conveyance/evaporation).
- Water use efficiency = Crop yield (kg) ÷ Water used (m³). (Higher value means more crop per unit water.)
Major Water Projects and Multipurpose River Projects
What they are: Major water projects are large engineered works built on rivers or catchments — typically dams, reservoirs, canals and allied works — designed to store and control water. Multipurpose river projects are large schemes built to serve several objectives simultaneously: irrigation, flood control, hydroelectric power, drinking water, navigation, and sometimes recreation.
Main components:
- Dam — structure to hold back water and create a reservoir.
- Reservoir — stored water body used for supply, regulation and energy.
- Spillway — safety passage for excess floodwater.
- Powerhouse — turbines and generators for hydropower.
- Canals and distributary systems — to carry water for irrigation and supply.
Objectives and benefits: Provide reliable irrigation (stabilise agriculture), generate renewable hydroelectric power, reduce and regulate floods, supply drinking and industrial water, support inland navigation and fisheries, create employment and local development.
Common issues and concerns: Large dams and multipurpose projects often cause displacement of people, submergence of land and forests, changes in river ecology, siltation of reservoirs (reducing storage over time), fluctuations in downstream flow affecting fisheries and livelihoods, and inter-state or international disputes over water allocation.
Important types/examples of Indian projects (concise): Dam projects like Bhakra–Nangal (Punjab/Himachal — major irrigation and power), Hirakud (Odisha — flood control & irrigation), Sardar Sarovar (Narmada — irrigation & hydropower, controversial for displacement), Tehri (Uttarakhand — hydropower & water supply), Damodar Valley Corporation (DVC — early multipurpose valley project for coal belt), Nagarjuna Sagar, Tungabhadra and Indira Sagar.
How they work (overview): Rain over the catchment becomes surface runoff and fills the reservoir. Water is released through canals for irrigation or through penstocks for power generation. Reservoir storage evens out seasonal variation — storing monsoon inflows to be used in dry periods — and the dam/spillway controls floods.
Planning considerations: Catchment rainfall and runoff patterns, reservoir capacity vs annual demand, sedimentation rate, environmental impact assessment, resettlement plans, inter-state agreements and economic feasibility for combined uses.
- Bhakra–Nangal (Himachal Pradesh / Punjab) — large storage dam on the Sutlej used for irrigation and hydropower; part of India’s post-independence river development.
- Hirakud (Odisha) — one of the earliest multipurpose dams on the Mahanadi for flood control, irrigation and power.
- Sardar Sarovar (Narmada) — multipurpose project for irrigation, drinking water and power; notable for large-scale displacement and environmental debates.
- Damodar Valley Corporation (DVC) — integrated river valley project for flood control, irrigation and power in the Damodar valley (inspired by the Tennessee Valley Authority).
- Tehri Dam (Uttarakhand) — large rock-fill dam providing hydropower, irrigation and municipal water supply.
- Nagarjuna Sagar (Telangana/Andhra Pradesh) — major irrigation dam across the Krishna river.
- Power (instantaneous) from a hydropower plant: P = η · ρ · g · Q · H. (P in watts, η = efficiency [0–1], ρ ≈ 1000 kg/m³, g ≈ 9.81 m/s², Q = discharge in m³/s, H = effective head in meters.)
- Energy from a volume of stored water: E = η · ρ · g · V · H. (E in joules, V = volume in m³.)
- Reservoir volume (approx.): V ≈ A · h_avg. (A = surface area, h_avg = average depth; units: m²·m = m³.)
- Discharge in an open channel: Q = A · v. (A = cross-sectional area in m², v = average velocity in m/s.)
- Runoff from rainfall (approx.): Runoff volume = Rainfall depth · Catchment area · Runoff coefficient. (Ensure consistent units: e.g., m · m² = m³.)
- Common unit conversions: 1 MCM (million cubic metres) = 10⁶ m³. 1 TMC ft (thousand million cubic feet) ≈ 28.3168 MCM.
Dams: Benefits and Problems
What is a dam?
A dam is a barrier built across a river or stream to hold back water and create a reservoir. Dams can be made of concrete, masonry or earth and are used to regulate river flow and store water for different uses.
Types (brief): gravity dams, arch dams, and embankment (earth/rock-fill) dams.
Benefits of dams
- Irrigation: Reservoirs provide reliable water supply for agriculture throughout the year, enabling multiple cropping and increased food production.
- Hydropower generation: Dams convert potential energy of stored water into electricity — a renewable and low-carbon source when well-managed.
- Drinking and industrial water supply: Municipal and industrial water needs are met from stored water during dry periods.
- Flood control: By regulating river discharge during heavy rains, dams reduce flood peaks downstream and protect settlements and crops.
- Navigation and transport: Reservoirs and controlled flows can improve navigability of rivers for transport.
- Fisheries, recreation and tourism: Reservoirs often support fishery development, boating, and tourism activities.
- Employment and regional development: Construction and operation create jobs and stimulate local economies through improved irrigation, power and infrastructure.
Problems and negative impacts
- Submergence and displacement: Large areas of land (farmland, forests, villages) get submerged; people are often displaced and need rehabilitation and resettlement.
- Loss of fertile land and cultural sites: Productive land, archaeological sites and local heritage can be permanently lost underwater.
- Environmental impacts: Altered flow regimes change river ecology, block fish migration, reduce downstream nutrient and sediment supply, and can degrade wetlands and estuaries.
- Siltation/sedimentation: Sediments settle in the reservoir reducing storage capacity over time and shortening dam life; downstream channels can become sediment-starved causing riverbank erosion.
- Waterlogging and salinization: Poorly drained irrigated areas fed by dams can become waterlogged and saline, reducing soil fertility.
- High costs and technical risks: Dams are expensive to build and maintain; they carry risks of seepage, structural failure and catastrophic flooding if they fail.
- Social conflicts and inequity: Benefits and harms may be unequally distributed — upstream/downstream or rich/poor groups may be affected differently.
- Transboundary disputes: Dams on international rivers can cause tensions between countries over water allocation.
Mitigation and good practices (summary): careful environmental and social impact assessment, fair resettlement and compensation, maintenance of environmental flows downstream, sediment management (e.g., sluicing), fish passages, catchment treatment to reduce silt, and integrated basin planning.
Conclusion: Dams provide major benefits for irrigation, power, water supply and flood control but also create significant social and environmental problems. Sustainable planning seeks to maximize benefits while minimizing and compensating for harms.
- Bhakra Nangal (India) – large multipurpose dam supplying irrigation and hydropower to northern states.
- Hirakud Dam (India) – flood control, irrigation and power on the Mahanadi; significant social and ecological impacts from submergence.
- Tehri Dam (India) – hydroelectricity and water storage in Uttarakhand; controversial due to displacement and seismic concerns.
- Sardar Sarovar / Narmada Project (India) – large inter-state project with major resettlement and environmental debates.
- Nagarjuna Sagar (India) – one of the world’s largest masonry dams; supports extensive irrigation and power generation.
- Three Gorges Dam (China) – largest hydroelectric plant; provides power and flood control but caused massive resettlement and ecological changes.
- Power from hydropower plant: P = ρ × g × Q × H × η - P = electrical power (W) - ρ = density of water (~1000 kg/m³) - g = acceleration due to gravity (9.81 m/s²) - Q = volumetric flow rate (m³/s) - H = effective head (height difference) (m) - η = efficiency (decimal, e.g., 0.8 for 80%)
- Energy over time: E = P × t (E in joules if P in watts and t in seconds) or E (kWh) = P (kW) × t (hours).
- Water balance for a reservoir (basic): ΔS = Inflow − Outflow − Evaporation − Seepage - ΔS = change in storage (m³) over a period.
- Reservoir residence (turnover) time: T = Volume / Q (Volume = reservoir storage in m³; Q = average outflow m³/s; T in seconds or converted to days/years).
- River discharge (general): Q = A × v - Q = discharge (m³/s), A = cross-sectional area (m²), v = average velocity (m/s).
Groundwater: Recharge and Depletion
What is groundwater? Groundwater is the water present beneath the Earth's surface in the pores and fractures of soil and rocks. The saturated zone where all pores are filled with water forms an aquifer; the upper surface of this zone is called the water table.
Recharge: Recharge is the process by which water percolates from the surface to replenish groundwater. Natural recharge includes rainfall infiltration, river and lake seepage, and seepage from irrigation channels. Artificial recharge refers to human interventions such as recharge wells, percolation tanks, check dams, contour bunding and rainwater harvesting.
Depletion (Over-extraction): Groundwater depletion happens when withdrawal (pumping) exceeds recharge over time. Causes include intensive irrigation, rising domestic and industrial demand, urbanisation (which reduces infiltration because of sealed surfaces), deforestation, and prolonged droughts.
Consequences of depletion
- Falling water tables that make wells deeper and more expensive to operate.
- Drying up of shallow wells and reduction of baseflow to rivers and wetlands.
- Land subsidence (ground sinking) where large volumes of water are removed from compressible aquifer materials.
- Saltwater intrusion in coastal aquifers, making groundwater saline and unusable.
- Loss of water for ecosystems and agriculture, increased energy costs, and social conflicts over water access.
Management and solutions include demand management (efficient irrigation like drip/sprinkler systems), protecting recharge zones, promoting rainwater harvesting, artificial recharge (recharge wells, percolation tanks), regulating pumping (licenses, metering), conjunctive use of surface and groundwater, watershed management, and afforestation.
Simple conceptual balance: groundwater storage changes when inputs (recharge) and outputs (withdrawal + natural discharge) are unequal. Sustainable use means long-term withdrawals ≈ long-term recharge.
- North‑west India (Punjab, Haryana, Rajasthan): Intensive groundwater pumping for irrigation has caused large declines in the water table in many districts, requiring deeper tube wells and more energy for pumping.
- Chennai (coastal city): Over-extraction and reduced recharge due to urbanisation have led to lowered groundwater levels and periodic water shortages; coastal aquifers are also vulnerable to saltwater intrusion.
- California Central Valley (USA): Decades of heavy pumping caused large land subsidence and reduced aquifer storage capacity.
- Mexico City: Extensive groundwater extraction has resulted in city-wide subsidence, damaging buildings and infrastructure.
- Rajasthan and parts of Maharashtra: Traditional structures like johads, check dams and modern percolation tanks have been used successfully in many watersheds to increase recharge and restore local groundwater levels (example: watershed works and conservation in Ralegan Siddhi).
- Groundwater balance (simple): ΔS = R - W - O where ΔS = change in groundwater storage, R = recharge volume, W = withdrawals (pumping), O = other outflows (evapotranspiration, natural discharge).
- Recharge rate (depth units): Recharge (mm/year) = (Recharge volume / Area) × 1000 mm/m.
- Darcy's Law (groundwater flow): Q = K × A × (dh/dl) where Q = discharge (volume/time), K = hydraulic conductivity (length/time), A = cross-sectional area (length²), dh/dl = hydraulic gradient (dimensionless).
- Specific discharge (seepage velocity approximation): q = Q / A = K × (dh/dl).
- Specific yield (unconfined aquifer): Sy = (Volume of water that drains by gravity) / (Total volume of aquifer) — dimensionless (often expressed as fraction or percent).
- Storativity / Storage coefficient: For confined aquifer, S = Ss × b where Ss = specific storage (1/length) and b = aquifer thickness (length); S gives volume of water released per unit surface area per unit decline in head.
Waterlogging and Salinization
Definition: Waterlogging is the saturation of soil with water so that the water table rises to or near the surface and root-zone aeration is lost. Salinization is the accumulation of soluble salts (chlorides, sulfates, carbonates of sodium, calcium, magnesium) in the soil to levels that reduce crop growth.
Causes:
- Excessive irrigation with poor drainage — common in irrigated agriculture where applied water is more than crop use and percolates to raise the groundwater table.
- Poor drainage and impermeable layers — lack of surface/subsurface drains or compacted soils prevent downward movement of water.
- Canal seepage and unlined watercourses — seepage raises local groundwater levels.
- High evaporation in arid/semi-arid zones — evaporative loss from shallow water tables concentrates salts near the surface.
- Use of saline irrigation water — irrigation water containing dissolved salts adds salts gradually.
- Over-extraction of groundwater near coasts — seawater intrusion increases salinity in aquifers and soils.
How waterlogging and salinization are linked: Waterlogging raises the water table and can bring dissolved salts into the root zone. When the water table is shallow and surface evaporation is high, salts precipitate and accumulate in the topsoil, causing salinization. Conversely, saline groundwater used for irrigation also leads to salt buildup if not leached properly.
Effects on agriculture and environment:
- Reduced crop yields due to poor oxygen supply to roots (waterlogged soils) and osmotic stress / specific ion toxicity (saline soils).
- Soil structure deterioration — dispersion of clay particles in sodic soils (high sodium) reduces permeability.
- Increased plant diseases, stunting, and uneven crop stands.
- Loss of arable land — long-term salinization can render land unproductive.
- Local water quality degradation and ecosystem impacts (wetland changes, reduced biodiversity).
Indicators and measurements: Electrical Conductivity (EC) of soil saturation extract (ECe) indicates salinity. Other important measures are Sodium Adsorption Ratio (SAR), Exchangeable Sodium Percentage (ESP), pH and total dissolved solids (TDS) of irrigation water and soil solution. Typical soil salinity classes (ECe): non-saline <2 dS/m; slight 2–4 dS/m; moderate 4–8 dS/m; high 8–16 dS/m; very high >16 dS/m.
Management and remedies:
- Improve drainage — surface drains for runoff and subsurface tile drains to lower water table.
- Line canals and reduce seepage to prevent local rise of groundwater.
- Adopt efficient irrigation — drip or sprinkler irrigation reduces deep percolation losses and salt accumulation.
- Leaching — apply excess good-quality water periodically to flush salts below the root zone (requires adequate drainage).
- Soil amendments — gypsum (calcium sulfate) application for sodic soils replaces exchangeable Na+ with Ca2+ and improves structure.
- Crop choice & crop management — use salt-tolerant crops, crop rotation, and avoid sensitive crops on saline soils.
- Groundwater management — controlled pumping, artificial recharge and watershed management to stabilize water tables.
- Coastal protection — prevent seawater intrusion by regulating groundwater extraction and using protective barriers where feasible.
Classroom/Field detection: Observe waterlogged patches, white salt crusts on soil surface, poor plant growth. Measure EC of soil extract or irrigation water using a conductivity meter; test groundwater depth with piezometers or observation wells.
Summary: Waterlogging and salinization are interrelated problems caused mainly by poor irrigation and drainage practices, arid climate and saline water use. They reduce productivity but are manageable through integrated water management—drainage, efficient irrigation, soil amendments and appropriate cropping.
- Punjab and Haryana (India): After the Green Revolution, over-irrigation and inadequate drainage caused rising water tables and local waterlogging leading to reduced yields in some blocks.
- Indus Basin (Pakistan) and parts of Sindh: Large-scale irrigation without drainage led to extensive salinization and waterlogging in the 20th century.
- Murray-Darling Basin (Australia): Land clearing and irrigation led to secondary salinity problems affecting farmland and river water quality.
- Coastal Kerala and parts of West Bengal (India): Over-pumping of aquifers caused seawater intrusion and soil salinity in coastal zones.
- Western Rajasthan (India): High evaporation and saline irrigation water have produced areas of salt-affected soils that need reclamation.
- SAR (Sodium Adsorption Ratio) = [Na+] / sqrt(( [Ca2+] + [Mg2+] ) / 2), concentrations in meq/L
- ESP (Exchangeable Sodium Percentage) = ( Exchangeable Na+ / Cation Exchange Capacity ) × 100
- TDS (mg/L) ≈ 640 × EC (dS/m) (approximate conversion used for natural waters)
- Leaching Requirement (approximate) LR = ECw / (5 × ECe - ECw) where ECw = electrical conductivity of irrigation water (dS/m) and ECe = tolerated soil salinity (dS/m)
- Soil salinity class (ECe, dS/m): non-saline <2; slight 2–4; moderate 4–8; high 8–16; very high >16
Floods: Causes, Effects and Management
What is a flood? A flood is an overflow of water onto normally dry land. It occurs when the water in rivers, lakes, oceans or drainage systems exceeds the capacity of its channel or basin and inundates surrounding areas.
Causes of floods
- Heavy or prolonged rainfall: Intense monsoon rains or cyclonic storms can saturate soil and raise river levels quickly.
- Cloudbursts and flash floods: Extremely intense localized rainfall (cloudburst) causes very rapid runoff and sudden flash floods, especially in hilly terrain.
- Snowmelt: Rapid melting of snow/ice in spring can increase river discharge downstream.
- Storm surge and coastal flooding: Cyclones can push seawater inland, causing coastal inundation.
- Dam/embankment failure: Breach of dams, levees or embankments (sometimes due to overtopping or poor maintenance) releases large volumes of water.
- Human activities: Deforestation, urbanisation (more impervious surfaces), poor drainage, and river channel encroachment reduce infiltration and increase runoff.
- Siltation and reduced channel capacity: Sediment deposition raises riverbeds and reduces flow capacity, making overflows more likely.
Effects of floods
- Human impacts: Loss of life, injury, displacement of people, and damage to homes.
- Agriculture and food security: Crops and livestock are damaged; fertile topsoil may be eroded or covered by sand/silt.
- Infrastructure: Roads, bridges, railways, power and water supplies, and communication networks are disrupted.
- Economy: Business losses, repair costs, reduction in GDP for affected regions, long-term recovery expenses.
- Health and environment: Spread of water-borne diseases, contamination of drinking water, loss of habitat and biodiversity.
Flood management (mitigation, preparedness, response and recovery)
Flood management requires an integrated approach combining structural and non-structural measures:
- Structural measures
- Dams and reservoirs: store excess runoff and regulate river flow.
- Embankments/levees and floodwalls: protect settlements by keeping water within the channel.
- Channel improvement and diversion canals: increase flow capacity or divert floodwaters to safe areas.
- Retention basins and detention ponds: temporarily store runoff in urban areas.
- Non-structural measures
- Floodplain zoning and land-use regulation: avoid building in high-risk areas.
- Early warning systems and forecasting: meteorological and hydrological forecasting with timely alerts to communities.
- Afforestation and watershed management: reduce runoff and erosion in catchment areas.
- Public awareness, preparedness and evacuation planning: community drills, emergency supplies and shelters.
- Insurance and financial risk transfer: help households and governments recover faster.
Integrated river-basin management combines upstream watershed conservation, regulated reservoir releases, maintained embankments and data-driven forecasting to reduce flood risk while ensuring water availability.
Short-term response and recovery include search and rescue, temporary shelters, restoring drinking water and sanitation, disease surveillance, and rebuilding with disaster-resilient standards.
Key idea for students: Floods are natural events often worsened by human actions. Good planning and a combination of engineering solutions plus sustainable land-use and early warnings can greatly reduce loss of life and property.
- 2013 Uttarakhand (India): Cloudburst and heavy monsoon rains in the Himalayan catchments caused devastating flash floods and landslides; thousands were affected and many settlements were damaged.
- 2018 Kerala (India): Exceptionally heavy monsoon rains and high reservoir releases led to widespread flooding across the state, damaging crops, infrastructure and housing.
- 2008 Kosi breach (Bihar, India): A breach in an embankment of the Kosi river changed the river course and flooded millions of hectares, displacing large populations.
- 1998 Bangladesh floods: Prolonged heavy monsoon rains and upstream river flows caused one of the largest floods, inundating much of the country and affecting millions.
- Discharge (continuity): Q = A × v, where Q = discharge (m^3/s), A = cross-sectional area of flow (m^2), v = mean velocity (m/s).
- Rational method (for peak runoff estimation in small catchments): Q = C × i × A, where Q = peak discharge (m^3/s), C = runoff coefficient (dimensionless), i = rainfall intensity (m/s), A = catchment area (m^2).
- Manning's equation (open channel flow velocity): v = (1/n) × R^(2/3) × S^(1/2), where v = velocity (m/s), n = Manning's roughness coefficient, R = hydraulic radius (m), S = channel slope (m/m).
- Return period / recurrence interval (flood frequency): T = (N + 1) / M, where T = return period (years), N = number of years of record, M = rank of the event (1 for largest).
Drought: Causes, Impacts and Mitigation
Drought: Definition
Drought is a prolonged period of deficient rainfall relative to the statistical multi-year average, leading to water shortage for people, agriculture, industry and environment. It develops slowly and can last months to years.
Types of drought
- Meteorological drought – rainfall is significantly below normal for a region for a period.
- Agricultural drought – soil moisture is insufficient for crops during critical growing periods.
- Hydrological drought – reduced streamflow, reservoir storage and groundwater levels.
- Socio-economic drought – when water shortage affects supply and demand of goods and services, causing economic losses.
Causes
- Natural/climatic causes: Weak or delayed monsoon, changing wind patterns, El Niño/La Niña events, long-term climate variability and climate change increasing frequency and intensity of dry spells.
- Hydrological reasons: Low river flows, depleted reservoirs and groundwater due to reduced recharge or over-extraction.
- Human causes: Overuse of water (irrigation, industry), deforestation and land degradation (reduced infiltration), poor watershed management, unplanned urbanisation and inefficient irrigation technologies.
- Socio-economic factors: Poverty, lack of infrastructure, inadequate drought preparedness and governance that amplify impacts.
Impacts
- Agriculture & food security: Crop failure, reduced yields, loss of fodder and higher food prices.
- Water resources: Lower reservoir levels, falling groundwater tables, dry wells and water rationing.
- Livelihoods & migration: Loss of income for farmers and rural workers, rural–urban migration and distress migration.
- Economy: Decline in GDP from agriculture, increased cost of relief, decreased power generation (hydropower).
- Environment: Land degradation, loss of biodiversity, increased soil salinity, higher wildfire risk.
- Health & social: Malnutrition, water-borne diseases from lower water quality, social conflicts over water.
Mitigation and Management
Effective drought management has three pillars: preparation (long-term), early warning & monitoring (short-term) and relief/response.
Short-term measures
- Emergency water supply (tanker, piped connections), distribution of fodder and food, cash/employment schemes (e.g., MNREGA-type work) to reduce distress.
- Temporary groundwater pumping controls and prioritising drinking water supply.
Long-term measures
- Watershed management: Contour bunding, check dams, percolation tanks to increase recharge.
- Rainwater harvesting in fields, homes, public buildings to capture monsoon runoff.
- Groundwater recharge: Recharge wells, recharge zones and regulation of extraction.
- Efficient irrigation: Drip and sprinkler systems, scheduling irrigation to reduce wastage.
- Crop choices: Drought-tolerant and short-duration crop varieties, crop diversification and agroforestry.
- Soil & conservation practices: Mulching, conservation tillage to retain moisture.
- Policy & finance: Drought contingency plans, crop insurance, water pricing, data-driven allocation and inter-state cooperation.
- Monitoring & early warning: Meteorological forecasts, drought indices (SPI, PDSI), remote sensing to track vegetation stress.
Role of communities and schools
Local participation in watershed work, maintaining rainwater harvesting systems, water conservation awareness, and school projects (water audits) make mitigation sustainable.
Conclusion: Drought risk can be substantially reduced by combining scientific monitoring, sustainable land and water management, efficient water use and strong social policy backed by community participation.
- Marathwada drought (Maharashtra, India) 2015: Severe monsoon deficit led to crop failures, drinking water shortages and large-scale distress in farming communities.
- Bundelkhand (Uttar Pradesh & Madhya Pradesh, India): Recurrent droughts caused groundwater depletion, failed crops and seasonal migration of labour.
- Horn of Africa drought (2010–2012 and 2016–2017): Repeated drought episodes caused widespread food insecurity and famine in parts of Somalia, Ethiopia and Kenya.
- California drought (USA) 2012–2017: Prolonged dry period led to strict water restrictions, increased groundwater pumping and changes in agricultural practices.
- Rainfall deficiency (%) = ((Normal rainfall − Actual rainfall) / Normal rainfall) × 100 — used to classify severity of drought.
- Simple water balance: Precipitation (P) = Evapotranspiration (ET) + Runoff (R) + Change in Storage (ΔS). — helps identify available water and deficits.
- Irrigation efficiency (%) = (Water beneficially used by crops / Water withdrawn for irrigation) × 100 — higher values mean less wastage.
- Standardized Precipitation Index (SPI) — concept: SPI = (P − P_mean) / P_std (precipitation anomaly normalized by long-term mean and standard deviation) — used to quantify meteorological drought over time scales.
- Crop yield response (FAO concept): Ya/Ym = 1 − Ky(1 − ETa/ETm) — relates actual yield (Ya) to maximum yield (Ym) based on actual (ETa) and maximum (ETm) crop evapotranspiration and crop sensitivity factor Ky (advanced).
Water Pollution and Health
What is water pollution? Water pollution happens when harmful substances — chemicals, pathogens, microplastics, heavy metals, or excess nutrients — enter water bodies (rivers, lakes, groundwater, seas) and degrade water quality. Polluted water cannot support aquatic life and becomes unsafe for drinking, bathing, fishing and irrigation.
Sources and types of pollutants
- Point sources: identifiable outlets such as sewage pipes, drains from factories, and effluent from treatment plants.
- Non-point sources: diffuse sources such as agricultural runoff (fertilisers and pesticides), urban stormwater and soil erosion.
- Common pollutants: biological (bacteria, viruses, protozoa), organic matter (sewage, food waste), chemical (industrial solvents, heavy metals like lead, mercury, arsenic), and nutrients (nitrate, phosphate) that cause eutrophication.
How polluted water harms health
- Waterborne infectious diseases: Pathogens in contaminated water cause diarrhoea, cholera, typhoid, hepatitis A and E, dysentery and protozoal infections. These illnesses cause high morbidity and can be fatal, especially in children.
- Chemical poisoning and chronic diseases: Long-term exposure to chemicals such as arsenic, fluoride, mercury and lead causes chronic conditions — arsenicosis and skin lesions, fluorosis (bone and teeth damage), neurological disorders, kidney and liver damage, and increased risk of cancer.
- Bioaccumulation and food-chain effects: Toxic substances (for example, mercury) accumulate in fish and shellfish; people who eat contaminated fish receive higher doses and can suffer neurological and developmental damage (especially fetuses and children).
- Indirect health effects: Polluted water harms livelihoods (fishing, agriculture), lowers nutritional status, and increases poverty and vulnerability to disease.
Examples of typical health pathways
- Drinking contaminated water → diarrhoea and dehydration.
- Using contaminated river water for washing/cooking → skin and eye infections; ingestion of pathogens.
- Eating contaminated fish → chronic poisoning (e.g., mercury).
Prevention and control
- Sanitation & hygiene: proper toilets, safe sewage disposal, handwashing.
- Wastewater treatment: primary/secondary treatment of sewage and industrial effluents before discharge.
- Safe drinking water measures: household filtration, chlorination, boiling, community treatment plants and protection of groundwater sources.
- Source control: regulate and monitor industrial discharges, reduce pesticide/fertiliser runoff, ban or reduce hazardous chemicals.
- Public health actions: surveillance of waterborne diseases, rapid response to outbreaks, community education.
Link to sustainable development Clean water (SDG 6) is essential for health. Protecting water quality reduces disease burden, improves nutrition and supports economic well-being.
- Contaminated river water causing diarrhoea outbreaks in communities that rely on untreated surface water for drinking and washing.
- Industrial discharge into a river leading to fish kills and villagers suffering from skin rashes and stomach problems after using the water.
- Groundwater contaminated with arsenic (natural or anthropogenic) causing chronic skin and internal health problems in affected areas.
- The Flint water crisis (USA): lead contamination in a city’s water supply led to elevated blood lead levels and public-health emergency.
- Agricultural runoff rich in fertilisers causing algal blooms in lakes (eutrophication); toxins produced by some algae can make water unsafe for people and livestock.
- Concentration (%) = (mass of pollutant / total mass of water sample) × 100
- BOD5 (mg/L) = DO_initial − DO_after_5_days (at 20°C) — Biological Oxygen Demand measures biodegradable organic pollution.
- COD (mg/L) = amount of oxygen (in mg) required to chemically oxidise organic and inorganic matter in 1 L of sample — measured by standard laboratory test.
- Incidence rate (waterborne disease) = (number of new cases in period / population at risk during period) × multiplier (e.g., 1,000 or 100,000)
Water Conservation Techniques
What is water conservation and why it matters
Water conservation means using and managing water resources so that supply meets long‑term demand while protecting ecosystems. It is crucial because freshwater is limited, groundwater levels are falling in many regions, and agriculture (the largest user) and growing populations increase stress on supplies.
Main categories of techniques
Techniques can be grouped into supply‑side (increasing or securing availability) and demand‑side (using less water or using it more efficiently).
Supply‑side techniques
- Rainwater harvesting (rooftop and surface): capture rainfall, filter it and store or recharge groundwater. Basic components: catchment (roof/land), conveyance (pipes/glean), filter, storage tank or recharge pit.
- Watershed management: integrated land and water measures (contour bunds, afforestation, check dams, contour trenches) to reduce runoff, increase infiltration and recharge aquifers.
- Check dams, percolation tanks and recharge wells: small structures across streams/in gullies slow runoff and allow percolation into the ground.
- Recycling and reuse: treated wastewater reuse for irrigation, industry or groundwater recharge.
Demand‑side techniques
- Micro‑irrigation (drip and sprinkler): delivers water nearer to plant roots and reduces losses from evaporation and seepage — large water savings versus flood irrigation.
- Crop planning and scheduling: choose less water‑intensive crops for dry areas and irrigate using crop water requirements and soil moisture monitoring (irrigate at optimal times).
- Water‑saving practices: mulching, soil moisture conservation, alternate wetting and drying in paddy, lining canals to reduce seepage, fixing leaks, efficient household fixtures.
- Institutional and economic measures: water pricing, metering, subsidies targeted to efficient systems, community management of resources.
How these techniques work together
Effective water conservation combines local rain capture and recharge (supply), efficient irrigation and domestic usage (demand), community stewardship and supportive policies. For example, a watershed project may build check dams (supply), promote micro‑irrigation (demand) and form local water user associations (management).
Benefits and challenges
Benefits include improved groundwater levels, more reliable irrigation, reduced flood and soil erosion, and long‑term water security. Challenges are initial costs, need for community coordination, maintenance of structures, and ensuring equitable access.
- Rooftop rainwater harvesting in Chennai: mandatory RWH after the 2001 drought; many buildings recharge groundwater through recharge pits.
- Sukhomajri watershed project (Haryana): contour bunding, check dams and community participation improved groundwater and farm incomes.
- Tarun Bharat Sangh and Rajendra Singh in Alwar, Rajasthan: restoration of johads and percolation tanks revived springs and groundwater.
- Drip irrigation adoption in Gujarat and parts of Maharashtra: substantial water savings and increased crop yields compared with flood irrigation.
- Wastewater reuse (Singapore NEWater as a global example): treated water reused for industrial and indirect potable uses to augment supply.
- Per capita renewable water availability = Total renewable freshwater resources (m3/year) ÷ Population
- Runoff coefficient = Runoff volume ÷ Rainfall volume (dimensionless; depends on land use and slope)
- Irrigation Water Use Efficiency (CWU) ≈ Crop yield (kg) ÷ Water used (m3) — used to compare methods (higher is better)
- Conveyance efficiency = Water delivered to-field ÷ Water released from source (expressed as %)
- Recharge estimate (basic) ≈ Rainfall (m) × Catchment area (m2) × Recharge coefficient (fraction)
- Volume captured by rooftop RWH = Rainfall depth (m) × Rooftop area (m2) × Runoff coefficient (≈0.8–0.95)
Rainwater Harvesting
Definition: Rainwater harvesting (RWH) is the collection and storage of rainwater from roofs, land surfaces or rock catchments using simple techniques such as tanks, ponds, percolation pits and recharge wells. It is used to supplement water supply, recharge groundwater and reduce runoff and soil erosion.
Why it is needed: Many regions face seasonal water scarcity, falling groundwater levels and increasing demand. RWH captures locally available rainfall to reduce dependence on distant sources, cut the cost of water supply, prevent floods and help sustain agriculture and domestic needs.
Main components:
- Catchment: surface that receives rainfall (e.g., rooftop, paved area, open ground).
- Conveyance: gutters and pipes that transport water from catchment to storage or recharge points.
- Filtration: first-flush diverters, mesh screens, sand filters to remove debris and pollutants.
- Storage/recharge: tanks, cisterns for direct use; recharge pits/wells and ponds for groundwater recharge.
- Outlet/overflow: safe discharge for excess water (to storm drains or recharge structures).
Common methods:
- Rooftop harvesting with storage tanks for household or institutional use.
- Surface runoff harvesting: small check dams, percolation tanks, contour trenches capture and store water in catchment areas for groundwater recharge.
- Recharge structures: recharge wells, borewells with recharge pits, sand-filled pits to promote percolation.
- Traditional systems: johads, khadins, and stepwells used in different parts of India to conserve rainwater.
Design and sizing (overview): Design uses local mean annual rainfall, catchment area and a runoff coefficient (fraction of rainfall that can be captured). Basic calculation estimates how much water can be harvested and what storage is needed (see formulas section).
Advantages:
- Augments water supply and reduces demand on groundwater and municipal supply.
- Recharges aquifers, raising water tables and improving baseflow in streams.
- Reduces urban flooding and erosion by lowering runoff.
- Low-cost, scalable and suitable for rural and urban areas.
Limitations & precautions:
- Effectiveness depends on seasonal rainfall patterns—may not meet demand in long dry spells.
- Requires good maintenance (cleaning gutters, first-flush devices, tank desludging) to avoid contamination.
- Quality checks necessary if used for drinking—proper filtration and disinfection required.
Implementation steps (simple):
- Estimate monthly water demand and local rainfall statistics.
- Select catchment (roof type, area) and determine runoff coefficient.
- Design conveyance, filtration and appropriate storage or recharge structures.
- Install first-flush diverters, screens and covered storage tanks to prevent contamination.
- Regularly maintain and inspect the system (every 3–12 months depending on use).
Class 10 relevance: In the chapter on Water Resources, rainwater harvesting is presented as a sustainable local solution to water scarcity and a method to manage resources equitably and efficiently. It ties to discussions on groundwater depletion, water distribution and community management of resources.
- Urban rooftop harvesting: A school with a 150 m² rooftop captures monsoon rains, stores water in a 10,000-litre tank for toilets and gardening, reducing mains-water use.
- Chennai and other Indian cities: Following severe water shortages, many cities made rooftop rainwater harvesting systems mandatory to increase local water availability and recharge aquifers.
- Traditional systems in Rajasthan (johads and khadins): Community-built small ponds and bunds capture monsoon runoff for groundwater recharge and rearing cattle or limited irrigation.
- Village-level recharge: Farmers construct percolation pits and recharge wells to restore groundwater levels, enabling wells to yield water again in the dry season.
- Institutional example: Hospitals and large institutions install multi-stage filtration plus storage tanks to supplement non-potable water needs (flushing, cleaning, landscaping).
- Harvestable volume (m³) = Rainfall depth (m) × Catchment area (m²) × Runoff coefficient (C). Example: For R = 0.6 m, A = 150 m², C = 0.8 → V = 0.6×150×0.8 = 72 m³ (72,000 litres).
- Convert cubic metres to litres: Volume (L) = Volume (m³) × 1000.
- Storage sizing (simple approach): Required storage (L) = Daily demand per person (L) × Number of people × Number of dry days to be covered. Choose storage ≤ Harvestable volume.
- Runoff coefficient (typical values, C): Roof (tile/metal) ≈ 0.8–0.95; paved surface ≈ 0.6–0.9; grass/soil ≈ 0.1–0.4. Use appropriate C when estimating harvestable water.
- Percent capture (%) = (Harvestable volume / Total rainfall over catchment) × 100 = C × 100.
Watershed Management
Definition: A watershed is the area of land that drains rainfall and surface water to a common outlet (stream, lake, reservoir or groundwater recharge zone). Watershed management is the integrated planning and implementation of conservation measures (biological, mechanical, agronomic and institutional) to conserve soil and water, improve land productivity, recharge groundwater, reduce floods and sustain livelihoods.
Why it matters (Objectives):
- Reduce surface runoff and soil erosion.
- Increase groundwater recharge and baseflow to streams.
- Improve agricultural productivity and reduce drought risk.
- Control floods and sedimentation downstream.
- Promote sustainable land use and community participation.
Main components and technical measures:
- Water harvesting structures: check dams, percolation tanks, farm ponds, nala bunds — slow runoff and increase infiltration.
- Soil conservation: contour bunding, terracing, strip cropping, gully plugging to prevent soil loss.
- Vegetative measures: afforestation, pasture improvement, agroforestry, vegetative buffer strips to bind soil and increase infiltration.
- Groundwater recharge: recharge wells, recharge shafts, permeable recharge pits in recharge zones.
- Land-use planning: matching cropping systems to soil/slope, controlled grazing, protection of catchment headwaters.
- Institutional & social measures: formation of watershed committees, community participation, rules for water use, maintenance plans and capacity building.
Planning and implementation steps:
- Delineation: map watershed boundaries and drainage network.
- Survey & diagnosis: assess soils, slopes, land use, rainfall, erosion hotspots and socioeconomics.
- Zoning & treatment plan: prioritize sub-watersheds, select engineering and biological measures.
- Implementation: construct structures, plant vegetation, adopt farming changes, create institutions.
- Monitoring & maintenance: track groundwater levels, crop yields, structure condition; maintain by community groups.
Benefits: lower peak flows and floods, reduced sediment yield to reservoirs, higher groundwater tables and dry-season flows, increased crop yields and fodder, improved livelihoods and resilience.
Challenges: land tenure and rights issues, upfront costs, technical design mistakes, weak community participation, need for long-term maintenance.
Policy context (India): major programmes include Integrated Watershed Management Programme (IWMP), Mahatma Gandhi National Rural Employment Guarantee Act (MGNREGA) funds often used for watershed works, and many successful village models (see examples below).
Summary: Watershed management is a cross-sectoral, area-based approach that combines engineering and ecological measures with community institutions to conserve water and soil and to enhance sustainable development of the catchment.
- Hivre Bazaar, Maharashtra — a village watershed project (community-driven) that improved groundwater levels, crop yields and income through soil and water conservation and social reforms.
- Sukhomajri, Haryana — early Indian example where contour trenches, pasture development and community management increased water availability and reduced soil erosion.
- Loess Plateau, China — large-scale rehabilitation of severely eroded watershed areas using terraces, vegetation and community work, leading to restored vegetation and increased agricultural productivity.
- Alwar district (Sahibi basin), Rajasthan — watershed interventions and rooftop water harvesting in some projects increased groundwater recharge and reduced conflict over water.
- Runoff volume (simple): V = P × A × C. Where V = runoff volume (e.g., cubic metres), P = rainfall depth (m), A = catchment area (m²), C = runoff coefficient (dimensionless, 0–1).
- Rational method for peak runoff: Q_peak = C × i × A. Q_peak in m³/s (with consistent units), C = runoff coefficient, i = rainfall intensity (m/s), A = area (m²). Often used for small catchments and design of drainage structures.
- Universal Soil Loss Equation (USLE): A = R × K × LS × C × P. A = annual soil loss (t/ha/yr), R = rainfall erosivity, K = soil erodibility, LS = slope length-gradient factor, C = cover-management factor, P = support practice factor.
- Water harvesting storage (estimate): Vh = A_catch × P × C. Vh = harvestable volume, A_catch = catchment area, P = effective rainfall, C = collection efficiency/runoff coefficient.
- \[Horton infiltration model (to estimate declining infiltration rate): f(t) = f_c + (f0 - f_c) × e^{-k t}. f(t) = infiltration rate at time t\]\[f0 = initial rate\]\[f_c = final constant rate\]\[k = decay constant.\]
Traditional and Local Water-Harvesting Systems
What it is: Traditional and local water-harvesting systems are low-tech, community- or household-scale structures and methods developed over centuries to collect, store and recharge water from rainfall and surface flows. They are adapted to local climate, geology and social needs and often combine storage, groundwater recharge and erosion control.
Core principles:
- Collect: capture rainfall or runoff at a catchment (roof, slope, watershed).
- Store: keep water for later use (cisterns, tanks, stepwells, ponds).
- Recharge: let some captured water percolate to raise groundwater (percolation tanks, infiltration pits).
- Conserve & manage: reduce evaporation and waste; community maintenance.
Common traditional/local systems (summary):
- Johads: earthen check-dams/ponds in north-west India (Rajasthan, Haryana). Capture monsoon runoff and recharge groundwater; often community-managed.
- Tanks / Eris / Kulams: reservoirs in South India that store runoff for irrigation and domestic use; historically formed linked tank systems in river basins.
- Stepwells (baolis/vavs): excavated wells with steps leading down to the water surface; store water and provide access even in dry seasons.
- Tankas / Cisterns: household or community underground storage (common in arid Rajasthan) to store roof and runoff water.
- Anicuts / Weirs: low diversion structures across streams to raise water levels and divert flow into canals/tanks.
- Karez / Qanat: underground galleries that tap groundwater and convey it by gravity to settlements—used in arid regions to reduce evaporation losses.
- Contour bunds, nala bunds, check dams, percolation tanks: small structures on slopes and streams to slow runoff, reduce erosion and improve infiltration.
Benefits: recharge groundwater, provide local water security, reduce flood peak and soil erosion, low cost, culturally appropriate and maintainable by local communities.
Limitations & design considerations: depend on rainfall regime and catchment, risk of siltation, require periodic maintenance, social cooperation, and site-specific design (soil permeability, slope, land use).
How they work together with modern measures: Traditional systems are often integrated with modern rainwater-harvesting (roof harvesting, recharge wells), watershed management, and legal/institutional support to scale benefits (e.g., link dozens of johads to revive streams).
- Johads in Alwar district (Rajasthan) — community-built johads and revival work by Tarun Bharat Sangh led to recharging groundwater, restoring wells and reviving the Arvari river.
- Kallanai (Grand Anicut) on the Kaveri (Tamil Nadu) — an ancient stone diversion weir (2,000+ years old) that regulates flow for irrigation tanks downstream.
- Stepwells such as Rani ki Vav (Patan, Gujarat) and Chand Baori (Abhaneri, Rajasthan) — seasonal storage and access to groundwater with architectural cooling benefits.
- Tank cascades in South India (historic tank systems in Tamil Nadu and Andhra Pradesh) — networked tanks that store monsoon runoff for irrigation and recharge.
- Tankas (underground household cisterns) in Jaisalmer and other Thar settlements — store roof/runoff with minimal evaporation loss, used for drinking and domestic needs.
- Runoff volume captured (basic): V = A × P × C - V = volume captured (m3) - A = effective catchment area (m2) - P = rainfall depth over period (m) (e.g., 500 mm = 0.5 m) - C = runoff coefficient (dimensionless, 0–1; roof ≈ 0.8–0.95; bare rocky slope ≈ 0.6–0.8; vegetated soil ≈ 0.1–0.3) Example: 100 m2 roof, 500 mm annual rainfall, C = 0.85 → V = 100 × 0.5 × 0.85 = 42.5 m3 = 42,500 liters.
- Sizing storage to meet demand: A_required = D / (P × C) - D = required volume over the period (m3) - Solve for A to estimate catchment area needed to meet demand given rainfall and runoff coefficient.
- Simple supply-days storage: S = Qd × N - S = storage required (m3) - Qd = daily demand (m3/day) - N = days of autonomy desired (days) Use a safety factor (e.g., 1.2–1.5) to allow for evaporation and losses.
River Basin Planning and Integrated Water Resources Management
What is a river basin and why plan it?
A river basin (catchment) is the land area drained by a river and its tributaries. River basin planning means managing all uses of water in the basin—domestic supply, irrigation, industry, hydropower, ecology and flood control—in an integrated, coordinated way so that available water is used sustainably and equitably.
Integrated Water Resources Management (IWRM) — core idea
- IWRM is a process that promotes the coordinated development and management of water, land and related resources across sectors and stakeholders to maximize economic and social welfare without compromising ecosystems.
- Key principles: basin-level planning, integrated surface + groundwater management, participation of users and states, equity, sustainability, and economic efficiency.
Steps in river basin planning (typical)
- Assessment: map basin, measure rainfall, streamflow, groundwater, land use and water demand (domestic, irrigation, industry, environment).
- Water balance and forecasting: estimate available water and future needs under scenarios (population growth, climate change).
- Set objectives and allocation rules: priorities for drinking water, environment, irrigation, industry.
- Identify and evaluate options: structural (dams, reservoirs, canals, check dams) and non-structural (demand management, pricing, watershed treatment, rainwater harvesting).
- Design institutional arrangements: basin authorities, inter-state cooperation, stakeholder committees and monitoring systems.
- Implementation, monitoring and adaptive management: track performance, update plans with new data.
Common measures used in basin-level IWRM
- Conjunctive use of surface and groundwater (use both to meet demand and reduce stress).
- Watershed management: afforestation, soil conservation, check dams to improve recharge and reduce floods.
- Demand management: efficient irrigation (drip, sprinkler), canal lining, leak reduction, metering and pricing.
- Environmental flows: maintain minimum flows for ecosystems and fisheries.
- Wastewater treatment and reuse for industry/irrigation to reduce freshwater demand.
Advantages of basin planning & IWRM
- Optimum use of available water across sectors and seasons.
- Reduced conflicts between users and states by agreed allocation rules.
- Improved drought and flood management by coordinated storage and release decisions.
- Protection of ecosystems and long‑term sustainability of water resources.
Challenges
- Institutional fragmentation (different agencies for irrigation, power, drinking water).
- Inter‑state or transboundary disputes over river water.
- Data gaps and uncertain future climate/hydrology.
- Cost, financing and social impacts (resettlement for large projects).
How it fits Class 10 syllabus
This topic connects geography, civics and economics: understanding physical processes (runoff, storage), administrative arrangements (river basin organisations, inter-state councils) and economic choices (allocation, investment in infrastructure vs demand management).
- Bhakra-Nangal (Sutlej) — a multipurpose river basin project in India used for irrigation, hydropower and flood control; shows large-scale basin planning to supply water across several states.
- Sardar Sarovar Project (Narmada) — large storage reservoir and canal network intended for irrigation, drinking water and power; illustrates benefits and social/environmental controversies around basin projects.
- Namami Gange / Ganga Basin initiatives — coordinated basin-level efforts to clean and maintain environmental flows for the river along with sewage treatment and pollution control.
- Murray–Darling Basin Plan (Australia) — an international example of IWRM where water allocations, environmental flows and trading schemes are managed across states to balance farming and ecosystems.
- Watershed development in Rajasthan (local scale) — series of check dams, percolation tanks and afforestation increased groundwater recharge and reduced drought impacts; example of non-structural/ decentralized IWRM measures.
- Simple water balance: P = Q + ET + ΔS (Precipitation = Runoff + Evapotranspiration + Change in storage)
- Runoff (volume) ≈ Rainfall (m) × Area (m²) × Runoff coefficient (C). Example: Q = P × A × C
- Per capita water availability = Total available water (volume/year) / Population
- Irrigation efficiency (%) = (Water beneficially used by crop / Water diverted or applied) × 100
- Required reservoir storage (simplified) ≈ Annual inflow − Annual demand (plus margin for reliability and evaporation losses)
Inter-state and International Water Conflicts
What it means
Inter-state and international water conflicts arise when two or more political units (states within a country or different countries) compete for the limited water available from the same river, aquifer or waterbody. Conflicts occur most often when an upstream user builds dams/diverts water, reducing quantity or quality for downstream users.
Why these conflicts happen
- Uneven spatial distribution: Rivers and rainfall are not evenly distributed; some regions receive more water than others.
- Seasonal variability: Monsoons and seasonal flows cause periods of scarcity.
- Upstream vs downstream interests: Upstream users benefit from storage/diversion, downstream users lose flow and face water shortages.
- Increasing demand: Population growth, agriculture and industry increase water needs.
- Infrastructure projects: Dams, barrages and inter-basin transfers change flows and sediment loads.
- Climate change: Alters timing and volume of flows, increasing uncertainty.
Consequences
Reduced agricultural production, drinking water shortages, ecosystem damage (reduced river flow, wetlands loss), social tensions, displacement, and strained political or diplomatic relations.
How conflicts are managed
- Legal and institutional mechanisms: tribunals, river basin organisations, interstate councils.
- Treaties and agreements: formal water-sharing treaties with specified allocations and rules.
- Technical solutions: improved water-use efficiency, storage management, coordinated reservoir operation, data and flow monitoring.
- Policy measures: demand management, groundwater regulation, watershed development and rainwater harvesting.
- International principles: equitable and reasonable utilization, obligation not to cause significant harm, prior notification of planned measures (reflected in customary law and documents such as the 1997 UN Watercourses Convention principles).
Important institutions and tools
Permanent river commissions (e.g., Permanent Indus Commission), national tribunals (water dispute tribunals), joint technical committees, and independent arbitration or mediation backed by international organisations.
Class 10 focus
Understand causes, major real-life examples, impacts and basic solutions (sharing agreements, tribunals, cooperative management). Emphasise how upstream actions affect downstream users and why cooperation and legally binding agreements are often necessary.
- Cauvery water dispute (India): A long-standing inter-state conflict between Karnataka and Tamil Nadu over reservoir releases and irrigation needs; decided through tribunals and courts with periodic supervisory arrangements.
- Krishna and Godavari disputes (India): Inter-state differences over allocation among riparian states; managed through tribunals and agreements.
- Indus Waters Treaty (India and Pakistan, 1960): An international treaty brokered with World Bank assistance allocating rivers between the two countries and establishing the Permanent Indus Commission for dispute resolution.
- Ganges (India–Bangladesh): Tensions around flows and the Farakka Barrage led to the 1996 Ganges Water Treaty that provides a time-bound sharing schedule during dry months.
- Nile Basin (Egypt, Ethiopia, Sudan, others): The Grand Ethiopian Renaissance Dam (GERD) has raised disputes over downstream flow impacts for Sudan and Egypt; negotiations continue under regional and international facilitation.
- Mekong River (China and downstream Southeast Asian countries): Upstream damming affects seasonal flood pulses and fisheries downstream, causing ecological and livelihood concerns.
- Per capita water availability = Total renewable water (m3 per year) / Population (number). Units: m3/person/year.
- Discharge (flow) Q = A × v, where Q is flow (m3/s), A is cross-sectional area (m2), v is average velocity (m/s). Useful to estimate water volume passing a point.
- Runoff coefficient (C) = Runoff depth / Rainfall depth. Dimensionless; indicates how much rainfall becomes surface runoff.
- Water-use efficiency (%) = (Useful water output / Water input) × 100. For example, crop yield per unit irrigation water.
- Allocated share (%) = (Allocated water volume / Total available water volume) × 100.
Policy, Institutions and Legal Framework
Overview
The policy, institutional and legal framework for water resources defines who makes decisions, how water is allocated and managed, and which laws and policies control use, conservation and dispute resolution. In India the approach combines national policies, central and state institutions, local bodies and specific laws to manage surface and groundwater, inter‑state rivers, drinking water, irrigation and pollution control.
Key policy principles
- Integrated Water Resources Management (IWRM): manage water at the river‑basin scale considering multiple uses (irrigation, drinking, industry, environment).
- Priority and equity: give priority to drinking water and basic needs, and aim for equitable distribution across states, sectors and social groups.
- Demand management and efficiency: encourage water‑use efficiency (e.g., micro‑irrigation) and economic instruments (user charges) where appropriate.
- Decentralisation and participation: involve local bodies, Water Users’ Associations and communities in planning and management.
- Conservation and pollution control: protect water quality and recharge sources, and reduce wastage and contamination.
Main institutions and roles
- Ministry of Jal Shakti (Central) — policy leadership, national programmes and coordination of water sector functions at the centre.
- Central Water Commission (CWC) — technical advice on river basins, flood forecasting, dam safety and inter‑state water issues (technical wing).
- Central Ground Water Board (CGWB) — assessment, monitoring and management guidance for groundwater resources.
- National Water Mission / National Agencies — promote integrated management, data systems and national targets for water use efficiency and recharge.
- State Water Resources Departments and State Pollution Control Boards — implementation of policies, allocation within states, pollution control and local regulation.
- River Basin Organisations and River Boards — created or proposed to plan and manage whole river basins cutting across administrative boundaries.
- Local bodies, Panchayats and Water Users’ Associations — on‑ground operation, maintenance, distribution and participatory planning.
Legal framework (high‑level)
- Constitutional position: Water (other than interstate rivers) is a State subject (State List). The Centre has a role in inter‑state matters and national policy.
- Inter‑state disputes: Article 262 and the Inter‑State River Water Disputes Act provide legal mechanisms to adjudicate conflicts between states over river waters.
- Pollution and environment laws: The Water (Prevention & Control of Pollution) Act (1974) and the Environment (Protection) Act (1986) regulate quality and discharge standards to protect water resources.
- Sectoral and regulatory measures: Laws and rules govern groundwater use (state groundwater rules), dam safety, municipal water supply, and pricing/user‑charge frameworks. Courts and statutory tribunals also influence water law through judgments.
Implementation mechanisms
- River‑basin planning (allocation based on assessments of availability and needs).
- Watershed development and recharge projects to increase local availability (community participation).
- Urban water supply and sewage treatment standards to protect river and groundwater quality.
- Information, monitoring and data systems (gauging stations, groundwater monitoring) for evidence‑based decisions.
Major challenges
- Fragmented responsibilities between centre, states and local bodies leading to coordination gaps.
- Overextraction of groundwater and declining water tables in many regions.
- Inter‑state disputes and delays in adjudication of water sharing.
- Pollution and inadequate wastewater treatment reducing usable water supplies.
- Insufficient pricing and incentives for efficient water use in agriculture (largest consumer).
Summary
An effective policy, institutional and legal framework balances national guidance with state implementation and local participation; uses river‑basin planning, demand management and pollution control; and provides transparent dispute resolution. Strengthening coordination, data systems and community involvement are key to sustainable water management.
- Cauvery water dispute: a long‑running inter‑state conflict between Karnataka and Tamil Nadu illustrating how inter‑state allocation and tribunals/legal orders operate.
- Namami Gange / Ganga cleaning programmes: national policy and central funding combined with state implementation to reduce river pollution and restore flows.
- Groundwater depletion in Punjab and Haryana: local overextraction for irrigation showing need for state regulation, recharge measures and community participation.
- Jal Jeevan Mission: central policy to provide tap water to rural households implemented through state/local bodies and technology monitoring.
- Water Users’ Associations in watershed projects (e.g., parts of Andhra Pradesh/Gujarat): local institutions managing distribution, maintenance and minor repairs.
- Yamuna pollution in Delhi: urban sewage and industrial discharge regulated through pollution control laws and monitored by state and central bodies.
- Per capita renewable water availability = (Total renewable water resources in cubic metres per year) / (Population).
- Sectoral share (%) = (Water used by sector / Total water used) × 100.
- Water stress (%) = (Total annual freshwater withdrawals / Total renewable freshwater resources) × 100.
- Falkenmark indicator (thresholds): per capita renewable water < 1000 m3 = water scarcity; 1000–1700 m3 = water stress; > 1700 m3 = generally water secure.
Urban Water Supply and Sanitation
What it is: Urban water supply means providing safe, adequate and continuous water to homes, institutions and industries in towns and cities. Sanitation refers to safe disposal of human waste and wastewater, including collection, transport, treatment and safe reuse or disposal of sewage and fecal sludge.
Sources of urban water: Surface water (rivers, lakes, reservoirs), groundwater (wells, borewells), and reuse (treated wastewater, rainwater harvesting).
How supply works (main steps):
- Source intake (river/reservoir/well)
- Treatment: screening → coagulation & flocculation → sedimentation → filtration → disinfection (usually chlorination)
- Storage in overhead and ground reservoirs (equalisation and service reservoirs)
- Distribution through a piped network to consumers; metering and billing
Sanitation systems: On-site systems (septic tanks, pit latrines), centralized sewer networks leading to sewage treatment plants (STPs). Sewage treatment stages: primary (removal of solids), secondary (biological treatment: activated sludge/trickling filters), tertiary (nutrient removal, disinfection) and sludge handling.
Design standards and norms: Planners commonly use a per-capita water supply standard (for planning) — often 135 litres per capita per day (lpcd) for many Indian towns — to estimate supply requirements. Typically 70–90% of supplied water becomes wastewater that must be managed.
Major problems in urban areas: uneven distribution and shortage, intermittent supply, groundwater depletion, contamination from old/leaky pipes, non-revenue water (leakage and theft), insufficient sewer coverage, open defecation or public toilets without maintenance, inadequate sewage treatment causing river pollution and health hazards (cholera, typhoid, diarrhoea).
Solutions and good practices: piped continuous supply where feasible, water metering and tariff reforms, leakage detection and pipe replacement, rainwater harvesting and groundwater recharge, decentralised wastewater treatment for colonies, regular desludging and fecal sludge management, expansion and upgrading of STPs, reuse of treated wastewater for industry/landscaping, public awareness and safe hygienic behaviour.
Policy & programmes (examples): municipal reforms, investments under urban development schemes to expand piped supply and sanitation, community toilets and campaigns to end open defecation. Successful models include large-scale treatment and reuse projects and cities that reduced water losses and improved service coverage.
- Calculation example: A town with 100,000 people and planning norm 135 lpcd. Total daily water demand = 100,000 × 135 = 13,500,000 litres = 13,500 cubic metres per day. If 80% becomes sewage, sewage volume = 0.8 × 13,500 = 10,800 m3/day.
- Chennai water crisis (2019): severe surface water shortage and depleted groundwater led to strict water rationing, highlighting dependence on a few sources and need for rainwater harvesting and better storage.
- Delhi and the Yamuna: untreated and partially treated sewage discharge into the river illustrates inadequate sewerage coverage and the need for effective STPs and pollution control.
- Singapore's NEWater and wastewater recycling: an example of treating and reusing wastewater to meet urban water needs, reducing dependence on raw freshwater sources.
- Total daily water demand (litres/day) = population × per capita supply (lpcd). Example: P × q (where q is in litres/person/day).
- Total daily water demand (m3/day) = population × lpcd / 1000.
- Estimated sewage generation (m3/day) = sewage coefficient × water supplied. Commonly used sewage coefficient ≈ 0.7–0.9 (use 0.8 as typical).
- Non‑Revenue Water (NRW) % = (Water produced − Water billed) / Water produced × 100.
- Storage requirement (basic) (m3) ≈ population × lpcd × hours of non-supply / 24 (used to size equalizing reservoirs for intermittent supply).
Sustainable Water Use and Community Action
Sustainable Water Use and Community Action
Sustainable water use means meeting present water needs without compromising availability for future generations. It balances supply (rainfall, rivers, groundwater) and demand (domestic, agricultural, industrial, environmental) by using resources efficiently, replenishing aquifers, and reducing pollution and waste.
Key principles
- Reduce demand: Use water-saving technologies, change irrigation and household practices, fix leaks and reuse treated wastewater.
- Increase supply responsibly: Harvest rainwater, recharge groundwater, maintain catchments and wetlands.
- Protect quality: Prevent pollution from sewage, industries and agriculture and ensure safe drinking water.
- Equity and participation: Share water fairly across users and involve local communities in planning and management.
Community action — why it matters
Local communities live with local water problems and are best placed to plan and maintain small-scale solutions. Community actions create ownership, reduce conflicts and tailor solutions to local hydrogeology and customs. Examples of community roles:
- Organising rainwater harvesting and storage.
- Building and maintaining check dams, percolation tanks and contour trenches to enhance recharge.
- Setting rules for groundwater withdrawal and irrigation scheduling.
- Monitoring water quality and levels and conducting awareness campaigns.
Common sustainable practices
- Water-efficient irrigation: Drip and sprinkler systems, scheduling irrigation based on crop need, mulching to reduce evaporation.
- Rainwater harvesting: Rooftop capture, recharge pits, recharge shafts and surface storage that recharge aquifers rather than only storing for surface use.
- Watershed management: Contour bunds, afforestation, gully plug, and soil-conservation measures that slow runoff and increase infiltration.
- Wastewater reuse and treatment: Greywater reuse for gardening, decentralized treatment to reduce pollution and augment supply.
- Policy and pricing: Tariff structures, allocation rules, and incentives for efficient use.
Monitoring and indicators
Communities and planners use simple measurements to monitor sustainability: groundwater level trends, per capita water availability, frequency of water shortages, area under micro-irrigation, and water quality indicators (e.g., salinity, coliform counts).
How to implement a community water programme (step-wise)
- Assess: Map water sources, uses and problems (seasonal shortage, pollution, over-extraction).
- Plan: Prioritise low-cost, high-impact interventions (check dams, rainwater harvesting, water-saving tech).
- Mobilise: Form a water committee with clear rules, roles and maintenance plan.
- Execute: Use local labour and materials; combine traditional knowledge with technical designs.
- Maintain and adapt: Regular inspection, desilting, rule enforcement and adapting to changing rainfall or demand.
When communities manage water sustainably they increase resilience to droughts and floods, improve crop yields, secure drinking water, and foster social cohesion and better livelihoods.
- Ralegan Siddhi, Maharashtra: Village-led watershed development and soil-water conservation (contour trenches, check dams, afforestation) revived groundwater, increased cropping intensity and reduced migration.
- Johads in Alwar (Tarun Bharat Sangh work, Rajasthan): Construction and repair of traditional earthen tanks (johads) recharged aquifers and restored rivers, improving water availability for villages.
- Chennai municipal rainwater harvesting policy: After severe water shortages, municipal enforcement of rooftop harvesting and public recharge structures helped augment groundwater and reduce acute shortages.
- Hivre Bazar, Maharashtra: Community labour and strict water management (crop choices, drip irrigation, watershed measures) transformed a drought-prone area into a water-secure village.
- Community-managed Pani Samitis in many Indian villages: Local water-user committees set equitable water schedules, maintain distribution systems and resolve conflicts between farmers.
- Per capita water availability (m3/person/year) = Total renewable freshwater supply (m3/year) / Population
- Rooftop rainwater capture (litres) = Rainfall (mm) × Roof area (m2) × Runoff coefficient (typically 0.7–0.9). Note: 1 mm on 1 m2 = 1 litre.
- Rainfall-runoff volume (m3) = Rainfall depth (m) × Catchment area (m2) × Runoff coefficient
- Estimated groundwater recharge (m3) = Rainfall (m) × Rechargable area (m2) × Recharge coefficient (fraction of rainfall that percolates)
- Simple water balance for a community aquifer: ΔS = Recharge − Extraction ± Lateral flow, where ΔS is change in stored groundwater volume
Climate Change and Water Resources
Overview: Climate change refers to long-term shifts in temperature, precipitation patterns and frequency/intensity of extreme weather due to human-induced increases in greenhouse gases. These changes directly alter the water cycle (evaporation, condensation, precipitation, runoff, infiltration and storage) and thereby affect availability, timing and quality of water resources.
How climate change affects water resources:
- Changes in precipitation patterns: Some regions receive more intense rainfall while others face reduced and more erratic rainfall. This increases flood risk in some places and drought risk in others.
- Glacier and snowpack melt: Warmer temperatures cause earlier snowmelt and accelerated glacier retreat. Rivers fed by glaciers (e.g., Himalayan rivers) may show higher flows in the short term and reduced dry‑season flows in the long term.
- Increased evapotranspiration: Higher temperatures raise evaporation from soils, reservoirs and transpiration from plants, reducing effective water availability for crops and human use.
- Groundwater recharge and levels: Changes in rainfall intensity, land use and evapotranspiration alter infiltration and recharge. Heavy downpours often run off, reducing recharge; prolonged dry periods lower groundwater tables.
- Sea-level rise and salinization: Rising seas push saltwater into coastal aquifers and estuaries, contaminating freshwater sources and farmland.
- Water quality impacts: Higher temperatures and altered flows worsen water quality by concentrating pollutants, fostering algal blooms and reducing oxygen levels.
- More frequent/extreme events: Floods and droughts become more frequent and intense, stressing infrastructure, agriculture and water supply systems.
Socioeconomic and ecological consequences: Reduced and unreliable water supply affects agriculture (crop yields and sowing/harvest timings), hydropower generation, municipal supply, industry and sanitation. Vulnerable populations (small farmers, urban poor, coastal communities) face greatest risks. Ecosystems—rivers, wetlands and groundwater‑dependent habitats—may degrade or shift.
Adaptation and management strategies:
- Demand-side: water conservation, efficient irrigation (drip/sprinkler), pricing, leak reduction.
- Supply-side and storage: rainwater harvesting, small check dams, managed aquifer recharge, reservoirs designed for variable inflows.
- Integrated Water Resource Management (IWRM): combining land-use, watershed protection and coordinated allocation across sectors.
- Early warning and disaster management: improved flood forecasting, drought preparedness and resilient infrastructure.
- Coastal protection: mangrove restoration, seawalls and managed retreat where necessary to reduce salinization risks.
- Mitrigation link: reducing greenhouse gas emissions to limit long-term impacts on the water cycle.
Class‑10 perspective (practical points): Understand the link between changing rainfall patterns and local water problems (floods, drought, groundwater decline). Learn examples from local/regional news, and connect simple water budgeting ideas (supply vs demand) to manage water sustainably.
- Melting Himalayan glaciers: Short-term increase in river flows (e.g., some tributaries of the Ganga) followed by long-term reduction of dry-season flows affecting irrigation and hydropower.
- Kerala floods (2018, 2019): Extreme monsoon rainfall and poor catchment management led to severe floods, showing how intense precipitation events increase flood risk.
- Droughts in Marathwada and Vidarbha (Maharashtra): Erratic monsoon and higher temperatures reduced soil moisture and groundwater, harming crops and livelihoods.
- Salinity intrusion in Sundarbans and coastal Andhra Pradesh: Rising sea levels and storm surges push saltwater into freshwater aquifers and croplands.
- Reduced water quality in lakes and reservoirs: Higher temperatures and low flows in summer lead to algal blooms, affecting drinking water treatment and aquatic life.
- Urban flooding in Mumbai and Chennai: Increased intense rainfall events overwhelm drainage systems, causing recurring urban water crises.
- Simple water balance (catchment scale): P = Q + ET + ΔS (where P = precipitation, Q = runoff/streamflow, ET = evapotranspiration, ΔS = change in storage including soil moisture and groundwater).
- Per capita renewable water availability: W_pc = W_total / Population (W_total = total renewable freshwater resources; units e.g., cubic metres per year per person).
- Runoff coefficient (average): C = Q / P (for volumes over same area and time; gives fraction of precipitation that becomes runoff).
- Approximate groundwater recharge (simple estimate): Recharge ≈ P × A × r (P = mean precipitation depth, A = area, r = recharge fraction between 0 and 1 that depends on soil, land use and intensity of rainfall).
- Storage requirement (basic): Required storage ≈ Demand − Reliable inflow (used for planning reservoir/rainwater harvesting capacity to buffer variability).
Key Concepts
- Water resources
- Sources of water useful for humans, including surface water (rivers, lakes) and groundwater.
- Hydrological cycle
- Continuous movement of water between ocean, atmosphere and land through evaporation, condensation and precipitation.
- Watershed
- An area of land drained by a river and its tributaries; also called a drainage basin.
- Rainwater harvesting
- Collecting and storing rainwater for future use, often from rooftops or surface runoff.
- Groundwater
- Water stored below the earth's surface in pore spaces and fractures of soil and rocks.
- Aquifer
- A permeable rock or sediment layer that can store and transmit groundwater.
- Water table
- The upper surface of the saturated zone where soil or rock is fully filled with water.
- Groundwater recharge
- Process by which water percolates down from the surface to replenish aquifers.
- Irrigation
- Artificial application of water to land to assist crop growth.
- Canal irrigation
- Supplying water to fields through man-made channels or canals from rivers or reservoirs.
- Drip irrigation
- A water-efficient method delivering small amounts of water directly to plant roots through pipes and emitters.
- Sprinkler irrigation
- Irrigation method that sprays water over crops like rainfall using pipes and sprinklers.
- Well
- A dug or drilled hole in the ground used to access groundwater; can be shallow or deep.
- Tube well
- A deep, drilled well with a casing and pump to extract groundwater from aquifers.
- Multipurpose river project
- A large project (dam/reservoir) designed to serve irrigation, power generation, flood control and water supply together.
- Inter-basin transfer
- Moving water from one river basin to another to address regional water shortages.
- Water pollution
- Contamination of water bodies by harmful substances from domestic, industrial or agricultural sources.
- Water conservation
- Practices and measures to use water efficiently and reduce wastage.
- Flood control
- Measures to reduce the adverse effects of floods, such as embankments, dams and flood forecasting.
- Drought
- A prolonged period of deficient rainfall leading to water shortage and crop failure.
End-of-Chapter Trial Paper & Test Questions
Topic-wise questions to test your understanding of every concept in this chapter.
-
Describe the distribution of Earth's water and state how much is usable freshwater. / पृथ्वी के जल के वितरण का वर्णन करें और बताएं कि कितना उपयोगी मीठा जल है।
Show answer
About 97% of Earth's water is saline ocean water and only about 3% is freshwater; of this freshwater roughly two-thirds is locked in glaciers and ice caps and about one-third is groundwater, leaving less than 1% as readily usable surface water in rivers and lakes. / पृथ्वी का लगभग 97% जल खारा महासागरीय जल है और केवल लगभग 3% मीठा जल है; इस मीठे जल का लगभग दो-तिहाई हिमनदों और बर्फ की चादरों में बंद है और लगभग एक-तिहाई भूजल है, जिससे एक प्रतिशत से कम नदियों और झीलों में आसानी से उपयोग योग्य सतही जल बचता है।
-
Compare drip irrigation and flood irrigation in terms of water-use efficiency. / जल-उपयोग दक्षता के संदर्भ में ड्रिप सिंचाई और बाढ़ सिंचाई की तुलना करें।
Show answer
Drip irrigation delivers water slowly near the root zone through pipes and emitters, giving very high water-use efficiency, while flood irrigation floods the whole field and wastes much water through evaporation, runoff and percolation, causing low efficiency and possible waterlogging. / ड्रिप सिंचाई पाइप और एमिटर के माध्यम से जड़ क्षेत्र के पास धीरे-धीरे जल पहुंचाती है, जिससे बहुत उच्च जल-उपयोग दक्षता मिलती है, जबकि बाढ़ सिंचाई पूरे खेत में पानी भर देती है और वाष्पीकरण, बहाव तथा रिसाव से बहुत पानी बर्बाद करती है, जिससे कम दक्षता और जलभराव की संभावना होती है।
-
State two benefits and two problems of large multipurpose river projects. / बड़ी बहुउद्देशीय नदी परियोजनाओं के दो लाभ और दो समस्याएं बताएं।
Show answer
Benefits: they provide reliable irrigation and generate hydroelectric power while also controlling floods and supplying drinking water. Problems: they submerge land and forests displacing people, and cause reservoir siltation and changes in river ecology. / लाभ: वे विश्वसनीय सिंचाई प्रदान करती हैं और जलविद्युत उत्पन्न करती हैं तथा बाढ़ नियंत्रण और पेयजल आपूर्ति भी करती हैं। समस्याएं: वे भूमि और जंगल जलमग्न कर लोगों को विस्थापित करती हैं, और जलाशय में गाद जमाव तथा नदी पारिस्थितिकी में बदलाव पैदा करती हैं।
-
Define the water table and explain what causes groundwater depletion. / जल स्तर (वाटर टेबल) को परिभाषित करें और बताएं कि भूजल ह्रास किससे होता है।
Show answer
The water table is the upper surface of the saturated zone where all pores in soil and rock are filled with water; depletion occurs when withdrawal by pumping exceeds recharge over time, caused by intensive irrigation, rising demand, urbanisation reducing infiltration and droughts. / जल स्तर संतृप्त क्षेत्र की ऊपरी सतह है जहां मिट्टी और चट्टान के सभी छिद्र पानी से भरे होते हैं; ह्रास तब होता है जब समय के साथ पंपिंग द्वारा निकासी पुनर्भरण से अधिक हो जाती है, जो गहन सिंचाई, बढ़ती मांग, अंतःस्यंदन घटाने वाले शहरीकरण और सूखे के कारण होता है।
-
A hydropower plant has discharge Q = 50 m³/s, head H = 20 m, density ρ = 1000 kg/m³ and efficiency η = 0.8. Calculate the power generated. / एक जलविद्युत संयंत्र का निस्सरण Q = 50 m³/s, हेड H = 20 m, घनत्व ρ = 1000 kg/m³ और दक्षता η = 0.8 है। उत्पन्न शक्ति निकालें।
Show answer
P = η × ρ × g × Q × H = 0.8 × 1000 × 9.81 × 50 × 20 = 7,848,000 W ≈ 7.85 MW. / P = η × ρ × g × Q × H = 0.8 × 1000 × 9.81 × 50 × 20 = 7,848,000 W ≈ 7.85 मेगावाट।
-
Explain how waterlogging leads to salinization of soil. / समझाएं कि जलभराव मिट्टी के लवणीकरण की ओर कैसे ले जाता है।
Show answer
Excessive irrigation with poor drainage raises the water table near the surface; in dry climates high surface evaporation then draws this water up and the dissolved salts are left behind and accumulate in the topsoil, causing salinization that reduces crop growth. / खराब जल निकासी के साथ अत्यधिक सिंचाई जल स्तर को सतह के पास ऊपर ले आती है; शुष्क जलवायु में उच्च सतही वाष्पीकरण इस पानी को ऊपर खींच लेता है और घुले हुए लवण पीछे रह जाते हैं तथा ऊपरी मिट्टी में जमा हो जाते हैं, जिससे लवणीकरण होता है जो फसल वृद्धि घटाता है।
-
What is rainwater harvesting, and how did it help a village like Ralegan Siddhi? / वर्षा जल संचयन क्या है, और इसने रालेगण सिद्धि जैसे गांव की कैसे मदद की?
Show answer
Rainwater harvesting is capturing and storing rainwater through structures like check dams, johads and recharge pits to use directly or to recharge groundwater; in Ralegan Siddhi watershed management and rainwater harvesting raised groundwater levels and revived agriculture in a drought-prone area. / वर्षा जल संचयन बांध, जोहड़ और पुनर्भरण गड्ढों जैसी संरचनाओं के माध्यम से वर्षा जल को पकड़ने और संग्रहित करने की प्रक्रिया है ताकि सीधे उपयोग हो या भूजल पुनर्भरण हो; रालेगण सिद्धि में जलग्रहण प्रबंधन और वर्षा जल संचयन ने भूजल स्तर बढ़ाया और सूखाग्रस्त क्षेत्र में कृषि को पुनर्जीवित किया।
-
Why did groundwater levels fall sharply in Punjab and Haryana? / पंजाब और हरियाणा में भूजल स्तर तेजी से क्यों गिरा?
Show answer
Intensive cultivation of water-thirsty paddy under the rice–wheat rotation relied on large-scale extraction from tube wells; because withdrawal far exceeded natural recharge, water tables declined and wells had to be dug deeper, causing long-term depletion. / धान–गेहूं चक्र के तहत जल-गहन धान की गहन खेती ट्यूबवेल से बड़े पैमाने पर निकासी पर निर्भर थी; क्योंकि निकासी प्राकृतिक पुनर्भरण से कहीं अधिक थी, जल स्तर गिरा और कुओं को गहरा खोदना पड़ा, जिससे दीर्घकालिक ह्रास हुआ।
Related Laws & Principles
Explore allFoundational laws & principles behind this chapter. Each one opens a full page — what it says, why it matters, five practice questions and the mistakes to avoid.