Overview
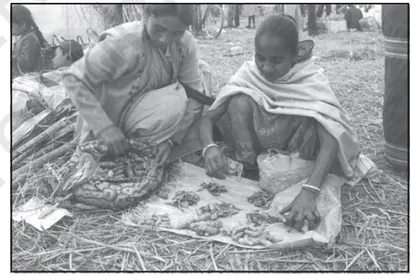
This chapter introduces International Trade as the exchange of goods, services and capital across national borders and places it in the context of the contemporary global economy. It explains why countries trade (comparative advantage, resource endowment and market access), describes the composition and direction of world and Indian trade, and shows how transport, communication and ports facilitate exchange. The chapter examines trade measures (tariffs, quotas, non-tariff barriers), the balance of payments and terms of trade, and the role of international institutions and agreements (WTO, regional trade blocs) in shaping trade patterns. Emphasis is given to the impacts of trade on development, regional disparities and employment, and to recent trends such as globalization and liberalization. Students will learn to interpret trade data, maps and charts, evaluate factors influencing trade flows, understand policy instruments and international rules, and assess the role of trade in India’s economy.
Learning Objectives
- Define international trade and distinguish it from domestic trade
- Explain the concepts of balance of trade and balance of payments with examples
- Differentiate between visible and invisible items in foreign trade
- Describe the direction and composition of world and Indian trade patterns
- Analyze factors influencing international trade such as comparative advantage, technology and factor endowments
- Apply the concept of terms of trade to assess gains from trade using simple index calculations
- Calculate and interpret export–import ratios, trade balance and net export values from given data
- Examine the role and functions of the World Trade Organization (WTO) and trade liberalization
Topics in this chapter
17 topics · tap a topic title to jump straight to it.
Nature and Importance of International Trade
Nature of International Trade
International trade is the exchange of goods and services across national borders. It is driven by differences in resource endowments, technology, labour, capital and preferences. Key characteristics include:
- Specialisation and comparative advantage: Countries specialise in producing goods/services they can produce relatively more efficiently and trade for others (David Ricardo's comparative advantage).
- Interdependence: Trade creates economic links — production, consumption and technology flows cross borders, forming global value chains.
- Visible and invisible trade: Visible trade is trade in physical goods (merchandise); invisible trade covers services (banking, tourism, IT) and transfers.
- Dynamic and evolving: Composition and direction of trade change with technology, tastes, policy and competitiveness (e.g., rise of manufactured exports from East Asia).
- Directional patterns: Trade often follows established routes and blocs (North–South, intra-EU, South–South), influenced by geography, history and trade agreements.
- Influence of policy and institutions: Tariffs, quotas, subsidies, trade agreements, and institutions (WTO, regional blocs) shape how trade flows.
Importance of International Trade
International trade is important for economic development and welfare. Main benefits are:
- Access to resources and products: Countries obtain raw materials, intermediate inputs and consumer goods they lack (e.g., oil-importing countries).
- Market expansion and economies of scale: Firms reach larger markets, lower unit costs, and innovate due to competitive pressure.
- Foreign exchange earnings: Exports generate foreign currency needed to pay for imports and service external debts.
- Employment and income generation: Export-oriented industries create jobs and increase incomes across sectors.
- Technology transfer and knowledge spillovers: Imports of capital goods, FDI and trade partnerships bring new technologies and skills.
- Efficient resource allocation: Trade allows countries to specialise according to comparative advantage, improving global efficiency.
- Price stabilisation and variety: International trade smooths seasonal shortages and offers consumers a greater variety of goods at competitive prices.
Costs and Risks
Trade can also bring challenges: dependency on imports (e.g., fuel), loss of domestic industries from import competition, trade deficits, vulnerability to external shocks and unequal gains if not managed by suitable policies.
Conclusion
International trade is a central feature of modern economies. It fosters growth, specialization, and welfare but requires prudent policies to manage distributional effects, external shocks and strategic sectors.
- India: Major IT and software services exports (invisible trade) and textile exports; large imports of crude oil to meet energy needs.
- China: Rapid expansion of manufactured exports (electronics, machinery) leading to trade surpluses and global supply-chain dominance.
- Saudi Arabia: Oil exports as the dominant export earning foreign exchange for the economy.
- United States: Large imports of consumer electronics and goods, persistent trade deficits with some trading partners.
- Apple Inc.: Global value chain where design is in the US, components produced in multiple countries and final assembly in East Asia — illustrating interdependence.
- Balance of Trade (BoT) = Value of Exports − Value of Imports
- Trade Openness (%) = (Exports + Imports) / GDP × 100
- Terms of Trade (ToT) = (Index of Export Prices / Index of Import Prices) × 100
- Export Growth Rate (%) = (Exports in current period − Exports in previous period) / Exports in previous period × 100
- Revealed Comparative Advantage (RCA) = (Country's exports of product i / Total exports of country) ÷ (World exports of product i / Total world exports)
Visible and Invisible Trade
Definition
Visible trade (also called merchandise trade) refers to the international exchange of physical goods — exports and imports of tangible products such as agricultural produce, minerals, manufactured goods and raw materials. Invisible trade refers to international transactions in services, income and unilateral transfers that do not involve a physical good — for example, tourism, banking, insurance, shipping services, software exports, royalties, remittances and investment income (dividends, interest).
Components
- Visibles: exports and imports of tangible goods (food, fuel, machinery, textiles, electronics, etc.).
- Invisibles: services (transport, travel/tourism, financial services, insurance, software, consulting), primary income (dividends, interest, wages earned abroad) and secondary income (remittances, gifts, grants).
How they are recorded
In national accounts and the balance of payments (BoP), visible transactions appear under the merchandise (goods) account; invisible transactions appear under the services account, primary income and secondary income. Visibles are usually recorded at customs (clearance documents); invisibles are recorded from bank records, invoices and administrative data, so they may be harder to measure precisely.
Economic significance
- Balance of trade: Visible trade determines the merchandise trade balance (a major part of the current account). A deficit in visibles can be offset by a surplus in invisibles and vice versa.
- Structural insight: Economies that export mostly goods (e.g., oil, manufactured items) rely on visibles; countries with strong financial, IT or tourism sectors rely heavily on invisibles.
- Volatility and resilience: Commodity-based visible exports can be price-volatile; invisibles like software exports or remittances can provide stable foreign-exchange flows.
Measurement & relationship
- Merchandise (visible) exports and imports are summed to give visible receipts and payments.
- Invisibles are aggregated into invisible receipts and invisible payments (services, income, transfers).
- The overall current account combines visibles and invisibles (plus net transfers) to show a country’s net external position on current transactions.
Differences at a glance
- Visibles: Tangible, documented through customs, often price/volume sensitive.
- Invisibles: Intangible, recorded through service invoices and financial flows, often linked to human capital and financial markets.
Practical implications for policy
- Countries with visible deficits may promote exports of goods or strengthen invisibles (tourism, services, remittances) to correct the external imbalance.
- Exchange rate, trade policy, and investment in skills/infrastructure affect both visibles and invisibles differently.
Limitations
Invisible flows are often under-recorded or subject to estimation errors (e.g., informal remittances, cross-border digital services). Changes in classification (digitalization of services) also complicate time-series comparisons.
- Saudi Arabia: Large visible exports of crude oil (merchandise) generate the bulk of foreign-exchange earnings.
- India: Major invisible receipts from IT/BPO services, software exports, and remittances from migrants; also exports manufactured goods (visibles).
- Switzerland and Luxembourg: Significant invisible earnings from banking and financial services (fees, asset management).
- Thailand and Spain: Substantial invisible receipts from tourism (travel services) that support the current account.
- Germany and Japan: Strong visible exports of cars, machinery and electronics contributing to large merchandise surpluses.
- Philippines: Large invisible inflows in the form of remittances from overseas workers supporting household consumption and the balance of payments.
- Balance of Trade (Merchandise) = Visible exports − Visible imports
- Net Invisibles = Invisible receipts − Invisible payments
- Current Account Balance ≈ (Visible exports − Visible imports) + (Invisible receipts − Invisible payments) + Net unilateral transfers
- Merchandise Trade Share = Visible exports / Total exports (useful to gauge dependence on goods)
Basis and Theories of International Trade
Introduction
International trade is the exchange of goods and services across national borders. It is guided by economic advantages and shaped by historical, political and physical factors. Theories of international trade explain why trade occurs, which goods countries export or import, and how trade affects welfare.
1. Basis of International Trade
- Complementarity: Trade occurs when one country has a surplus or can produce a good and another country has demand for it. For example, oil-rich countries supply crude oil while other countries demand energy.
- Differences in Resource Endowments: Differences in land, labour, capital and natural resources (factor endowments) lead countries to specialise. Eg. Saudi Arabia (oil), Bangladesh (labour-intensive textiles).
- Differences in Technology and Productivity: Countries with better technology or higher productivity can produce some goods more cheaply (absolute advantage). Eg. Germany’s precision engineering.
- Price and Cost Differences: Lower production or transport costs create trade opportunities — firms import when foreign prices including transport are lower.
- Demand Conditions and Consumer Preferences: Cultural ties, language and tastes influence trade patterns (e.g., Indian films in South Asia, British food imports in former colonies).
- Government Policies and Trade Agreements: Tariffs, quotas, trade blocs (EU, ASEAN) and bilateral agreements shape trade flows.
- Historical and Geographical Factors: Colonial links, proximity, and transport networks (ports, canals) support trade relationships.
2. Classical and Modern Theories of International Trade
Mercantilism (historical)
Viewed exports as desirable and imports as harmful; aimed at accumulating bullion. Modern economics rejects mercantilism because it ignores mutual gains from trade.
Absolute Advantage (Adam Smith)
Definition: A country has an absolute advantage if it can produce a good using fewer resources (or more output with the same resources) than another country. Smith argued nations should specialise in goods they produce most efficiently and trade the rest.
Assumptions: Two countries, two goods, labour is only input, no transport costs, full employment.
Comparative Advantage (David Ricardo)
Definition: Even if one country is less efficient in producing all goods, trade can be beneficial if countries specialise according to lower opportunity cost. Comparative advantage is based on relative, not absolute, productivity.
Key idea: Each country should specialise in the good for which it has the lowest opportunity cost and trade for others.
Haberler / Opportunity Cost Formulation
Haberler restated Ricardo’s theory using the concept of opportunity cost — trade depends on relative opportunity costs, not labour values specifically.
Heckscher–Ohlin (Factor Endowment) Theory
Definition: Countries export goods that intensively use their abundant factors and import goods that intensively use their scarce factors. Example: Labour-abundant countries export labour-intensive goods; capital-abundant countries export capital-intensive goods.
Assumptions: Two countries, two goods, two factors (labour & capital), identical technologies, factor mobility within but not between countries.
Other Modern Ideas (brief)
- Product Life-Cycle Theory (Vernon): Products go through introduction, maturity and standardisation stages. Production may move abroad as a product matures and production becomes routine.
- New Trade Theory: Increasing returns to scale, network effects & differentiated products explain intra-industry trade among similar countries (e.g., automobile trade among EU countries).
- Leontief Paradox (empirical): US exports were more labour-intensive than expected given US capital abundance — showing limitations of simple H-O predictions.
3. Gains from Trade & Terms of Trade
Specialisation and trade allow consumption beyond a country's production possibility frontier (PPF). The terms of trade (ToT) determine how gains from trade are shared.
Terms of trade formula: ToT = (Index of export prices / Index of import prices) × 100 or simply (Price of exports ÷ Price of imports) × 100.
4. Assumptions and Limitations of Key Theories
- Ricardo & H–O assumptions: Simplifying assumptions (two goods, two countries, no transport costs, perfect competition) limit real-world applicability.
- Ignoring scale and technological change: Classical theories don’t account well for economies of scale, differentiated products, trade policies, and dynamic comparative advantage from learning and innovation.
- Distributional effects: Trade may benefit a country overall but creates winners and losers within a country (workers in import-competing industries may lose).
5. Practical relevance
These theories guide trade policy, negotiation positions, and understanding of why countries export and import particular goods. Policymakers use them to design tariffs, trade agreements, and industrial policies.
Summary: International trade bases are resource differences, technology, and demand. Theories — from absolute and comparative advantage to Heckscher–Ohlin and modern trade theories — explain patterns and benefits of trade, each with specific assumptions and limitations.
- Ricardian numerical example: Country A (England) and Country B (Portugal) produce cloth and wine. If England needs 100 labour hours for 1 unit cloth and 120 for 1 unit wine, while Portugal needs 90 hours for cloth and 80 for wine, Portugal has absolute advantage in both. But Portugal’s opportunity cost of producing 1 cloth = 90/80 = 1.125 units of wine; England’s cost = 100/120 = 0.833 units of wine. England has comparative advantage in cloth (lower opportunity cost) and Portugal in wine — both benefit by specialising and trading.
- India’s IT services: India specialises in IT and software services because of an abundant, skilled, English-speaking workforce. This reflects comparative advantage and factor endowment (skilled labour).
- Saudi Arabia & crude oil: Saudi Arabia exports oil because of natural resource abundance (absolute advantage in oil extraction); oil-importing countries import because they lack this endowment.
- Bangladesh textiles: Labour-abundant Bangladesh exports labour-intensive ready-made garments reflecting a Heckscher–Ohlin pattern (exporting goods that use its abundant factor — unskilled labour).
- Germany’s specialised machinery and automobiles: Germany exports capital- and technology-intensive goods consistent with its capital abundance and skilled workforce; intra-industry trade with other developed countries arises from product differentiation.
- Terms of Trade (ToT) = (Index of Export Prices / Index of Import Prices) × 100
- Opportunity Cost of producing Good X = (Units of Good Y forgone) / (Units of Good X produced)
- Comparative Advantage condition (using labour per unit): Country A has comparative advantage in Good X if (labour hours_A per X / labour hours_A per Y) < (labour hours_B per X / labour hours_B per Y)
- PPF slope = opportunity cost = (maximum units of Y forgone) / (units of X gained)
Direction and Structure of World Trade
Overview
World trade refers to the exchange of goods and services across international borders. Two important aspects are the direction of trade (who trades with whom and in which direction flows go) and the structure of trade (what types of goods and services are traded, and how trade is organized among countries and firms).
Direction of World Trade
Direction of trade is shaped by geography, resource endowments, historical links, price and demand patterns, trade policies and transport costs. Main directional patterns are:
- North–North trade: high-value manufactured goods and services exchanged among developed economies (e.g., EU–US, EU–Japan).
- North–South and South–North trade: developed countries importing commodities/raw materials and exporting capital-intensive manufactures and services.
- South–South trade: growing trade among developing countries (e.g., China–ASEAN, India–Africa, Brazil–Africa).
- Regional/intra-bloc trade: large volumes within trade blocs (EU, ASEAN, USMCA) due to tariff-free access and integrated supply chains.
- Eastward shift: rapid rise of Asian countries, especially China, in the export of manufactured goods and intermediate inputs.
Structure of World Trade
Structure refers to the composition (by product and by sector) and the organization (value chains, MNCs) of trade:
- Product composition: historically primary commodities dominated, but since industrialization manufactured goods make up the bulk of merchandise trade. Services (IT, finance, transport, tourism) have grown fast.
- Stages of production: increasing importance of intermediate goods and global value chains (GVCs) — parts cross several borders before final assembly.
- Technological content: manufactured exports range from low-tech (garments) to high-tech (electronic goods, aerospace).
- Concentration and diversification: some countries specialize (oil exporters, agricultural exporters), others have diversified manufacturing and services exports.
Determinants and Recent Trends
Key determinants: resource endowments, labour costs, technology, transport and communication improvements, trade policies, foreign direct investment (FDI) and MNC activity, economic blocs and trade agreements. Recent trends include:
- Rise of China and East Asia as export hubs and sources of intermediates.
- Growth in trade in services (IT, finance, business services).
- Expansion of global value chains and fragmentation of production.
- Increased intra-regional trade and South–South linkages.
- Occasional disruptions from trade tensions, protectionism, pandemics that alter flows and prompt regional reshoring.
Implications
Direction and structure affect development opportunities (market access, employment in export sectors), vulnerability to external shocks (commodity price volatility, demand shifts), and policy choices (diversification, industrial policy, trade negotiation priorities).
- China: world's largest merchandise exporter — dominated by manufactured goods and intermediate inputs used in global value chains (electronics, machinery, textiles).
- European Union: high-volume intra-regional trade in machinery, chemicals, vehicles and services between member states (Germany exports machinery to France; intra-EU trade is a large share of members' trade).
- United States: large exporter of services (financial, IT, intellectual property) and advanced manufactured goods; imports consumer goods and intermediate components.
- India: major exporter of services (software, IT-enabled services) and pharmaceuticals; garments and textiles are important merchandise exports.
- OPEC countries (e.g., Saudi Arabia): trade structure dominated by oil exports (primary commodity specialization), vulnerable to price swings.
- Bangladesh: export structure dominated by garments (labour-intensive manufactures), showing how low-cost labour shapes trade direction.
- Trade Balance = Exports − Imports
- Trade Openness (%) = (Exports + Imports) / GDP × 100
- Export Intensity (%) = Exports / GDP × 100
- Import Intensity (%) = Imports / GDP × 100
- Terms of Trade (ToT) = (Index of Export Prices / Index of Import Prices) × 100
- Gravity Model (basic form): Tij = G × (Mi × Mj) / Dij^β (Tij = trade flow between i and j; Mi, Mj = economic mass, often GDP; Dij = distance; G, β are constants)
India's Foreign Trade: Pattern, Composition and Direction
Overview
India's foreign trade covers the export and import of goods and services. Over decades it has transformed from a primary‑commodity dominated trade to a more diversified structure with rising manufactured goods and services (especially IT and business services). Trade direction has also shifted — continued ties with traditional partners in Europe and North America while Asia and the Middle East have grown in importance.
Pattern of Trade
- Historical trend: Pre‑1991 trade was restricted and focused on primary commodities and a few manufactured items. The 1991 liberalisation opened markets, deregulated trade, and encouraged export diversification.
- Growth and volatility: Exports and imports have grown strongly in absolute terms. Merchandise trade often shows a deficit (imports > exports) while services typically show a surplus.
- Trade openness: The ratio (Exports + Imports)/GDP rose after liberalisation and with globalisation, indicating stronger integration into world trade.
Composition of Trade
- By commodity/industry: Exports now include engineering goods, petroleum products, gems & jewellery, textiles and garments, pharmaceuticals, and agricultural products (rice, spices). Imports are dominated by crude oil & petroleum products, gold and precious stones, electronic goods, machinery, chemicals and fertilisers.
- Goods vs Services: Services (IT/ITES, software, professional & financial services) have become a major export earner and help offset the merchandise trade deficit.
- Value addition: Movement from raw materials to value‑added manufactures and knowledge services has raised export earnings and employment in some sectors.
Direction of Trade
- Regional pattern: Asia (China, ASEAN, Middle East), Europe (EU countries), North America (USA), and Africa are important regions. Asia and the Middle East have grown rapidly as sources of imports and as markets for exports.
- Key partners: Major partners include the USA (large services market), China (major import source of electronics, machinery, inputs), UAE and Saudi Arabia (energy trade and re‑exports), EU member states (manufactured and service links) and neighbouring countries (Bangladesh, Nepal, Sri Lanka) for agricultural and manufactured goods.
Factors Influencing Pattern, Composition & Direction
- Natural resource endowments (e.g., limited oil → import dependence on energy).
- Comparative advantage in services and certain manufacturing sectors.
- Trade policy and agreements (liberalisation since 1991, FTAs, WTO rules).
- Infrastructure, logistics, and firm competitiveness.
- Exchange rate movements and global commodity prices (oil, gold).
Impacts
- Trade affects GDP growth, employment, foreign exchange reserves and balance of payments. A persistent merchandise deficit must be financed by services surplus, remittances, or capital inflows.
- Policy responses include export promotion schemes, SEZs, Make in India, incentives for services, and negotiations for market access.
Policy and Recent Developments
Post‑1991 reforms, export promotion councils, SEZs, and a focus on services exports (IT/ITES, pharmaceuticals) have been central. Recent emphasis includes diversification of markets (reducing over‑reliance on any single partner), import substitution for strategic items, and trade facilitation measures (digital port papers, GST harmonisation for exports).
Sources commonly used for data and trends: Directorate General of Commercial Intelligence & Statistics (DGCI&S), Ministry of Commerce & Industry, Reserve Bank of India, World Bank, WTO.
- Crude oil imports from Saudi Arabia, UAE and other Middle Eastern countries — India imports the majority of its petroleum needs, affecting the merchandise trade deficit when oil prices rise.
- IT and software services exports to the United States and Europe (companies like TCS, Infosys, Wipro) — services surplus helps finance goods deficit.
- Textile and garment exports to the EU and North American markets — traditional manufactured export sector employing millions.
- Gems & jewelry exports routed through hubs such as Hong Kong and the UAE — high value exports dependent on global demand.
- Pharmaceutical exports (generic drugs) to Africa, Latin America and developed country markets — example of high value added manufacturing.
- Rice and spice exports to neighbouring countries like Bangladesh and to Southeast Asia — agricultural export examples.
- Trade Balance = Exports - Imports (positive = surplus, negative = deficit)
- Trade Openness (%) = (Exports + Imports) / GDP × 100
- \[Export Growth Rate (%) = (Exports_t - Exports_{t-1}) / Exports_{t-1} × 100\]
- Terms of Trade (index) = (Index of Export Prices / Index of Import Prices) × 100
- Balassa Revealed Comparative Advantage (RCA) = (X_ij / X_it) / (X_nj / X_nt) where X_ij = exports of commodity i by country j; X_it = total exports of country j; X_nj = world exports of commodity i; X_nt = total world exports
Balance of Payments (BoP)
Definition: The Balance of Payments (BoP) is a systematic record of all economic transactions between residents of a country and the rest of the world during a given period (usually a year). It follows double-entry bookkeeping: each transaction is recorded as a credit (inflow) or a debit (outflow).
Main components:
- Current Account (CA): Records exports and imports of goods (visible trade), exports and imports of services (invisibles), primary income (investment income and compensation of employees) and secondary income (transfers such as remittances, foreign aid). Key subitems: Balance of Trade (Goods) = Exports of goods − Imports of goods.
- Capital Account (KA): Smaller component—capital transfers (debt forgiveness, migrants’ transfers) and transactions in non-produced, non-financial assets (patents, natural resource rights).
- Financial Account (FA): Records cross-border investment flows: direct investment (FDI), portfolio investment (stocks/bonds), other investment (loans, deposits), and reserve assets (changes in central bank foreign exchange reserves).
- Net Errors & Omissions (EoO): Statistical balancing item to ensure accounts sum to zero.
BoP identity and interpretation: By accounting definition, the sum of all components must equal zero. If the current account shows a deficit, it must be financed by net inflows in the financial/capital account (or by reducing reserves). Persistent deficits or sudden reversals of financing can cause pressure on the exchange rate and reserves.
Equilibrium and disequilibrium: BoP is in equilibrium when net outflows equal net inflows (after accounting for reserve changes). Disequilibrium arises from sustained current account deficits/surpluses, volatile capital flows, or sudden stops—leading to reserve depletion, currency depreciation/appreciation, or the need for external borrowing or policy adjustment.
Common policy responses to deficits: expenditure-switching (devalue currency, tariffs), expenditure-reducing (fiscal consolidation, monetary tightening), capital controls, attracting FDI, using foreign exchange reserves or seeking external assistance (IMF).
Key points for Class 12: Understand the components (visible vs invisible), the double-entry nature, how deficits are financed, causes of BoP problems (low export competitiveness, high import dependence, volatile capital flows), and policy measures governments use to restore equilibrium.
- India, 1990–1991: Large BoP crisis caused by high fiscal deficits, rising imports and falling foreign exchange reserves; India sought IMF support and implemented economic reforms to liberalize trade and capital flows.
- India, 2013 (Taper Tantrum): Expectation of U.S. Fed tapering led to capital outflows, rupee depreciation and pressure on reserves—illustrates vulnerability to volatile portfolio flows.
- China (2000s–2010s): Persistent current account surplus due to export-led growth, high savings, and capital controls; accumulation of large foreign exchange reserves.
- United States: Chronic current account deficits financed by capital inflows (US Treasury and equity purchases) making the dollar a global reserve currency.
- Germany: Large current account surplus driven by strong manufacturing exports and competitiveness in global markets.
- BoP identity: Current Account (CA) + Capital Account (KA) + Financial Account (FA) + Errors & Omissions (EoO) = 0
- Current Account (CA) = Balance of Trade (Goods) + Net Services + Net Primary Income + Net Secondary Income
- Balance of Trade (Goods) = Exports of goods − Imports of goods
- Change in Reserves (ΔReserves) = −(CA + KA + FA + EoO) (central bank covers net deficit by using reserves, sign convention depends on bookkeeping)
- If CA < 0 (deficit) then net capital inflows + reserve drawdown must finance it: CA + FA + KA + ΔReserves = 0
Terms of Trade
Terms of Trade (TOT) measures the rate at which a country's exports exchange for its imports. In simple terms, it is the ratio of export prices to import prices and shows how many units (or value) of imports a country can buy per unit (or value) of exports. A rise in TOT is called an improvement (exports fetch relatively higher prices), and a fall is called a deterioration.
Key types and what they show:
- Commodity (gross barter) TOT — compares export prices with import prices and captures relative price changes.
- Net (real) TOT — adjusts for changes in volumes (quantities) traded, so it shows the real exchange of goods after accounting for how much is exported and imported.
- Income TOT — shows how changes in export prices and export volumes affect a country's ability to pay for imports (i.e., export earnings converted into import purchasing power).
Interpretation notes: An improvement in TOT means a country needs to export less (or earns more) to pay for the same quantity of imports; however, TOT alone does not measure national welfare — export volumes, terms of trade volatility, exchange rates, and domestic income distribution also matter.
Major factors affecting TOT: world demand and supply shifts, commodity price cycles, exchange rate movements, trade policies (tariffs, quotas), technological and productivity changes, and inflation differences between trading partners.
Policy responses often include export diversification, moving up the value chain (processing/raw to manufactured), negotiating trade terms, stabilizing export revenues (sovereign funds, hedging), and improving productivity.
- Numeric example: Export price index = 120, Import price index = 100. Commodity TOT = (120/100) × 100 = 120. This indicates a 20% improvement — exports buy 20% more imports than before.
- 1973 oil crisis: Global oil prices rose sharply. Oil-exporting countries (e.g., Saudi Arabia) experienced an improvement in their TOT because export prices rose relative to import prices, while oil-importing countries (e.g., Japan, India) saw deterioration.
- 2000–2011 commodity boom: Countries exporting commodities (Australia, Brazil) saw improved TOT as primary commodity prices rose. Conversely, countries heavily dependent on importing commodities (notably oil imports for many developing countries) experienced a deterioration in TOT during price spikes (e.g., 2008).
- Commodity (gross barter) Terms of Trade = (Index of Export Prices / Index of Import Prices) × 100
- Net (real) Terms of Trade = (Index of Export Prices / Index of Import Prices) × (Index of Export Volume / Index of Import Volume) × 100 (accounts for quantity changes)
- Income Terms of Trade ≈ (Index of Export Prices / Index of Import Prices) × Export Volume Index (or Income TOT = Commodity TOT × Export Volume Index ÷ 100) — shows how export earnings convert into import purchasing power
Trade Policies and Instruments
Overview: Trade policies are government measures that regulate international trade to achieve economic, social or political objectives. Instruments of trade policy include tariffs, quotas, subsidies, anti‑dumping measures, import licensing, non‑tariff barriers (NTBs), exchange‑rate management and preferential/trade‑bloc arrangements. Policies range from free trade (minimal intervention) to protectionism (barriers to imports).
Objectives:
- Protect infant or strategic industries and domestic employment
- Raise government revenue
- Correct balance of payments or trade deficits
- Protect consumers, health, environment and national security
- Promote exports and industrialization
Main instruments — explanations:
1. Tariffs (Customs duties): Taxes on imported goods. Types: ad valorem (percentage of value), specific (fixed amount per unit), compound (both). Effects: raise domestic price, reduce imports, increase producer surplus, cause consumer loss; generate government revenue and create deadweight losses. Tariffs are commonly used for protection and revenue.
2. Quotas: Quantitative limits on imports (global quotas or country‑specific). A quota restricts supply, raising domestic prices. Unlike tariffs, quota rents (extra profits) accrue to quota holders or foreign exporters if not auctioned. Quotas were widely used before WTO disciplines.
3. Export subsidies and promotion: Direct payments, tax breaks or refund schemes to exporters (e.g., duty‑drawback, export incentives). Aimed at promoting export industries, can distort world markets and are restricted by WTO rules.
4. Anti‑dumping and countervailing duties: Measures to counteract dumped imports (sold below normal value) or imports benefiting from unfair foreign subsidies. Imposed after investigation to restore fair competition.
5. Import licensing and administrative controls: Rules that require permits to import certain goods. Can be used to control volumes or ensure safety and standards.
6. Non‑tariff barriers (NTBs): Technical standards, sanitary and phytosanitary (SPS) measures, complex customs procedures, domestic content rules, technical regulations. NTBs can protect domestic industries but must meet international obligations and not be arbitrary barriers to trade.
7. Exchange‑rate and macroeconomic policy: Managing the currency value (devaluation/revaluation) affects competitiveness: a weaker currency makes exports cheaper and imports costlier, acting like an indirect protection.
8. Preferential trade agreements and trade blocs: FTAs, customs unions, common markets reduce trade barriers among members (e.g., EU, NAFTA/USMCA) and may impose external tariffs on non‑members. Most favoured nation (MFN) and special preferential schemes (GSP) are WTO concepts governing preference.
Economic effects (summary):
- Tariffs/quota increase domestic production, reduce consumption and imports.
- Government tariff revenue equals tariff per unit times imports after tariff.
- Consumers lose surplus; producers gain some surplus; the net welfare change often negative because of deadweight loss.
- Subsidies help exporters but can provoke retaliation and are costly to taxpayers.
- NTBs can protect health/safety but may be used to shelter inefficient industries.
Legal/Institutional framework: Most countries operate under WTO/GATT rules which: discourage arbitrary restrictions, promote tariff bindings (limits), require MFN treatment, and regulate subsidies, anti‑dumping and safeguards. Countries can impose temporary safeguard measures during injury from import surges.
Link to Geography (Class‑12 context): Trade policies influence spatial patterns of production and trade flows, regional development (export processing zones, special economic zones), and global value chains. Protection or liberalization affects which regions attract industries and how resources are allocated internationally.
- United States steel tariffs (Section 232, 2018): US imposed tariffs (25%) on steel to protect domestic industry—raising domestic prices and prompting retaliatory measures by some trading partners.
- Anti‑dumping on Chinese solar panels: Several regions (EU, India, US) investigated and imposed duties on imported Chinese panels to counter alleged dumping and protect local manufacturers.
- India’s import duties on mobile phones and electronics: Higher customs duty and phased manufacturing programs to promote local assembly and Reduce import dependence.
- EU Common Agricultural Policy (CAP): Subsidies and price supports for farmers—aim to ensure stable incomes but distort world agricultural trade.
- Multi‑Fibre Arrangement (MFA, ended 2005): Quotas on textile exports from developing countries; their removal under WTO led to major shifts in global textile production (e.g., growth in China and Bangladesh).
- Import value (free trade) = Pw × M0, where Pw = world price, M0 = import quantity at Pw.
- Tariff revenue (per period) = t × Mt, where t = tariff per unit (or ad valorem rate × price) and Mt = imports after tariff.
- Specific ↔ Ad valorem conversion (approx.) : specific equivalent = ad valorem rate × CIF price (specific = t% × CIF).
- Quota rent = (Pd − Pw) × Q, where Pd = domestic price under quota, Pw = world price, Q = quota quantity.
- Effective Rate of Protection (ERP) = ((VAp − VAf)/VAf) × 100, where VAp = value added per unit with protection, VAf = value added per unit without protection.
- Terms of Trade (ToT) = (Index of export prices / Index of import prices) × 100.
Trade Agreements, Regional Blocs and Preferential Arrangements
What they are
Trade agreements, regional blocs and preferential arrangements are institutional/policy arrangements through which two or more countries reduce barriers to trade (tariffs, quotas, non‑tariff barriers) and coordinate economic policies to increase trade and economic cooperation. They range from limited preferential concessions to full economic integration.
Types / Stages of economic integration
- Preferential Trade Agreement (PTA) – Members give preferential (partial) tariff reductions on certain products to each other. Example: some early bilateral PTAs.
- Free Trade Area (FTA) – Elimination of tariffs among members, but each member keeps its own external tariffs (requires rules of origin). Example: USMCA (formerly NAFTA), ASEAN Free Trade Area.
- Customs Union – Tariffs eliminated internally and a common external tariff (CET) applied to non‑members. Example: Mercosur (partially).
- Common Market – Customs union plus free movement of factors of production (labour, capital). Example: early objectives of the European Community.
- Economic Union – Common market plus harmonised macroeconomic policies and institutions (single currency in some cases). Example: European Union (EU) for many member states.
- Monetary Union – Common currency and central monetary authority. Example: Eurozone within the EU.
Main features and instruments
- Tariff reduction/elimination (full or partial)
- Rules of origin to prevent trade deflection
- Common external tariffs and trade policies (in customs unions)
- Cooperation on investment, services, standards, competition policy
Why countries form them
- Increase market access and export opportunities
- Attract foreign investment by offering larger integrated markets
- Achieve economies of scale and stronger regional supply chains
- Political and strategic cooperation
Economic effects
- Trade creation: Members replace higher‑cost domestic production with lower‑cost imports from partner countries — increases welfare.
- Trade diversion: Preferential imports from a partner replace lower‑cost imports from non‑members because of tariff preferences — can reduce welfare.
- Changes in terms of trade, investment flows, industrial location (can cause specialization and structural change).
- Administrative costs and adjustment costs for industries and labour in losing sectors.
Legal context
Regional agreements operate alongside the multilateral rules of the WTO. WTO allows FTAs and customs unions if they meet criteria (substantially all trade liberalised among members) and are notified.
Practical issues
- Rules of origin are essential and can be complex.
- Asymmetric sizes and development levels can create uneven gains.
- Overlapping agreements ("spaghetti bowl") complicate trade and business decisions.
Contemporary significance
Recent major developments include mega‑regionals (RCEP, CPTPP), continental deals (AfCFTA), and deepening of existing blocs (EU reforms). Such arrangements shape global value chains and direction of trade more than simple bilateral tariffs.
- European Union (EU) — evolved from a customs union to an economic and monetary union (Eurozone for many members); deep policy coordination and single market.
- USMCA (United States–Mexico–Canada Agreement) — North American FTA replacing NAFTA with updated rules on autos, labour, digital trade.
- ASEAN Free Trade Area (AFTA) and RCEP — ASEAN members pursued intra‑regional liberalisation; RCEP is a large Asia‑Pacific FTA including ASEAN + partners (China, Japan, South Korea, Australia, New Zealand).
- CPTPP (Comprehensive and Progressive Agreement for Trans‑Pacific Partnership) — plurilateral FTA with deep rules on services, investment and intellectual property.
- Mercosur — South American customs union (Argentina, Brazil, Paraguay, Uruguay) with a common external tariff (implementation varies).
- AfCFTA (African Continental Free Trade Area) — continental initiative to boost intra‑African trade by reducing tariffs and non‑tariff barriers.
- Balassa Revealed Comparative Advantage (RCA) index: RCA = (X_cp / X_c) / (X_wp / X_w) where X_cp = exports of product p by country c; X_c = total exports of country c; X_wp = world exports of product p; X_w = total world exports. (RCA > 1 indicates relative export specialization.)
- Trade Intensity Index (for country i with partner j): TII_ij = (X_ij / X_i) / (M_j / M_w) where X_ij = exports of i to j; X_i = total exports of i; M_j = total imports of j; M_w = total world imports. (Values >1 imply stronger‑than‑expected trade link.)
- Welfare change (qualitative expression): ΔW ≈ Gains from trade creation − Losses from trade diversion − Administrative/adjustment costs. (Used to conceptualise net welfare effects of forming a bloc.)
World Trade Organization (WTO) and International Institutions
Overview
The World Trade Organization (WTO) is the principal international organization that governs rules of international trade in goods, services and intellectual property. Established in 1995 as the successor to the General Agreement on Tariffs and Trade (GATT, 1947), the WTO provides a forum for negotiating trade agreements, monitoring national trade policies, settling disputes and offering technical assistance to developing countries.
Objectives
- Promote free and predictable trade by reducing trade barriers (tariffs and non‑tariff barriers).
- Ensure non‑discrimination among members through core principles such as Most Favoured Nation (MFN) and National Treatment.
- Provide a binding dispute settlement mechanism to enforce agreements.
- Support development and capacity building for poorer countries.
Core Principles
- Most Favoured Nation (MFN): Treat all WTO members equally—if one member is given a trade concession, all must receive it.
- National Treatment: Imported and locally produced goods should be treated equally after import.
- Transparency: Members must publish trade regulations and notify the WTO of changes.
- Reciprocity and Binding: Negotiated tariff reductions are often bound and enforceable.
Major Agreements and Areas
- GATT (goods): rules on merchandise trade and tariff bindings.
- GATS (services): disciplines for trade in services.
- TRIPS (intellectual property): sets standards for IP protection across members.
- Other agreements: Agreement on Agriculture, Sanitary and Phytosanitary Measures (SPS), Technical Barriers to Trade (TBT), Anti‑dumping, Subsidies and Countervailing Measures.
Institutional Structure
- Ministerial Conference (highest decision‑making body meeting every 1–2 years).
- General Council: conducts business between ministerial meetings and acts as Dispute Settlement Body and Trade Policy Review Body.
- Committees and specialist councils for goods, services, TRIPS, and technical cooperation.
Functions
- Negotiate multilateral trade agreements and reduce trade barriers.
- Administer and interpret trade rules through regular reviews.
- Dispute settlement: adjudicate trade disputes between members with panel rulings and an Appellate Body (recently functionally constrained, with reforms underway).
- Provide technical assistance and capacity building to developing countries.
WTO in the Global Institutional System
The WTO works alongside other international institutions:
- IMF: Ensures macroeconomic stability and assists with balance of payments problems that can affect trade.
- World Bank: Provides development financing and trade‑related infrastructure projects that enable countries to trade.
- UNCTAD: Research and policy advice on trade and development, often representing developing country perspectives within trade debates.
Achievements and Limitations
- Achievements: institutionalized rules for global trade, successful agreements (e.g., Trade Facilitation Agreement reached at Bali 2013), procedural dispute settlement that lowered trade conflicts.
- Limitations: Doha Development Round stalemate (since 2001), criticisms that negotiations favour rich countries, slow adaptation to new issues (digital trade, services), Appellate Body paralysis since 2019 and challenges enforcing rulings.
Contemporary Issues and Debates
- Special and Differential Treatment: how to give developing countries policy space while integrating them in the rules‑based system.
- Intellectual property vs public health: TRIPS waiver debate for COVID‑19 vaccines highlighted tensions between IP protection and emergency public health needs.
- Rise of regional and preferential trade agreements (PTAs/FTAs) that operate alongside WTO rules.
- Non‑tariff measures (standards, regulations) have become more important than tariffs in many sectors.
Relevance for India and Other Developing Countries
For countries like India, the WTO is important for securing market access, protecting domestic policy space (e.g., agricultural support), and using dispute settlement to challenge protectionist measures by larger economies. It also provides technical assistance to boost export capacity.
Class 12 Connection
Understanding the WTO helps explain spatial patterns of international trade, why some countries have become more integrated into global markets, and how international rules influence national economic geography.
- Bali Package (2013): WTO members agreed the Trade Facilitation Agreement to simplify customs procedures and reduce trade transaction costs, benefiting exporters especially in developing countries.
- US–China trade tensions (2018–): Tariff escalations led to multiple WTO consultations and highlighted limits of the multilateral system when large economies use unilateral measures.
- TRIPS waiver debate during COVID‑19 (2020–2021): India and South Africa proposed a temporary waiver of certain IP rules to improve access to vaccines and treatments; it illustrated tensions between public health and patent protection.
- US–EU Boeing/Airbus dispute: Longstanding WTO cases on illegal subsidies to aircraft manufacturers resulted in authorized retaliatory tariffs and demonstrate WTO dispute settlement at work.
- India’s dispute on agricultural export subsidies and domestic support: Frequent negotiations and complaints show the sensitivity of agricultural policies in trade talks.
- Trade openness (%) = (Exports + Imports) / GDP × 100 — measures the degree of integration with world trade.
- Balance of Trade = Exports − Imports — positive means trade surplus, negative means trade deficit.
- Terms of Trade (index) = (Index of export prices / Index of import prices) × 100 — if >100, terms of trade have improved.
- Revealed Comparative Advantage (Balassa index) = (Xij / Xit) / (Xwj / Xwt) where Xij = country i's exports of commodity j, Xit = country i's total exports, Xwj = world exports of commodity j, Xwt = world total exports. Value >1 indicates comparative advantage.
Multinational Corporations (MNCs) and Transnational Corporations (TNCs)
Definitions
MNC (Multinational Corporation): A company headquartered in one country that owns or controls production or service facilities in one or more other countries. Decision-making and strategic control often remain at the home-country head office.
TNC (Transnational Corporation): A company that operates across many countries through a networked structure with decentralized decision-making. TNCs integrate production, marketing and R&D across borders and are less tied to a single national identity.
Key characteristics
- MNCs: single dominant headquarters, foreign subsidiaries, large capital resources, transfer of technology, seek market expansion and cost advantages.
- TNCs: global production networks, decentralized management, greater integration of foreign units, flexible location of functions (R&D, finance, production).
Differences (summary)
- Control: MNCs - centralized; TNCs - decentralized/global integration.
- Identity: MNCs - tied to home country; TNCs - transnational identity.
- Strategy: MNCs - adapt products for foreign markets under HQ guidance; TNCs - coordinate global value chains and allocate functions by comparative advantage.
Roles and functions in international trade
- Drive FDI inflows and transfer of capital, technology and managerial skills.
- Create global value chains: breaking production into stages located where cost/skill advantages exist.
- Facilitate market access, exports, and import of intermediate goods.
- Generate employment, tax revenue and export earnings in host countries.
Economic and social impacts
- Positive: technology spillovers, infrastructure development, higher productivity, export promotion and integration into global markets.
- Negative: profit repatriation, crowding out of local firms, environmental degradation, tax avoidance and uneven bargaining power.
Why they expand internationally
- Market-seeking: reach new customers.
- Resource-seeking: access raw materials, cheap labour, or specific skills.
- Efficiency-seeking: locate production where costs are lower.
- Strategic-asset-seeking: acquire technology, brands, distribution networks.
Host country responses and regulation
- Policies to attract FDI: tax incentives, special economic zones, investment promotion.
- Regulations: local content rules, environmental standards, limits on foreign ownership in strategic sectors.
- Negotiation of benefits: technology transfer, employment guarantees, training.
Measuring globalisation of firms
Transnationality is measured with indices (see formulas). Analysts also look at FDI flows, foreign sales and employment shares to assess how global a firm is.
Implication for international trade (Class 12 context)
MNCs and TNCs are central actors in contemporary international trade because they organize production and trade through global networks. Understanding them helps explain trade patterns, FDI distribution, and why production is fragmented across countries.
- Coca-Cola (MNC) - HQ in USA; concentrates global brand strategy at headquarters while operating numerous foreign bottling plants.
- Apple (MNC/TNC characteristics) - US-based HQ designs products, but production and component sourcing are spread globally (China, Taiwan, South Korea), showing integrated value chains.
- Unilever (TNC) - operates a decentralized global structure with major operations and product adaptation across Europe, Asia and Africa; management and R&D are spread internationally.
- Nestlé (TNC) - Swiss-based but with highly integrated global production and marketing networks; local brands and production are managed across regions.
- Toyota (MNC/TNC) - Japanese HQ with production plants worldwide; combines centralized technology with decentralized production and regional decision-making.
- Shell / BP (TNCs) - energy companies with global exploration, production, refining and marketing networks and decentralized operations.
- Market share (%) = (Firm's sales in market / Total market sales) × 100
- Net FDI inflow = FDI inflows − FDI outflows
- FDI inflow as % of GDP = (Net FDI inflow / GDP) × 100
- Profit repatriation rate (%) = (Profits repatriated to parent / Total profits of foreign affiliates) × 100
- Transnationality Index (TNI) = 100 × ( (Foreign assets / Total assets) + (Foreign sales / Total sales) + (Foreign employment / Total employment) ) / 3 (UNCTAD measure)
Trade Infrastructure and Logistics
Definition: Trade infrastructure and logistics are the physical facilities, services and institutional systems that move goods between producers and consumers across borders — including transport networks (sea, air, road, rail, inland waterways), ports and airports, container terminals, warehouses and cold chains, customs and trade facilitation systems, multimodal links and information/finance services.
Why it matters (Class 12 perspective): Efficient trade infrastructure reduces transportation and transaction costs, shortens transit times, increases reliability and competitiveness of exports/imports, and thereby affects a country’s participation in international trade, regional linkages and economic growth.
Main components:
- Transport modes: Seaports (ocean freight), airports (air cargo), railways, roads and inland waterways — each has different cost, speed and capacity traits.
- Ports & terminals: Deep-water ports, container terminals (TEU handling), Ro-Ro terminals, oil & bulk terminals — act as international gateways.
- Containerisation & multimodal transport: Standardised containers (TEU/FEU) allow goods to move seamlessly between ship, rail and truck.
- Warehousing & cold chains: Storage, bonded warehouses, temperature-controlled logistics essential for perishables, pharmaceuticals and high-value goods.
- Inland Container Depots (ICD) & Container Freight Stations (CFS): Decongest ports by providing customs clearance and container handling inland.
- Customs, documentation & ICT: Electronic data interchange (EDI), single windows, risk-based inspections, and simplified customs speed up clearance.
- Support services: Freight forwarders, shipping agents, insurance, packing, finance and trade facilitation institutions.
Functions & benefits:
- Reduce per-unit transport cost and transit time.
- Improve reliability and predictability of supply chains.
- Enable economies of scale (container ships, rail corridors).
- Support diversification of export markets and higher-value manufacturing.
- Lower inventory and working capital needs through faster lead times.
Problems and bottlenecks: Capacity limits at ports/terminals, poor last-mile connectivity, congestion, high inland transport costs, weak cold-chain coverage, slow customs procedures and lack of digital integration can raise logistics costs and reduce trade competitiveness.
Indicators used to measure performance: Logistics Performance Index (LPI), average transit time, port throughput (million TEUs or tonnes), modal share of freight, freight rates (per tonne-km), customs clearance time, and container turnaround time.
Policy responses & improvements: Invest in deep-water ports and hinterland connectivity, develop multimodal logistics parks, expand ICDs/CFS, streamline customs through single-window EDI, promote containerisation and cold chain, public–private partnerships for terminals, and adopt digital tracking (GPS, RFID) and port community systems.
- Port of Singapore — world’s busiest transshipment hub; excellent hinterland connections and high container throughput make it a model of port logistics efficiency.
- Jawaharlal Nehru Port Trust (JNPT), India — largest container port in India; investments in terminal capacity and ICDs improved export competitiveness for Mumbai region.
- Mundra Port (Adani) — private port with multimodal access and integrated logistics park, demonstrating benefits of port-linked industrial clusters.
- Ever Given blockage in the Suez Canal (March 2021) — showed how a single chokepoint disruption drastically increased shipping times and freight rates worldwide.
- Amul cold-chain and dairy logistics in India — an example where cold storage, refrigerated transport and collection centres enable large-scale export and domestic distribution of perishables.
- Inland Container Depot (ICD) Tughlakabad, New Delhi — eases pressure on seaports by providing customs clearance and container handling inland.
- Unit transport cost (per tonne–km) = Total transport cost / (tonnes transported × distance in km)
- Total logistics cost = Transportation cost + Inventory carrying cost + Warehousing cost + Packaging + Customs & documentation cost + Administration
- Inventory carrying cost (annual) = Average inventory × Holding cost rate per year
- Economic Order Quantity (EOQ) = sqrt((2 × D × S) / H) where D = annual demand, S = ordering cost per order, H = holding cost per unit per year (useful for inventory/logistics planning)
- Gravity model of trade (simplified): Tij = G × (Mi × Mj) / Dij^β where Tij = trade flow between i and j, Mi/Mj = economic mass (GDP or export capacity), Dij = distance or trade cost, β ≈ 1–2; shows how distance (logistics) reduces trade.
- Port throughput growth rate (%) = ((Throughput_year2 − Throughput_year1) / Throughput_year1) × 100
Special Economic Zones (SEZs), Export Processing Zones (EPZs) and Trade Promotion
Definitions
SEZ (Special Economic Zone): A geographically demarcated area within a country where business and trade laws are different from the rest of the country to attract investment, boost exports and create jobs. SEZs offer fiscal and non‑fiscal incentives, relaxed customs procedures and better infrastructure.
EPZ (Export Processing Zone): A type of free zone established mainly to promote manufacturing for exports. EPZs typically allow duty‑free imports of raw materials and intermediate goods, provide simplified procedures and often focus on labour‑intensive industries.
Objectives
- Increase exports and foreign exchange earnings.
- Attract foreign direct investment (FDI) and technology transfer.
- Create employment and promote regional development.
- Encourage industrialization and value‑added manufacturing.
- Develop export‑oriented infrastructure and logistics.
Key features and incentives
- Fiscal incentives: tax holidays, reduced corporate tax, exemption from customs duties on inputs and capital goods.
- Simplified procedures: single‑window clearances, relaxed labour rules, faster approvals.
- Quality infrastructure: dedicated ports/roads, reliable power, warehousing and common processing facilities.
- Access to international markets through preferential trade policies.
- Focused sectoral clusters (electronics, textiles, pharmaceuticals, IT/ITES).
Differences between SEZs and EPZs
- Scope: EPZs are primarily export‑oriented manufacturing enclaves; SEZs have a wider scope (manufacturing, services, trading, logistics, R&D).
- Policy framework: SEZs are usually part of broader national economic reform packages with more comprehensive incentives.
- Size and infrastructure: SEZs are often larger with more developed multi‑sector infrastructure than older EPZs.
How SEZs/EPZs promote trade
- Lower production costs and duty exemptions make exports more competitive in global markets.
- Consolidated export processing and logistics reduce lead times and transaction costs.
- Clusters encourage specialization, economies of scale and knowledge spillovers, raising export quality and variety.
- Attract FDI and global value chain participation — foreign firms use SEZs/EPZs as export platforms.
- Trade promotion agencies and incentives (marketing support, trade fairs, export credit) help firms enter and sustain foreign markets.
Advantages
- Rapid export growth, job creation and infrastructure development in host regions.
- Increased FDI, technology transfer and management practices.
- Boost to small and medium enterprises through backward and forward linkages.
Criticisms and challenges
- Possible loss of fiscal revenue from tax exemptions and duties.
- Environmental and social concerns (displacement, labour conditions).
- If poorly integrated with the domestic economy, SEZs can become enclaves with limited local spillovers.
- Uneven regional benefits—successful SEZs often cluster in already developed areas.
Role of trade promotion
Trade promotion includes government and quasi‑government actions to increase exports: export incentives (duty drawback, export subsidies), export finance and insurance, market research, participation in trade fairs, training in export procedures, quality and standards support, and export facilitation through single windows and trade agreements. Export Promotion Councils and agencies coordinate these activities.
India — policy context (Class 12 relevance)
- India began EPZs in the 1960s (e.g., Kandla EPZ) and expanded SEZ policy in the 2000s to create SEZs with more liberal incentives.
- Typical Indian trade promotion measures: Duty Drawback, Merchandise Exports from India Scheme (MEIS) replaced/adjusted by newer schemes, Export Promotion Capital Goods (EPCG) scheme, special agencies like APEDA (agri), MPEDA (marine), EEPC (engineering) and FIEO.
- Indian examples: Kandla EPZ (one of the earliest), Santacruz SEEPZ (Mumbai), Noida SEZ (NSEZ), MEPZ (Chennai), Falta SEZ (West Bengal).
How to evaluate SEZ/EPZ success (indicators)
- Export growth from the zone (absolute and % growth).
- Employment generated (direct and indirect).
- FDI inflows and number of export firms established.
- Linkages with domestic industry (local sourcing ratios).
- Contribution to regional GDP and improvement in infrastructure.
Teaching tip: Use case studies (Shenzhen, Kandla, SEEPZ) to compare outcomes, and ask students to critically assess trade‑offs between export growth and social/environmental costs.
- China — Shenzhen SEZ (established 1980): transformed a small fishing town into a major manufacturing and tech hub and catalyst for China’s export‑led growth.
- India — Kandla EPZ (one of the earliest EPZs): promoted exports from western India; Santacruz SEEPZ (Mumbai): focused on gems, jewellery, and electronics exports.
- India — Noida SEZ (NSEZ) and MEPZ (Madras Export Processing Zone, Chennai): examples of export hubs that attracted manufacturing and IT/ITeS firms.
- Bangladesh — EPZs in Chittagong and Dhaka: key contributors to the RMG (ready‑made garments) export boom.
- Mexico — Maquiladora program: border manufacturing zones exporting primarily to the US market, notable for labour‑intensive assembly operations.
- Ireland (1990s): export‑oriented tax policies and special incentives attracted multinational investment in electronics and pharmaceuticals, boosting exports and employment.
- \[Export growth rate (%) = [(Exports_t − Exports_{t-1}) / Exports_{t-1}] × 100\]
- Export‑to‑GDP ratio (%) = (Total exports of goods & services / GDP) × 100
- Trade openness (%) = [(Exports + Imports) / GDP] × 100
- Trade balance = Total exports − Total imports
- CAGR of exports over n years = (Export_final / Export_initial)^(1/n) − 1
- \[Revealed Comparative Advantage (Balassa index) for product j: RCA_{ij} = (x_{ij}/X_{i}) ÷ (X_{wj}/X_{w}) where x_{ij}=exports of product j by country i\]\[X_{i}=total exports of country i\]\[X_{wj}=world exports of product j\]\[X_{w}=total world exports\]
Globalization and Liberalization
Definition: Globalization is the process by which countries, firms and people become more interconnected through trade, investment, technology, migration and information flows. Liberalization refers to policy changes that reduce government restrictions on economic activity such as lowering tariffs, removing quotas and deregulating markets to encourage trade and foreign investment.
How they relate to International Trade: Liberalization (policy action) reduces trade barriers and opens domestic markets. This facilitates globalization by increasing cross-border flows of goods, services, capital and ideas. Together they expand international trade, integrate national economies into global value chains and alter patterns of production and consumption.
Key features and mechanisms:
- Reduction of tariffs and non-tariff barriers (quotas, licensing).
- Promotion of foreign direct investment (FDI) and multinational corporations (MNCs).
- Trade agreements and institutions (WTO, regional trade blocs) that standardize rules and lower barriers.
- Liberal domestic reforms: privatization, deregulation and flexible labor and capital markets.
- Technology, transport and communication improvements that lower trade costs.
Causes: technological advances (internet, logistics), policy reforms (trade liberalization), end of Cold War, growth of MNCs, regional trade agreements, and international financial integration.
Economic impacts:
- Positive: higher GDP growth, access to larger markets, efficiency gains from specialization, technology transfer, increased consumer choice, employment growth in export-oriented sectors and services (IT, BPO).
- Negative: increased competition for domestic firms, deindustrialization in uncompetitive sectors, income inequality, vulnerability to global shocks, environmental pressures, and loss of some policy autonomy.
Distributional effects: Gains from globalization are not uniform. Skilled workers, capital owners and export-oriented regions often gain more, while unskilled workers in protected industries may lose unless assisted by adjustment policies.
Policy responses: Complement liberalization with social safety nets, active labor market policies, education and retraining, competition policy, environmental regulation and phased liberalization to manage transition costs.
Historical examples: Post-1991 Indian economic reforms (Liberalization, Privatization, Globalization) that opened India to FDI and reduced tariffs; China’s post-1978 opening leading to export-led growth; formation of WTO (1995) and regional blocs like EU, ASEAN, NAFTA/USMCA that institutionalized lower trade barriers.
Conclusion: Liberalization is the policy instrument that promotes globalization; both reshape the pattern of international trade, production and consumption. They bring growth opportunities but require careful domestic policies to manage adjustment, distributional and environmental consequences.
- India, 1991 reforms: removal of industrial licensing, reduction in import tariffs, encouragement of FDI — led to growth in IT, services and manufacturing exports.
- China since 1978: Special Economic Zones, export processing, massive FDI inflows and integration into global supply chains (e.g., electronics manufacturing).
- Apple: design in US, components from multiple countries, assembly in China — example of global value chains and fragmentation of production.
- Bangladesh garments industry: liberal access to global markets and low-cost labor created export-led growth but also exposed workers to poor working conditions and competition.
- NAFTA/USMCA and EU: regional liberalization boosting intra-regional trade and cross-border production networks.
- Balance of Trade (BoT) = Exports (X) - Imports (M)
- Trade Openness Ratio (%) = [(Exports + Imports) / GDP] × 100
- Terms of Trade (ToT) = (Index of export prices / Index of import prices) × 100
- Export (or Import) Growth Rate (%) = [(Value in current period - Value in base period) / Value in base period] × 100
- Net Exports (NX) = X - M
- Revealed Comparative Advantage (RCA) for product i = (Exports_i_country / Total exports_country) ÷ (World exports_i / Total world exports)
Problems and Challenges in International Trade
Overview
International trade creates opportunities for growth, specialization and access to goods and technology. However, it also presents a set of problems and challenges — economic, structural, political, institutional and environmental — that affect countries differently, often exacerbating inequalities between developed and developing nations.
1. Unfavourable Terms of Trade and Price Volatility
Many developing countries export primary commodities whose prices are volatile and tend to fall relative to manufactured goods. An adverse movement in terms of trade (export price index falling relative to import price index) reduces real income from trade and can worsen living standards. Price volatility makes export revenues unpredictable, complicating budgeting and investment decisions.
2. Dependence on Primary Commodities and Lack of Diversification
When exports are concentrated in a few raw materials (e.g., oil, minerals, coffee), economies are vulnerable to sector-specific shocks (price crashes, depletion). Low value addition in exports traps countries in low-income activities and limits technology transfer.
3. Trade Barriers and Protectionism
Tariffs, quotas, export restrictions and subsidies distort trade flows. Developed countries often maintain agricultural subsidies and non-tariff measures (sanitary standards, technical barriers) that restrict market access for developing-country producers. Protectionist policies (including recent trade wars) can reduce export opportunities and raise costs for consumers and producers globally.
4. Dumping and Unfair Competitive Practices
Dumping (selling goods abroad below domestic prices or cost) and state subsidies can drive local producers out of markets in importing countries. Anti-dumping measures and countervailing duties are frequently invoked, leading to trade disputes.
5. Exchange Rate and Financial Risks
Volatile exchange rates and capital flow reversals affect import costs, export competitiveness and balance-of-payments stability. Sudden currency depreciations raise import bills and inflation; appreciation can make exports less competitive.
6. Transportation, Logistics and Transaction Costs
High transport costs, poor infrastructure, inefficient customs procedures and long border delays raise the effective cost of trade, especially for landlocked and least-developed countries. These costs reduce competitiveness and margins for exporters.
7. Institutional and Supply-side Constraints
Weak institutions, limited negotiating capacity, poor trade facilitation, inadequate access to finance, and low technological capability constrain a country’s ability to participate in global value chains and gain from trade.
8. Non-tariff Measures and Standards
Stringent sanitary and phytosanitary standards, technical regulations and intellectual property requirements can act as barriers if exporters cannot meet them. These often require costly certification, testing and compliance upgrades.
9. Environmental and Social Challenges
Trade-driven resource extraction can cause environmental degradation, biodiversity loss and social displacement. Global competition may also lead to a 'race to the bottom' in labour and environmental standards in some cases.
10. Geopolitical Risks and Trade Conflicts
Trade is influenced by geopolitics: sanctions, embargoes, bilateral disputes and trade wars disrupt established trade patterns and create uncertainty for businesses and countries dependent on specific markets.
11. Unequal Bargaining Power and Trade Rules
Multinational corporations and developed-country negotiators often have more influence in setting rules, standards and agreements. This can produce unequal outcomes (e.g., intellectual property protections that favour high-tech producers) and limit policy space for developing countries.
12. Structural Unemployment and Adjustment Costs
Opening to international competition can lead to structural unemployment in less-competitive domestic sectors. Adjustment requires retraining, social safety nets and investment in new sectors — often costly and politically difficult.
Interconnections and Feedbacks
These problems are interlinked. For example, lack of diversification makes a country vulnerable to price shocks; shocks worsen fiscal positions and may force protectionist responses; in turn, protectionism reduces market access and investment. Tackling these challenges requires coordinated domestic reforms (diversification, infrastructure, institutions) and international cooperation (fairer market access, capacity building, stabilization mechanisms).
Class-12 Perspective — Key Points to Remember
- Terms of Trade and price instability are central economic risks for many trading countries.
- Dependence on a narrow export base prevents sustainable development and heightens vulnerability.
- Trade barriers (tariff and non-tariff) and unfair practices like dumping hamper equitable benefits from trade.
- Infrastructure, transaction costs and institutional weaknesses are critical impediments to trade participation.
- Global issues — protectionism, trade wars, and environmental concerns — have direct local impacts.
- Oil-exporting countries (e.g., Venezuela, Nigeria) suffered severe fiscal crises when crude prices collapsed, illustrating vulnerability due to dependence on a single commodity.
- Coffee price volatility has historically hit producers in Ethiopia and other African countries, causing income instability for farmers.
- US–China tariffs (2018–2019) and retaliatory measures disrupted global supply chains and illustrated modern protectionism.
- EU agricultural subsidies and standards have been cited as barriers that disadvantaged West African cocoa and fruit exporters.
- Chinese steel expansion at low prices led to global oversupply and anti-dumping investigations and duties in several countries.
- Landlocked countries like Nepal and Bolivia face higher freight and logistics costs than coastal neighbours, reducing export competitiveness.
- Terms of Trade (TOT) = (Index of Export Prices / Index of Import Prices) × 100
- Balance of Trade (Trade Balance) = Value of Exports − Value of Imports
- Trade Openness (%) = (Exports + Imports) / GDP × 100
- Export Growth Rate (%) = [(Exports in current year − Exports in previous year) / Exports in previous year] × 100
- Import Dependency Ratio = (Value of Imports of a commodity / Domestic Consumption of that commodity) × 100
- Basic Balance of Payments Identity: Current Account + Capital Account + Financial Account + Errors & Omissions = 0
Foreign Exchange and Exchange Rate Systems
Foreign exchange means the currencies of other countries and the foreign exchange market where those currencies are bought and sold. It is needed to pay for imports, travel, foreign investment and to settle international debts.
Exchange rate is the price of one currency expressed in terms of another — for example, how many Indian rupees equal one US dollar. If quoted as domestic currency per unit of foreign currency, a higher number means the domestic currency has depreciated.
How exchange rates are quoted and traded
• Spot rate: the price for immediate delivery (usually two business days).
• Forward rate: agreed price for delivery at a future date (hedging against risk).
Determinants of exchange rates
Exchange rates form where demand for a foreign currency equals its supply. Major influencing factors:
- Balance of payments (trade and capital flows): A trade deficit increases demand for foreign currency (imports) and can depreciate the domestic currency.
- Interest rates: Higher domestic interest rates attract capital inflows, increasing demand for domestic currency and appreciating it (other things equal).
- Inflation rates: Higher domestic inflation tends to depreciate the currency (purchasing power parity logic).
- Speculation and expectations: Expectations about future policies, growth or crises change demand instantly.
- Government and central bank actions: Reserves, interventions, capital controls and policy signals affect rates.
Exchange rate systems
1) Fixed (pegged) system: The government/central bank sets and defends a fixed rate versus another currency or basket. Advantage: stability in trade and investment; disadvantage: requires large reserves and loses independent monetary policy. Example: many countries pegged to the US dollar at one time.
2) Flexible (floating) system: Market forces determine the rate; the central bank may allow it to move freely. Advantage: automatic adjustment to shocks; disadvantage: volatility. Example: major currencies like USD, EUR, JPY operate largely under floating regimes.
3) Managed float (dirty float): Mostly market-determined but the central bank intervenes occasionally to reduce excessive volatility or achieve policy goals.
4) Other variants: Currency board (strict rule-based peg with full reserve backing), crawling peg (small, controlled depreciations), dual exchange rates (separate rates for different transactions).
Convertibility
Convertibility refers to the freedom to exchange domestic currency for foreign currency. Current account convertibility (trade, services, remittances) is often liberalized first; capital account convertibility (investment flows) is more sensitive. Example: India has current account convertibility while capital account convertibility is partially liberalized and managed by the RBI.
Role of central bank
Central banks: intervene to stabilize rate, use foreign exchange reserves, set interest rates and capital controls, and manage inflation targeting consistent with exchange rate policy.
Impacts of rate changes
• Depreciation (domestic currency loses value): makes exports cheaper and imports costlier — may improve trade balance but raise inflation.
• Appreciation (domestic currency gains): imports cheaper, exports less competitive.
- India (post-1991): Moved from a tightly controlled rate toward a managed float. The RBI intervenes to smooth volatility; INR typically trades against USD around market pressures.
- China (before 2005): Kept a rigid peg to the US dollar for many years to support export-led growth. Post-2005 it moved to a more managed float, allowing gradual appreciation.
- Euro introduction (1999–2002): Fixed irrevocable conversion rates between national currencies and the euro; this is an example of rigid fixed conversion among members.
- 2008 global financial crisis and 2013 "taper tantrum": sudden changes in capital flows led to sharp currency movements (e.g., many emerging currencies depreciated) showing how capital flow expectations affect exchange rates.
- Exchange rate (direct quote): E = domestic currency units per 1 unit of foreign currency (e.g., INR per USD).
- Indirect quote: 1 / E = foreign currency units per 1 unit of domestic currency.
- Percentage change (depreciation/appreciation): %ΔE = (E_new - E_old) / E_old × 100. If E is domestic per foreign, %ΔE > 0 means depreciation of domestic currency.
- Real exchange rate (competitiveness): RER = (E × P_foreign) / P_domestic where E is domestic currency per unit foreign, P_foreign is foreign price level and P_domestic is domestic price level.
- Purchasing Power Parity (approximate): E = P_domestic / P_foreign (if law of one price holds).
- Covered interest parity (forward-spot relation): F ≈ S × (1 + i_dom) / (1 + i_for) where S is spot rate, F is forward rate, i_dom and i_for are domestic and foreign interest rates.
Trade Statistics and Classification Systems
What are trade statistics? Trade statistics measure the value and quantity of goods and services that cross national borders. They record exports (goods/services sold abroad) and imports (goods/services bought from abroad). Trade statistics are essential for understanding a country's economic links with the world, designing trade policy and negotiating trade agreements.
Main components
- Merchandise (Visible) trade: Tangible goods such as machinery, food, raw materials.
- Invisible trade (Services): Transport, tourism, insurance, financial and IT services, remittances.
- Re-exports and re-imports: Goods imported and subsequently exported with little or no processing (important for entrepôt hubs).
- Valuation: Exports are typically recorded on a FOB (Free on Board) basis and imports on a CIF (Cost, Insurance & Freight) basis unless adjusted. This affects comparability.
Uses of trade statistics
- Track trade balance (surplus/deficit) and its trend over time.
- Identify main export and import commodities and trading partners (direction and composition of trade).
- Measure openness of the economy, competitiveness and dependency on specific products or countries.
- Design tariffs, quotas and trade promotion measures; monitor compliance with trade agreements.
Common problems and limitations
- Valuation differences: CIF vs FOB can distort import–export comparisons unless adjusted.
- Classification changes: Updates to coding systems complicate time-series analysis.
- Re-exports and transshipments: May overstate a country’s domestic trade activity.
- Data gaps and underreporting: Informal trade and smuggling are often not captured.
- Exchange rate and price effects: Nominal values fluctuate with prices and currency movements.
Classification systems (why they matter)
Classification systems assign standard codes to commodities and products so data are comparable across time and countries. They enable aggregation, comparison and policy analysis.
Major classification systems
- Harmonized System (HS): Developed by the World Customs Organization (WCO). A goods classification with a hierarchical code (usually shown to 6 digits internationally: 2-digit chapter, 4-digit heading, 6-digit subheading). Used for customs, tariff schedules and most international trade reporting.
- Standard International Trade Classification (SITC): By the UN; designed for economic analysis (groups commodities by stage of production). Useful for time-series and comparing structure of trade in value terms.
- International Standard Industrial Classification (ISIC): Classifies economic activities (industries) rather than products; useful for relating trade to domestic production.
- Broad Economic Categories (BEC): Converts detailed commodity codes into broad categories (e.g., capital goods, consumer goods, intermediate goods) for policy analysis.
- Central Product Classification (CPC): Comprehensive classification covering goods and services; used in supply-use and trade in services statistics.
How classification systems are used together
Customs data are usually recorded in HS codes. For economic analysis the HS may be mapped to SITC or BEC to study e.g., the share of capital goods in imports or to compute diversification indices. ISIC connects trade to domestic industry production and employment.
Sources of trade statistics
- National customs administrations and statistical offices.
- International sources: UN Comtrade, World Bank, IMF (Direction of Trade Statistics), WTO.
Best practice when using trade data
- Note whether values are FOB or CIF; convert when comparing exports to imports.
- Use consistent classification across years or apply concordance tables when classification changed.
- Look at both value and quantity/physical units (unit values help separate price from volume changes).
- Simple trade balance: Country A exports goods worth $200 billion and imports $250 billion in a year. Trade balance = Exports − Imports = $200b − $250b = −$50 billion (trade deficit).
- FOB/CIF adjustment: If a country's reported imports (CIF) = $120 billion, and freight+insurance are estimated at $2 billion, then approximate FOB value = $120b − $2b = $118 billion. This makes imports comparable with FOB-valued exports.
- Terms of trade (price effect): Suppose export price index rises from 100 to 120 and import price index rises from 100 to 110. Terms of trade = (120/110) × 100 = 109.09. Interpretation: The country can buy 9.09% more imports for the same export volume — improvement in terms of trade.
- Classification mapping (real-life): A customs dataset lists an export as HS 8471 (automatic data-processing machines). For economic analysis of high-tech exports, this HS code may be mapped to SITC and to ISIC codes for electronics manufacturing to study employment impacts.
- Trade balance = Exports − Imports
- Export–Import ratio (%) = (Exports / Imports) × 100
- Trade openness (Trade/GDP) (%) = ((Exports + Imports) / GDP) × 100
- Terms of Trade (ToT) = (Index of export prices / Index of import prices) × 100
- Net barter terms of trade (example) = (Export price index ÷ Import price index) × 100
- Approximate FOB from CIF: FOB ≈ CIF − (Freight + Insurance)
Key Concepts
- International Trade
- Exchange of goods, services and capital across international borders between countries.
- Export
- Goods or services produced in one country and sold to buyers in another country.
- Import
- Goods or services bought by residents of one country from producers in another country.
- Balance of Trade
- Difference between the value of a country's exports and imports of goods over a period.
- Balance of Payments (BoP)
- Comprehensive record of all economic transactions between residents of a country and the rest of the world, including trade, services, income and transfers.
- Trade Surplus
- Situation when the value of a country's exports of goods exceeds its imports of goods.
- Trade Deficit
- Situation when the value of a country's imports of goods exceeds its exports of goods.
- Terms of Trade (ToT)
- Ratio of export prices to import prices; it shows how many units of imports can be obtained per unit of exports.
- Tariff
- Tax imposed by a government on imported goods to raise revenue or protect domestic industries.
- Non-Tariff Barriers (NTBs)
- Regulatory measures other than tariffs that restrict imports, such as quotas, standards, licensing and subsidies.
- Most Favoured Nation (MFN)
- WTO principle requiring a country to extend the same trade concessions and privileges to all WTO members as those given to the most favored trading partner.
- Free Trade Agreement (FTA)
- A pact between two or more countries to reduce or eliminate trade barriers for goods and services among them.
- World Trade Organization (WTO)
- International organization that deals with rules of trade between nations, aiming to ensure smooth, predictable and free trade.
- Exchange Rate
- Price of one country's currency expressed in terms of another country's currency; affects competitiveness of exports and imports.
- Multinational Corporation (MNC)
- A company that operates production or service facilities in multiple countries and engages in global trade and investment.
- Trade Liberalisation
- Policy of reducing trade barriers such as tariffs and quotas to encourage freer flow of goods and services across borders.
- Protectionism
- Economic policy of protecting domestic industries from foreign competition through tariffs, quotas or regulations.
- Special Economic Zone (SEZ)
- Designated area within a country with special economic regulations (tax incentives, relaxed rules) to attract foreign investment and boost exports.
- Comparative Advantage
- Economic principle that a country should specialize in producing goods it can produce at lower opportunity cost than others and trade for the rest.
- Globalisation
- Process of increasing interconnectedness and interdependence of economies through trade, investment, technology and cultural exchange.
End-of-Chapter Trial Paper & Test Questions
Topic-wise questions to test your understanding of every concept in this chapter.
-
Define international trade and state one way it differs from domestic trade. / अंतर्राष्ट्रीय व्यापार को परिभाषित कीजिए तथा घरेलू व्यापार से इसका एक अंतर बताइए।
Show answer
International trade is the exchange of goods, services and capital across national borders; unlike domestic trade it crosses national boundaries and involves different currencies, tariffs and policies. / अंतर्राष्ट्रीय व्यापार राष्ट्रीय सीमाओं के पार वस्तुओं, सेवाओं और पूँजी का आदान-प्रदान है; घरेलू व्यापार के विपरीत यह राष्ट्रीय सीमाओं को पार करता है तथा इसमें भिन्न मुद्राएँ, शुल्क और नीतियाँ शामिल होती हैं।
-
Distinguish between visible and invisible trade with one example each. / दृश्य और अदृश्य व्यापार में अंतर एक-एक उदाहरण सहित स्पष्ट कीजिए।
Show answer
Visible (merchandise) trade is exchange of physical goods, e.g., crude oil; invisible trade is exchange of services and transfers, e.g., IT/software exports or remittances. / दृश्य (माल) व्यापार भौतिक वस्तुओं का आदान-प्रदान है, जैसे कच्चा तेल; अदृश्य व्यापार सेवाओं तथा हस्तांतरणों का आदान-प्रदान है, जैसे आईटी/सॉफ्टवेयर निर्यात या प्रेषण।
-
If a country's export price index is 130 and import price index is 100, calculate the terms of trade and interpret it. / यदि किसी देश का निर्यात मूल्य सूचकांक 130 तथा आयात मूल्य सूचकांक 100 है, तो व्यापार की शर्तें ज्ञात कीजिए और उसकी व्याख्या कीजिए।
Show answer
ToT = (130/100) × 100 = 130, an improvement of 30%, meaning exports now buy 30% more imports than in the base year. / व्यापार शर्त = (130/100) × 100 = 130, अर्थात 30% सुधार, जिसका अर्थ है कि निर्यात अब आधार वर्ष की तुलना में 30% अधिक आयात खरीद सकते हैं।
-
Using comparative advantage, explain why India specialises in IT services exports. / तुलनात्मक लाभ के आधार पर समझाइए कि भारत आईटी सेवाओं के निर्यात में विशेषज्ञता क्यों रखता है।
Show answer
India has an abundant, skilled, English-speaking workforce, giving it a lower opportunity cost in producing IT/software services, so it specialises in and exports them. / भारत के पास प्रचुर, कुशल, अंग्रेज़ी-भाषी श्रमशक्ति है, जिससे आईटी/सॉफ्टवेयर सेवाओं के उत्पादन में उसकी अवसर लागत कम है, अतः वह इनमें विशेषज्ञता रखकर इनका निर्यात करता है।
-
State the balance of payments (BoP) identity and name its three main components. / भुगतान संतुलन (BoP) की समीकरण लिखिए तथा इसके तीन मुख्य घटकों के नाम बताइए।
Show answer
Identity: Current Account + Capital Account + Financial Account + Errors & Omissions = 0; main components are the current account, capital account and financial account. / समीकरण: चालू खाता + पूँजी खाता + वित्तीय खाता + त्रुटियाँ एवं चूक = 0; मुख्य घटक हैं चालू खाता, पूँजी खाता और वित्तीय खाता।
-
Differentiate between a tariff and a quota as trade policy instruments. / व्यापार नीति उपकरणों के रूप में टैरिफ और कोटा में अंतर कीजिए।
Show answer
A tariff is a tax on imports that raises their price and gives the government revenue; a quota is a quantitative limit on imports that raises domestic prices, with quota rents going to quota holders rather than government. / टैरिफ आयात पर लगाया गया कर है जो उनका मूल्य बढ़ाता है और सरकार को राजस्व देता है; कोटा आयात की मात्रात्मक सीमा है जो घरेलू मूल्य बढ़ाता है, जिसमें कोटा लाभ सरकार के बजाय कोटा धारकों को मिलता है।
-
Name the WTO core principle of non-discrimination and explain it briefly. / डब्ल्यूटीओ के गैर-भेदभाव के मूल सिद्धांत का नाम बताइए और उसे संक्षेप में समझाइए।
Show answer
The Most Favoured Nation (MFN) principle: a trade concession given to one member must be extended to all WTO members equally. / सर्वाधिक तरजीही राष्ट्र (MFN) सिद्धांत: किसी एक सदस्य को दी गई व्यापार रियायत सभी डब्ल्यूटीओ सदस्यों को समान रूप से देनी होती है।
-
Explain the difference between trade creation and trade diversion in a regional bloc. / किसी क्षेत्रीय गुट में व्यापार सृजन और व्यापार विचलन के बीच अंतर समझाइए।
Show answer
Trade creation occurs when high-cost domestic production is replaced by lower-cost partner imports (welfare rises); trade diversion occurs when lower-cost non-member imports are replaced by higher-cost partner imports due to tariff preferences (welfare may fall). / व्यापार सृजन तब होता है जब उच्च-लागत घरेलू उत्पादन को कम-लागत साझेदार आयातों से बदला जाता है (कल्याण बढ़ता है); व्यापार विचलन तब होता है जब शुल्क वरीयताओं के कारण कम-लागत गैर-सदस्य आयातों को उच्च-लागत साझेदार आयातों से बदला जाता है (कल्याण घट सकता है)।
Related Laws & Principles
Explore allFoundational laws & principles behind this chapter. Each one opens a full page — what it says, why it matters, five practice questions and the mistakes to avoid.