Overview
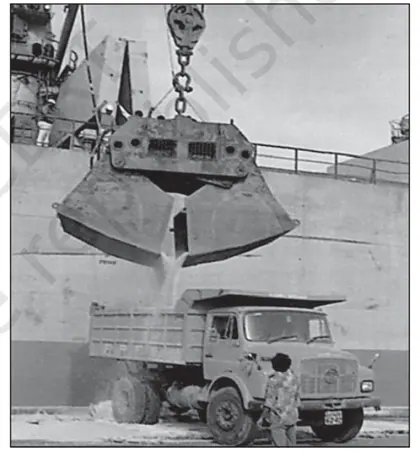
Introduction: This chapter explains the nature, patterns and significance of international trade for India. It defines international trade, distinguishes between visible and invisible trade, and traces changes in the composition and direction of India’s trade since independence. It also explains key concepts such as balance of payments, terms of trade, tariff and non-tariff barriers, and the role of international institutions like the World Trade Organization (WTO). Importance: International trade connects domestic markets to the world, affects economic growth, employment, foreign exchange earnings and the standard of living. For India, trade has shifted from primary commodities to manufactured goods and services (notably IT and software), making it central to development strategy, export promotion and integration into the global economy. Key themes: The chapter covers (1) concepts and classification of trade (visible vs invisible), (2) patterns and direction of India’s exports and imports, major trading partners and commodity composition, (3) balance of payments and trade deficits/surpluses, (4) trade policy and liberalisation since 1991, tariffs and non-tariff barriers, (5)…
Learning Objectives
- Define international trade and related terms such as merchandise trade, invisible trade and balance of trade.
- Explain the significance of international trade for national economic growth and global interdependence.
- Describe the types and forms of international trade (bilateral, multilateral, intra‑industry and inter‑industry trade).
- Distinguish between visible and invisible trade and between favourable and adverse balance of trade with examples.
- Analyse physical, economic, political and technological factors that influence patterns of international trade.
- Examine the spatial pattern and direction of world trade with reference to major trading countries and key commodities.
- Interpret and analyse statistical data on exports and imports to draw conclusions about a country's trade performance.
- Calculate trade balance and terms of trade and demonstrate how price changes affect terms of trade.
Topics in this chapter
19 topics · tap a topic title to jump straight to it.
Meaning and Nature of International Trade
Meaning: International trade is the exchange of goods, services, capital and technology across national borders. It includes visible trade (merchandise — goods) and invisible trade (services, e.g., transport, insurance, tourism, information technology). It is carried out by private firms, governments and multinational corporations and is recorded in a country's balance of payments.
Nature / Characteristics:
- Interdependence: Nations depend on one another for goods and services they do not produce efficiently (e.g., oil-importing countries depend on oil exporters).
- Specialisation and division of labour: Countries specialise in producing goods/services where they have advantage (resources, skills, technology) and trade for the rest.
- Comparative advantage: Trade is driven by relative opportunity costs — countries export products they can produce at lower opportunity cost and import others.
- Visible and invisible flows: International trade includes merchandise (cars, textiles, food) and invisible services (banking, tourism, IT).
- Price influence and world markets: World prices and exchange rates affect a country’s trade competitiveness and trade volumes.
- Role of transport and communication: Efficient transport, ports and ICT reduce trade costs and increase trade intensity.
- Government policy and institutions: Tariffs, quotas, trade agreements (e.g., WTO, regional blocs), and subsidies shape trade patterns.
- Uneven distribution and structural patterns: Trade patterns reflect resource endowments and technology; developed and developing countries often trade different types of goods (capital-intensive vs labour-intensive).
- Dynamic and evolving: Technology, new comparative advantages, and global value chains change trade over time (e.g., outsourcing, digital services).
- Risk and adjustment costs: Exposure to global price swings, competition and structural unemployment can result from trade liberalisation.
Why countries trade (brief economic rationale): To obtain goods/services they lack or cannot produce efficiently, to achieve economies of scale, to access wider markets, to benefit from specialization according to comparative advantage, and to improve welfare through a greater variety of goods at lower prices.
Link to Class 12 Geography context: Understanding the meaning and nature of international trade helps explain spatial patterns of production and export specialisation, the distribution of economic activities, and the role of transport and technology in shaping global connections.
- India exports IT services, textiles and gems & jewellery; it imports crude oil, electronic components and gold. (Shows service exports and commodity dependence.)
- China exports electronics, machinery and manufactured goods worldwide; many countries import finished goods from China (illustrates manufacturing-led export growth).
- Saudi Arabia exports crude oil to energy-importing countries; oil price changes strongly affect trade balances and government revenues (illustrates commodity dependence and vulnerability).
- The USA exports aircraft, soybeans and intellectual property/services while importing consumer goods and electronics (example of specialised high-value and consumer goods trade).
- European Union internal trade: high-volume intra-regional trade among member states due to reduced tariffs and integrated markets (shows effect of trade blocs).
- A small country imports food products and exports tourism services (example of trade in services and the role of comparative advantage based on climate).
- Balance of Trade (goods) = Value of Exports of Goods − Value of Imports of Goods
- Trade Balance (overall) = Exports (goods + services + transfers) − Imports (goods + services + transfers)
- Terms of Trade (TOT) = (Index of Export Prices / Index of Import Prices) × 100 — TOT >100 implies export prices rose relative to import prices
- Export-Import Ratio (%) = (Value of Exports / Value of Imports) × 100 — shows dependence on exports or imports
- Trade Volume = Value of Exports + Value of Imports
- Net Exports (NX) = Exports − Imports — used in macroeconomic open-economy models
Types and Forms of International Trade
Definition: International trade is the exchange of goods and services across national borders. It allows countries to obtain products they cannot produce efficiently and to sell what they can produce competitively.
Major classifications:
- By commodity (Visible vs Invisible trade):
- Visible (Merchandise) trade: Trade in tangible goods that cross borders — raw materials, agricultural produce, manufactured goods. Recorded in merchandise trade statistics.
- Invisible (Services) trade: Trade in services such as banking, insurance, tourism, transport, IT and professional services. These do not involve physical goods crossing borders but generate foreign exchange.
- By direction / function:
- Export: Goods/services sold to other countries.
- Import: Goods/services bought from other countries.
- Re‑export: Imported goods that are exported again without major processing (e.g., Hong Kong, Singapore).
- Entrepôt trade: A port or city acting as a trading hub where goods are stored, sorted and re‑shipped (e.g., Dubai, Singapore, Rotterdam).
- Transit trade: Goods passing through a country en route to another country (e.g., landlocked countries using neighbouring ports).
- By number/scope of partners:
- Bilateral trade: Trade agreement or exchange between two countries.
- Multilateral trade: Trade involving many countries under general rules (e.g., World Trade Organization frameworks).
- Regional / Preferential trade: Trade within a regional bloc or under preferential agreements (e.g., European Union, ASEAN, USMCA).
- By settlement method:
- Monetary trade: Standard transactions settled in convertible currencies.
- Barter: Direct exchange of goods for goods (rare in modern large‑scale trade).
- Countertrade: Exchange arrangements where payment is partially in goods or services instead of cash (used where foreign exchange is scarce).
Patterns and implications: Developed countries tend to export high‑value manufactured goods and services (invisibility growing), while many developing countries export primary commodities and raw materials. Entrepôt and re‑export hubs (Singapore, Dubai, Hong Kong) illustrate the importance of location, port facilities and finance in modern trade.
Relevance to Class 12 geography: Understanding these types helps explain trade statistics, trade balances, how trade shapes regional linkages (trade blocs), and the economic role of ports and service sectors in globalization.
- Visible trade: India exports textiles and information technology hardware; imports crude oil and electronic components.
- Invisible trade: Indian IT services exported to the US and Europe; international tourism receipts for Thailand.
- Entrepôt trade: Singapore imports goods, consolidates, and re‑exports them across Southeast Asia.
- Re‑export: Hong Kong imports electronics from China and re‑exports to other markets.
- Transit trade: Nepal and Bhutan use Indian ports for international shipments (transit arrangements).
- Bilateral trade: India–United States trade agreements and exchanges between the two countries.
- Trade balance (net exports) = Exports (X) − Imports (M)
- Trade balance as percentage of GDP = (X − M) / GDP × 100
- Terms of trade (ToT) = (Index of export prices / Index of import prices) × 100
- Export–import ratio = Exports / Imports × 100
- Openness (trade/GDP) = (Exports + Imports) / GDP × 100
Factors Influencing International Trade
Overview
International trade is shaped by multiple interacting factors — physical, economic, political, social and technological. These determine what goods and services countries exchange, with whom, in what volumes, and at what prices. Understanding these factors explains patterns such as why oil flows from the Middle East, garments from Bangladesh, and advanced machinery from Germany.
Major factors
- Natural resources and physical geography
Availability of raw materials (minerals, oil, fertile land) and climatic conditions influence exports. Resource-rich countries export primary commodities while those lacking resources import them. Coastal location and access to navigable waterways reduce transport costs and increase trade. - Location and transport costs
Proximity to markets reduces freight and time costs, affecting trade intensity. Important transport routes (Suez, Panama canals) and infrastructure (ports, railways) strongly shape trade patterns. - Comparative and absolute advantage
Countries specialise in producing goods with lower opportunity cost (comparative advantage) and trade for others — the core economic reason for gains from trade. - Technology and production capacity
Technological capability raises productivity, creates exportable complex products (electronics, machinery), and lowers unit costs, increasing competitiveness in world markets. - Labour force and human capital
The size, skill level and cost of labour influence what a country can competitively export — labour-intensive manufactures from low-wage countries, knowledge-intensive services from skilled economies. - Prices, costs and exchange rates
Relative prices, wages, input costs and exchange rate movements affect competitiveness. A depreciation makes exports cheaper and imports costlier (ceteris paribus). - Domestic economic structure and market size
Large domestic markets facilitate economies of scale and support production for export. Small economies often specialise in niche products or integrate into global value chains. - Trade policy and institutions
Tariffs, quotas, export incentives, customs efficiency, and membership of trade agreements (e.g., EU, ASEAN) govern market access and trade flows. Preferential agreements reduce barriers between members and increase intra-bloc trade. - Political relations and stability
Diplomatic ties, sanctions, wars and political stability influence reliability of markets and willingness to trade. Political risk can divert trade to safer partners. - Multinational corporations and global value chains
MNCs coordinate production across countries; components cross borders multiple times. This fragmentation affects trade composition and increases intra-firm trade. - Cultural, historical and colonial ties
Common language, legal systems, migration links and historical ties (former colony–coloniser) often strengthen trade links because of lower transaction costs and trust. - Consumer preferences and product differentiation
Demand for branded, differentiated products drives exports of manufactured and high-value services where reputation and quality matter. - Global shocks and business cycles
Recessions, pandemics, commodity price swings, supply-chain disruptions (e.g., Suez Canal blockage) and protectionist measures can abruptly alter trade patterns.
How these factors interact
No single factor acts alone. For example, a country with abundant cotton (natural resource) plus low-cost labour (economic factor) and favourable trade policy (institutional factor) will tend to become a major textile exporter. Technology and infrastructure determine whether it moves from raw cotton exports to finished garments.
Implications for development and policy
Governments aiming to expand trade focus on improving infrastructure, education, reducing trade barriers, joining trade agreements, stabilising macroeconomic variables (like exchange rates) and creating a predictable regulatory environment to attract investment and integrate into global value chains.
- Saudi Arabia and oil: Large oil reserves + export-oriented infrastructure → major crude-oil exports to Europe, Asia and North America.
- Bangladesh and garments: Low-cost labour + favourable trade arrangements and foreign investment → garments export boom to EU and US markets.
- Germany and machinery/automobiles: Advanced technology, skilled labour and R&D → high-value manufactured exports (cars, precision machinery).
- India and IT services: Large skilled English-speaking workforce + digital infrastructure → exports of software and services worldwide.
- Suez Canal blockage (2021): A single maritime chokepoint disruption increased shipping costs and delayed global trade flows, illustrating transport-route vulnerability.
- US-China trade tensions: Tariffs and counter-tariffs changed trade flows, pushed some manufacturers to diversify supply chains to Southeast Asia.
- Trade balance = Total exports − Total imports (can be positive (surplus) or negative (deficit)).
- Trade openness (or trade-to-GDP ratio) = (Exports + Imports) / GDP × 100 — measures degree of integration with world trade.
- Net barter terms of trade (NBTT) = (Index of export prices / Index of import prices) × 100 — if >100, terms of trade have improved.
- Revealed Comparative Advantage (RCA, Balassa index) for product i = (Exports_i_country / Total exports_country) / (World exports_i / World total exports). RCA > 1 suggests comparative advantage.
- Export/Import elasticity (price elasticity) = % change in quantity demanded (exports or imports) / % change in price — used to predict effect of price/exchange rate changes on trade volumes.
Commodity Composition of Trade
The commodity composition of trade describes what kinds of goods and services a country exports and imports and the relative share of each category in total trade. It shows whether a country trades mainly in primary commodities (raw materials and food), manufactured goods, or services. Understanding composition helps explain patterns of specialization, comparative advantage, economic development and vulnerability to external shocks.
Key components:
- Primary commodities: agricultural products, minerals, fuels, raw materials (e.g., wheat, coffee, crude oil, iron ore).
- Manufactured (secondary) goods: processed or finished products and machinery (e.g., automobiles, electronics, textiles, chemicals).
- Services (tertiary): intangible exports and imports such as tourism, transport, insurance, IT and business services.
Typical patterns:
- Developed countries tend to export high‑value manufactured goods and services (machinery, pharmaceuticals, finance, IT).
- Many developing countries export a larger share of primary commodities and some labor‑intensive manufactures (agricultural goods, minerals, garments).
- Over time global trade has shifted toward manufactured goods and services because of industrialization, technological progress and global value chains.
Determinants of commodity composition:
- Resource endowment (natural resources, climate, land).
- Level of industrialization and technology.
- Comparative advantage and factor costs (labor, capital).
- Trade policies, tariffs, trade agreements.
- Foreign direct investment and participation in global value chains.
Consequences and policy implications:
- Specialization in a narrow set of primary commodities can increase vulnerability to price swings and deteriorating terms of trade.
- Export diversification into higher value‑added manufactures or services can promote stable growth and employment.
- Participation in global value chains often changes the commodity composition (more intermediate goods and services trade).
Measurement and indicators commonly used include commodity shares (% of total exports/imports), growth rates of commodity groups, concentration indices and revealed comparative advantage (to identify areas of specialization).
- Saudi Arabia: high share of crude oil exports (primary commodity) dominating export earnings.
- China: large share of manufactured goods (electronics, machinery, textiles) in exports.
- India: growing share of services exports (IT and business process services) alongside pharmaceuticals and textiles.
- Brazil: major agricultural and primary exports (soybeans, beef, iron ore), with increasing processed food and industrial exports.
- Bangladesh: garments and textiles are the dominant export commodity, a labour‑intensive manufactured sector.
- Norway: oil and gas exports (primary/fuel) with high export revenues despite small population.
- Share of commodity group (%) = (Value of exports of commodity group / Total exports) × 100
- Growth rate of exports (annual %) = [(Value in current year − Value in previous year) / Value in previous year] × 100
- \[Revealed Comparative Advantage (Balassa index) RCA_{i,j} = (X_{i,j} / X_{t,j}) / (X_{i,w} / X_{t,w})\]\[where X_{i,j} = exports of commodity i by country j\]\[X_{t,j} = total exports of country j\]\[X_{i,w} = world exports of commodity i\]\[X_{t,w} = total world exports\]\[RCA > 1 implies specialization in commodity i.\]
- Herfindahl‑Hirschman Index (export concentration) HHI = Σ(s_i^2), where s_i is the share (in %) of commodity i in a country’s exports; higher HHI = greater concentration and less diversification.
- Export‑import ratio (%) = (Total exports / Total imports) × 100
- Terms of Trade (index) = (Export price index / Import price index) × 100 — rising index means favourable terms of trade.
Direction of Trade
Definition: The "Direction of Trade" shows which countries or regions a nation sells to (exports) and buys from (imports). It identifies the geographical pattern of a country's external trade flows and how these flows change over time.
What it tells us: Direction of trade reveals major trading partners, regional concentrations, product flows to/from particular partners, and changing patterns due to economic growth, policy, or global events. It helps in policy making (agreements, diversification), risk assessment (dependence on a partner), and planning infrastructure (ports, logistics).
Key determinants:
- Geographical proximity & transport costs: Nearby countries often trade more due to lower shipping costs.
- Factor endowments & comparative advantage: Countries export goods they produce cheaply (raw materials, manufactured products, services).
- Size of economy & demand: Large economies import more and offer large markets for exports.
- Historical, cultural & linguistic ties: Former colonies, shared language or diaspora ties often increase trade.
- Trade policies & agreements: FTAs, tariffs and quotas shape flows toward preferential partners.
- Exchange rates & price competitiveness: Currency movements affect the attractiveness of exports/imports.
- Political relations & stability: Sanctions or close political ties influence trade direction.
Patterns and changes: The direction of trade may be dominated by a few partners (concentration) or widely diversified. Over time, directions change due to industrialisation, discovery of resources, new trade agreements, technological change (e.g., services/IT exports), or shifting supply chains (e.g., firms relocating manufacturing).
Relevance to India (illustrative): India traditionally imports crude oil and petroleum products from Middle Eastern countries and refined/unfinished manufactured items and electronics from East Asian producers; it exports services (IT, software), textiles, pharmaceuticals and agricultural products to markets such as the USA, EU and Gulf countries. These tendencies reflect resource needs, comparative advantage in services and manufactured goods, and large diaspora and trade ties.
How analysts present direction of trade: Using partner shares (percentage of total trade), bilateral trade balances, maps of trade flows, time-series of partner shares, and commodity–partner matrices showing which products go to which markets.
Policy implications: High concentration on a few partners increases vulnerability (recommendation: diversify markets/products). Shifts toward high-value manufactures or services may require infrastructure and skill investments. Bilateral/regional agreements can be used to reorient trade direction.
- India imports a large share of crude oil from Middle Eastern countries — this shapes the direction of its imports toward that region.
- Many European countries import specialized machinery and luxury goods from China — illustrating how cost and scale shape trade direction.
- India exports IT services and software mostly to the USA and European markets due to demand, language compatibility and presence of service firms.
- A country signing a free trade agreement (FTA) with a neighboring bloc often sees its exports to that bloc rise, changing its trade direction over time.
- Trade balance = Exports (X) − Imports (M)
- Export–import ratio = X / M
- Trade openness (%) = (X + M) / GDP × 100
- Partner share (%) = (Trade with partner / Total trade) × 100
- \[Annual growth rate of trade (%) = ((T_t − T_{t−1}) / T_{t−1}) × 100\]\[where T is exports\]\[imports or total trade\]
- Revealed Comparative Advantage (RCA) for product i = (Exports_i_country / Total exports_country) ÷ (World exports_i / Total world exports)
Transport, Communication and Trade Facilitation
Overview
Transport, communication and trade facilitation are interlinked elements that determine how efficiently goods and services move across national borders. Transport moves physical goods; communication transmits information needed to plan, track and settle transactions; trade facilitation comprises procedures, rules and infrastructure that reduce delays and costs at border and logistics nodes.
Role in International Trade
- Lower transport and communication costs increase competitiveness and expand market access.
- Efficient trade facilitation reduces border delays, cutting total trade costs and time to market.
- Improved connectivity supports global value chains, enabling fragmentation of production.
Transport: Modes and Characteristics
- Sea (maritime): Cheapest per ton-km for bulky and long-distance cargo; relies on containerization and large ports. Key for over 80% of global trade by volume.
- Road: Flexible for short and last-mile delivery; higher per-unit cost, influenced by road quality and border procedures.
- Rail: Cost-effective for intermediate distances and bulk; expanding importance for Eurasian land routes (e.g., China-Europe corridors).
- Air: Fastest, highest cost; used for high-value, perishable or time-sensitive goods.
- Pipelines: Specialized for liquids and gases (oil, gas); very low operating cost per unit once built.
- Multimodal/Intermodal: Combination of modes using containerization and standardized handling to reduce transfer time and damage.
Communication: Systems and Importance
- Telecommunication networks (internet, mobile, satellite, VSAT) enable documentation, e‑commerce, tracking, and electronic payments.
- Information systems (EDI, Port Community Systems, Customs IT) speed up paperwork and reduce human errors.
- Navigation and tracking technologies (GPS, AIS) improve safety and predictability of shipments.
- Undersea cables and satellites form the backbone of cross-border digital commerce and finance.
Trade Facilitation: Measures and Mechanisms
- Customs modernization: Risk-based inspections, pre-arrival processing, simplified tariff classification.
- Single Window: One electronic portal for submission of all trade documents (licenses, certificates, declarations).
- Electronic Data Interchange (EDI) and paperless trade to reduce processing time and corruption risk.
- Containerization and port modernization: Cranes, IT-driven terminals, hinterland connectivity to cut dwell time.
- Logistics hubs and SEZs: Consolidation centers, bonded warehouses, value-added services to streamline supply chains.
- Trade agreements & standards: Harmonized rules of origin, mutual recognition, and common standards to reduce non-tariff barriers.
- International frameworks: WTO Trade Facilitation Agreement (TFA) sets commitments for faster release and simplified border procedures.
Benefits
- Reduced cost and time of trade, leading to higher trade volumes and economic growth.
- Greater participation of SMEs in export markets through reliable logistics and digital communication.
- Improved predictability and lower inventory costs for firms—supports just-in-time production.
Challenges
- Infrastructure gaps (poor roads, congested ports, limited rail links) raise costs.
- Regulatory fragmentation, corruption and complex documentation create delays.
- Geopolitical risks and chokepoints (e.g., narrow straits) threaten reliability.
- Digital divide and cybersecurity risks affect reliability of communication systems.
Policy & Practical Steps to Improve
- Invest in multimodal connectivity (roads, rail, ports, inland waterways) and hinterland links.
- Adopt single window and paperless trade systems, modern customs technologies and risk management.
- Promote containerization, logistics parks and bonded warehouses to speed throughput.
- Negotiate mutual recognition for standards and simplify rules of origin under FTAs.
- Strengthen digital infrastructure and cybersecurity for secure, fast communication.
Summary
Efficient transport and communication, supported by strong trade facilitation measures, lower total trade costs and times. Together they enable countries to integrate into global value chains and increase export competitiveness. Investments in infrastructure, IT systems and regulatory reforms are critical to reap these benefits.
- Suez Canal expansion (2015): Reduced ship transit time for key Europe–Asia routes, lowering shipping costs and easing congestion.
- Trans-Siberian Railway and China-Europe rail freight: Faster land link between East Asia and Europe, important for time-sensitive and higher-value goods.
- Containerization and Maersk/Hapag-Lloyd services: Standard 20/40-foot containers enabled seamless multimodal transport and fast handling in ports worldwide.
- Single Window in Singapore (TradeNet): Electronic submission of trade documents reduced clearance time and made Singapore a leading transshipment hub.
- WTO Trade Facilitation Agreement (TFA): Encourages pre-arrival processing, reduced inspections, and electronic payment systems to ease cross-border trade.
- Port of Rotterdam and JNPT (Jawaharlal Nehru Port Trust): Examples of large, modern container terminals with hinterland connectivity that improve throughput and reduce dwell time.
- Trade-to-GDP ratio (%) = (Exports + Imports) / GDP × 100
- Modal share of transport (%) = (Volume by mode / Total transport volume) × 100
- Basic transport cost per shipment C = F + v × d, where F = fixed cost per shipment, v = variable cost per unit distance, d = distance
- Freight cost per ton-km = Total freight cost / (tons × distance in km)
- CAGR (growth of throughput) = (End value / Start value)^(1/n) − 1, where n = number of years
Trade Theories and Concepts
Introduction: International trade is exchange of goods and services across countries. Trade theories explain why countries trade, what they export/import and the gains from trade.
1. Historical idea — Mercantilism: Prevailing from 16th–18th centuries, mercantilists argued that national wealth is measured by stock of precious metals and that exports should exceed imports (trade surplus). Policy implication: government intervention, protectionism and colonial trade.
2. Classical theories
Absolute advantage (Adam Smith): A country has an absolute advantage if it can produce more of a good using the same resources than another country. Specialization in goods with absolute advantage increases total world output.
Comparative advantage (David Ricardo): Even if one country is less efficient in producing all goods, mutual gains are possible if each specializes in the good with a lower opportunity cost. Comparative advantage is the fundamental reason for trade.
3. Modern (neoclassical) theories
Heckscher–Ohlin (H–O) theory: Countries export goods that intensively use their abundant factors (labour, capital, land) and import goods that use their scarce factors. E.g., labour-abundant countries export labour-intensive products.
Factor-price equalisation (related result): Free trade tends to equalize returns to factors (wages, rents) across countries.
4. Product Life-Cycle theory (Raymond Vernon): A product passes through stages (innovation, growth, maturity, standardization). Initially produced and exported by innovating advanced country; later production may shift to lower-cost countries as product standardizes.
5. New Trade Theory and Imperfect Competition (Krugman and others): Emphasizes economies of scale, network effects and differentiated products. Explains intra-industry trade (similar countries both import and export similar goods) and importance of firms, rather than only factor endowments.
Key concepts and terms
- Terms of trade (TOT): Ratio of export prices to import prices — indicates how many imports can be bought per unit of exports (see formula).
- Balance of trade: Exports minus imports (goods and services).
- Balance of payments: Record of all economic transactions between residents of a country and the rest of the world (current account + capital & financial accounts + errors).
- Protectionism: Tariffs, quotas, subsidies to protect domestic industries.
- Free trade: Removal of barriers to allow markets to allocate resources; promoted by institutions like WTO.
- Dumping: Selling exports below domestic price or cost to gain market share — often contested under WTO rules.
Gains from trade (summary): Through specialization based on comparative advantage, countries can consume beyond their production possibility frontiers (PPFs), improve efficiency, access variety, and exploit economies of scale.
- Comparative advantage (simple): Country A produces either 10 units of cloth or 5 units of wine per day; Country B produces 6 cloth or 4 wine per day. A has lower opportunity cost of cloth and should specialize in cloth; B should specialize in wine. By specializing and trading they can both be better off.
- Absolute advantage: Saudi Arabia produces crude oil much more efficiently than many countries; it exports oil and imports many manufactured goods.
- Heckscher–Ohlin: Bangladesh (labour-abundant) exports labour-intensive garments; Germany (capital-abundant) exports capital-intensive machinery and automobiles.
- Product Life-Cycle: Early iPhones were designed and first assembled in the USA; over time large parts of assembly shifted to China and other Asian countries as production standardized.
- New Trade/Scale economies: The automobile and smartphone industries show intra-industry trade—countries both import and export similar differentiated models (e.g., Germany and Japan exporting different car brands).
- Protectionism example: US steel tariffs (2018) imposed to protect domestic industry; resulted in higher domestic prices and trade tensions.
- Opportunity cost of Good X = (Quantity of Good Y forgone) / (Quantity of Good X produced).
- Comparative advantage condition: Country A has comparative advantage in Good X if OpportunityCost_A(X) < OpportunityCost_B(X).
- Terms of Trade (Net barter terms) = (Index of export prices / Index of import prices) × 100.
- Income terms of trade (rough) = (Export price index / Import price index) × Export volume index (shows effect on real export earnings).
- Balance of Trade = Value of Exports − Value of Imports.
- Balance of Payments identity: Current Account + Capital Account + Financial Account + Net Errors & Omissions = 0.
Trade Policies and Measures
Overview
Trade policies and measures are the instruments used by governments to regulate international trade flows of goods and services. They aim to protect domestic industries, influence the balance of payments, generate revenue, promote exports, or achieve political objectives. Policies may be restrictive (protective) or liberating (liberalisation).
Types of trade policy measures
- Tariffs (Customs duties) – taxes on imported goods. They raise domestic prices of imports, protect local producers and generate government revenue. Two common forms: ad valorem (percentage of value) and specific (fixed fee per unit).
- Quotas – quantitative limits on imports of specific goods (absolute or tariff-rate quotas). Quotas restrict supply and support domestic producers.
- Subsidies and export incentives – financial support (cash grants, tax relief, cheap credit) given to domestic firms to lower production costs and promote exports.
- Anti-dumping and countervailing duties – additional duties imposed when foreign producers sell below fair market value (dumping) or when foreign subsidies harm domestic industry.
- Non-tariff barriers (NTBs) – technical standards, sanitary/phytosanitary measures, licensing, local content requirements, customs procedures and bureaucratic red tape that restrict trade indirectly.
- Voluntary export restraints (VERs) and embargoes – export limits agreed by exporting country or total bans for political reasons.
- Exchange rate policy & capital controls – devaluation to boost exports or controls on capital flows to stabilise the balance of payments.
- Trade agreements and regional integration – FTAs, customs unions, common markets and preferential agreements (e.g., EU, USMCA, RCEP) that reduce or remove barriers among members.
- Trade liberalisation – reducing tariffs/NTBs and opening up markets (e.g., India’s 1991 reforms). Often encouraged by multilateral institutions such as the WTO.
Objectives
- Protect infant/domestic industries and employment
- Correct unfavourable balance of payments
- Generate government revenue
- Promote industrialisation (import substitution) or export-led growth
- Safeguard health, environment and national security
Effects and trade-offs
Protective measures raise domestic prices and reduce consumer welfare but benefit producers. Tariffs generate revenue but can cause retaliation and reduce export opportunities. Subsidies improve competitiveness but can distort markets and provoke trade disputes. Trade liberalisation can increase efficiency, consumer choice and growth, but can harm uncompetitive industries and increase short-term unemployment.
Institutions and rules
The World Trade Organization (WTO) sets multilateral rules to limit protectionism (most-favoured-nation principle, national treatment). Dispute settlement mechanisms help resolve trade conflicts. Regional agreements provide deeper integration among members.
Policy sequencing & development
Successful use of measures often requires sequencing: selective protection for infant industries, parallel investments in productivity, export promotion, and eventual liberalisation to enhance competitiveness.
- India's 1991 economic reforms: liberalisation reduced tariffs, removed many quantitative restrictions and promoted foreign investment, leading to increased trade openness.
- US-China tariff dispute (2018–2019): the US imposed significant tariffs on Chinese imports; China retaliated with tariffs on US goods—example of tariffs used as policy and for political leverage.
- European Union's Common Agricultural Policy (CAP): long-standing subsidies and price supports to protect farmers, often criticised for distorting world agricultural markets.
- China's support to some manufacturing sectors (subsidies, cheap credit) that led to anti-dumping and countervailing cases at the WTO and by other countries.
- Export quotas on textiles in the past (Multi-Fibre Arrangement) limited exports from developing countries; its phase-out under WTO rules changed global garment trade patterns.
- Brexit: the UK leaving the EU required creation of new tariff schedules, rules of origin and trade measures between the UK and EU and third countries.
- Balance of Trade (BOT) = Value of Exports (X) − Value of Imports (M)
- Terms of Trade (TOT) = (Index of Export Prices / Index of Import Prices) × 100
- Tariff Revenue ≈ Tariff Rate × Value of Imports (after tariff) (simple approximation)
- Effective Rate of Protection (ERP) = [(Value added under tariffs − Value added without tariffs) / Value added without tariffs] × 100 (measures protection on value added, not just on final price)
- Balance of Payments identity: Current Account + Capital & Financial Account + Errors & Omissions = 0 (or mirrored by change in official reserves)
Trade Barriers and Non-tariff Measures
Definition: Trade barriers are government-imposed measures that restrict or distort international trade in goods and services. They include tariffs (taxes on imports) and non-tariff measures (NTMs) — laws, regulations or administrative procedures that affect trade flows without a direct tax.
Why they are used: Protect infant or vulnerable industries, safeguard public health and safety, preserve strategic resources, correct balance-of-payments, raise government revenue, or as a bargaining tool in trade policy.
Major types
- Tariff barriers — ad valorem tariffs (percentage of value), specific tariffs (fixed amount per unit), and compound tariffs (combination of both).
- Quota — quantitative limits on imports (absolute quota) or tariff-rate quotas (small quantity at low tariff, above that higher tariff).
- Import licensing and administrative delays — requirement to obtain permission before importing, slow customs clearance that raises cost.
- Voluntary export restraints (VERs) and embargoes — export limits negotiated or imposed; full bans on trade with certain countries.
- Technical barriers to trade (TBT) — product standards, labelling, packaging rules, testing and certification requirements.
- Sanitary and Phytosanitary measures (SPS) — health, safety and animal/plant protection rules (e.g., restrictions on certain food additives or animal products).
- Anti-dumping and countervailing duties — additional charges to counter 'dumped' prices or subsidized imports.
- Local content and government procurement preferences — rules favoring domestic inputs or suppliers.
- Export restrictions and subsidies — bans or taxes on exports; subsidies to domestic producers to boost exports.
- State trading and currency controls — state monopolies on trade and restrictions on foreign exchange or capital flows.
Economic effects
- Raise domestic prices of imported goods, benefiting protected producers but harming consumers (higher consumer prices, lower consumer surplus).
- Create government revenue (tariffs), or transfer rents to quota holders/licence owners (quotas/VERs).
- Cause deadweight welfare losses: consumption loss and production inefficiency.
- Distort resource allocation and reduce trade volume and variety of goods available.
- May trigger retaliation and trade wars, reducing overall welfare internationally.
- NTMs intended for safety or quality can be legitimate but can also be used as disguised protectionism.
Role of international rules — WTO disciplines tariffs and many NTMs (e.g., SPS and TBT agreements), seeks transparency, and provides dispute settlement to limit arbitrary trade restrictions.
How to identify if a measure is protectionist — look at its trade-restrictiveness, whether it is discriminatory (favoring domestic over foreign suppliers), whether it is based on legitimate public policy goals, and if alternatives exist that are less trade-restrictive.
Short summary: Tariffs are direct taxes on trade; NTMs are diverse regulatory or administrative measures that can restrict trade indirectly. Both affect prices, quantities, welfare and the pattern of international trade; policy and multilateral rules try to balance legitimate public goals and the benefits of open trade.
- US steel and aluminum tariffs (Section 232, 2018): ad valorem tariffs imposed for national security reasons; raised domestic steel prices and provoked retaliatory tariffs.
- EU ban on hormone-treated beef: an SPS/TBT measure that restricted imports from countries allowing the practice; led to long WTO litigation.
- 1980s voluntary export restraints (VERs) on Japanese automobile exports to the US: quantity limits led to higher US car prices and benefits for US manufacturers.
- China restrictions on rare-earth exports (circa 2010): export quotas and licensing reduced global supply and caused an international dispute.
- Tariff-rate quotas in agriculture (e.g., sugar or dairy): a low or zero tariff up to a quota, then higher tariffs above it, protecting domestic producers while allowing some imports.
- Anti-dumping duties on certain steel or chemical imports: many countries (including India and the EU) use anti-dumping to raise import costs from targeted exporters.
- Ad valorem tariff (amount) = t × CIF value (where t = tariff rate as a decimal; CIF = cost, insurance, freight value per unit).
- Specific tariff (amount) = s × quantity (where s = fixed tariff per physical unit).
- Compound tariff = (s × quantity) + (t × value).
- Import revenue = Sum over imports of (tariff amount × quantity imported).
- Nominal Rate of Protection (NRP) (%) = ((Domestic price with tariff - World price) / World price) × 100.
- Effective Rate of Protection (ERP) (%) = ((Value added with tariffs - Value added at world prices) / Value added at world prices) × 100. (ERP measures how tariffs on final goods and inputs change the protection actually given to domestic value-added.)
International Trade Organizations and Agreements
Definition and importance
International trade organizations and agreements are institutional frameworks and formal arrangements that govern and facilitate cross-border exchange of goods, services, capital and technology. They reduce trade barriers, provide rules for dispute settlement, stabilize payments, and promote economic growth, specialisation and global cooperation.
Types of agreements
- Bilateral agreements — trade arrangements between two countries (example: India–Sri Lanka FTA).
- Regional agreements — groups of neighbouring or linked economies (example: European Union (EU), ASEAN, United States–Mexico–Canada Agreement (USMCA)).
- Multilateral agreements — broad agreements involving many countries under a common institution (example: WTO agreements such as GATT, GATS, TRIPS).
- Preferential Trade Agreements (PTAs), Free Trade Areas (FTAs), Customs Unions, Common Markets and Economic Unions — progressive levels of economic integration with varying removal of tariffs, common external tariffs and factor mobility.
Major international organizations
- World Trade Organization (WTO) — successor to GATT; sets rules for trade in goods, services and intellectual property; runs the Dispute Settlement Mechanism; promotes non-discrimination (MFN and national treatment).
- International Monetary Fund (IMF) — provides short- to medium-term balance of payments support, surveillance of global financial stability, policy advice and technical assistance.
- World Bank Group — provides long-term loans and grants for development projects (IBRD, IDA) to reduce poverty and build infrastructure that enables trade.
- UN Conference on Trade and Development (UNCTAD) — focuses on development-friendly integration of developing countries into the world economy.
- World Intellectual Property Organization (WIPO) — sets and administers international rules for intellectual property protection affecting trade in creative and technological goods.
Key principles and instruments
- Most-Favoured-Nation (MFN) — equal trading treatment among WTO members unless a special agreement exists.
- National treatment — imported and locally produced goods should be treated equally after import.
- Tariffs and non-tariff barriers (NTBs) — duties, quotas, subsidies, technical standards and sanitary regulations that affect trade flows.
- Trade liberalisation — phased reduction of tariffs and NTBs through negotiations and rounds (e.g., Uruguay Round led to WTO).
Impacts on countries
- Positive: expanded markets, efficiency gains from comparative advantage, technology transfer, foreign investment inflows, economies of scale.
- Negative or challenging: adjustment costs for uncompetitive sectors, vulnerability to global shocks, asymmetric benefits favouring richer economies, possible loss of policy space.
Recent and notable examples and developments
- US–China trade tensions — use of tariffs and counter-tariffs illustrating how bilateral disputes can affect global supply chains.
- RCEP — a large Asia-Pacific FTA (ASEAN + China, Japan, South Korea, Australia, New Zealand) that demonstrates regional integration without full harmonisation.
- USMCA — modernised NAFTA with new rules on automotive content, labour and digital trade.
- EU single market and customs union — high level of economic integration with free movement of goods, services, capital and labour, and a common external tariff for many members.
- AfCFTA — African Continental Free Trade Area aiming to boost intra-African trade by removing tariffs and creating a single market.
Role in geography curriculum
Understanding these organisations and agreements helps explain spatial patterns of exports and imports, distribution of industries, global production networks, and regional disparities in development.
How students should approach the topic
- Learn the objectives and functions of each major organisation and differences between types of agreements.
- Use current examples (trade disputes, new FTAs) to link theory to real-world events.
- Interpret maps and graphs to show flows, blocs and trends in trade volumes.
- WTO dispute settlement: EU–US ban on hormone-treated beef and subsequent trade disputes resolved under the WTO framework.
- Regional integration: European Union single market enables tariff-free trade and free movement of labour among member states.
- Trade pact: USMCA replaced NAFTA with updated rules on automotive content, labour protections and digital trade.
- Large regional FTA: RCEP connects ASEAN with major Asian economies to lower tariffs and simplify trade rules across Asia-Pacific.
- Development focus: World Bank financing of port and transport infrastructure in developing countries to reduce trade costs.
- Balance of Trade (BOT) = Value of Exports - Value of Imports
- Trade Openness (%) = (Exports + Imports) / GDP × 100
- Export-Import Ratio = Total Exports / Total Imports
- Terms of Trade (TOT) = (Index of Export Prices / Index of Import Prices) × 100
- Net Exports (NX) = Exports - Imports (component of GDP calculation: GDP = C + I + G + NX)
Balance of Payments (BoP)
Definition
The Balance of Payments (BoP) is a systematic record of all economic transactions between the residents of a country and the rest of the world during a given period (usually a year). Every transaction (trade, investment, transfer) is recorded as a credit (inflow) or a debit (outflow).
Main structure / components
- Current Account – records visible and invisible flows:
- Trade (goods) balance: exports of goods − imports of goods
- Services balance: exports of services − imports of services (tourism, transport, IT, etc.)
- Primary income: wages, investment income (interest, dividends) received − paid
- Secondary income: unilateral transfers (remittances, foreign aid) received − paid
- Capital and Financial Account – records capital transfers and cross‑border financial flows:
- Capital account (smaller): capital transfers, acquisition/disposal of non-produced, non-financial assets.
- Financial account (major): foreign direct investment (FDI), portfolio investment, other investment (loans, banking), reserve assets (central bank foreign exchange changes).
- Errors and omissions / Statistical discrepancy – balancing item that ensures BoP sums to zero when measurement imperfections exist.
Accounting identity and interpretation
Because it records every credit and debit, the BoP must balance: the algebraic sum of all accounts (current + capital + financial + errors) equals zero. Practically:
- If the current account is in deficit (more imports, income payments, or transfers than receipts), the deficit must be financed by net capital/financial inflows (borrowing, FDI, portfolio investment) or by using foreign exchange reserves.
- If the current account is in surplus, the country is a net lender to the rest of the world and may accumulate reserves or invest abroad.
Why BoP matters
- Indicates external sustainability: persistent current account deficits may signal vulnerability to external shocks if not financed reliably.
- Affects exchange rates: deficits tend to put depreciation pressure on the currency unless offset by capital inflows/reserves.
- Guides policy: informs fiscal, monetary, trade and exchange rate policy (e.g., promote exports, restrain imports, attract FDI).
Adjustment mechanisms
- Exchange rate changes (currency depreciation makes exports cheaper, imports costlier)
- Change in reserves (central bank uses/saves reserves to smooth payments)
- Capital flow management (controls, regulations to stabilize flows)
- Domestic demand and supply adjustments (reduce import demand, boost competitiveness)
Common real‑world patterns
- Oil‑importing developing countries often run trade deficits because oil imports raise the import bill.
- Capital‑surplus countries (large FDI/portfolio inflows) can finance current account deficits.
- Export‑oriented economies may show current account surpluses and accumulate foreign reserves.
- India: Large imports of crude oil raise the merchandise import bill. India often runs a current account deficit which is financed by net capital inflows (FDI, portfolio flows) and remittances.
- United States: Persistent current account deficits because imports and investment income payments often exceed exports; deficits financed by capital inflows (foreign investment into US assets).
- China (past decades): Large goods export surplus and capital controls enabled accumulation of large foreign exchange reserves (BoP current account surplus financed by reserve accumulation).
- 1997 Asian Financial Crisis: Rapid reversal of short‑term capital inflows caused countries with large current account/short‑term external liabilities to face a BoP crisis and sharp currency depreciations.
- COVID‑19 pandemic: Global trade and travel collapsed temporarily; some countries saw improved current accounts because imports fell more than exports, while others' export decline (e.g., commodities) worsened their BoP.
- Trade (merchandise) balance = Exports of goods − Imports of goods
- Current account balance = Trade balance + Net services + Net primary income + Net secondary income
- BoP identity (accounting) = Current account + Capital account + Financial account + Errors & omissions = 0
- Change in official reserves (ΔR) ≈ − (Current account + Financial account + Capital account + Errors), (sign convention depends on accounting practice)
- If Current account deficit = -X, then Financing sources must satisfy: Net capital inflows + ΔReserves = X
Terms of Trade
Definition: Terms of Trade (TOT) is the ratio between a country's export prices and import prices. It shows how many units of imports can be bought per unit of exports and indicates whether a country is gaining or losing from international trade.
Basic idea: If export prices rise relative to import prices, TOT improve (favourable) — the country can buy more imports for the same value of exports. If export prices fall relative to import prices, TOT deteriorate (unfavourable).
Main measures:
- Net Barter Terms of Trade (NBTT) – compares average export prices with average import prices.
- Income Terms of Trade (ITOT) – adjusts NBTT for the volume (quantity) of exports; shows real purchasing power of export earnings.
- Single-commodity Terms of Trade – ratio of price of a single exported commodity to price of a single imported commodity.
Interpretation:
- NBTT > 100 (relative to a base year or previous period) means improvement in terms of trade.
- NBTT < 100 means deterioration.
- ITOT can move differently from NBTT: even if NBTT improves, export earnings (and thus ITOT) may fall if export volumes drop sharply.
Why TOT matter:
- Indicator of a country's external sector health and ability to import.
- Influences trade policy, exchange rate decisions, and foreign-exchange reserves.
- Important for developing countries that export primary commodities with volatile prices.
Factors affecting Terms of Trade: Changes in world prices of exports/imports, exchange-rate movements, changes in export or import composition, productivity and technology, trade policies (tariffs/subsidies), global demand and supply shocks, and transportation/insurance costs.
Limitations: TOT are price-based and do not by themselves reflect volumes, distributional effects, or welfare fully. They ignore non-price factors (quality, product mix) and services trade unless included in indices.
Policy implications: A persistent deterioration may prompt diversification of exports, value addition, stabilization funds (sovereign wealth), or protective/competitiveness policies.
- 1970s oil price shock: When crude oil prices rose sharply, oil-exporting countries (OPEC members) experienced a marked improvement in their terms of trade because export prices (oil) rose faster than the prices of their imports.
- Developing commodity exporters: A country dependent on coffee or cocoa (primary commodities) may see TOT deteriorate when commodity prices fall on world markets while import prices for manufactured goods remain stable or rise (Prebisch–Singer concern).
- India and crude oil: When global crude prices increase, India’s import bill rises more than its export earnings (since India is a net oil importer), leading to deterioration in India's terms of trade and higher current-account pressure.
- China’s manufactured exports: As China moved into higher-value manufactured goods, export prices and volumes rose, improving its export earnings and strengthening its terms of trade relative to many commodity exporters.
- Net barter terms of trade (NBTT) = (Export price index / Import price index) × 100
- Income terms of trade (ITOT) = NBTT × (Export volume index / 100) or ITOT = (Export price index × Export volume index / Import price index) × 100
- Single-commodity terms of trade = (Price of export commodity / Price of import commodity) × 100
- Interpretation rule: If NBTT > 100 (relative to base) → improvement; NBTT < 100 → deterioration
Foreign Exchange and Exchange Rate
Foreign exchange (forex) means: the currencies, deposits, and instruments (like bank balances, drafts, travellers' cheques, and electronic transfers) used to make international payments. In a narrow sense it refers to actual foreign currency (notes and coins) and bank balances denominated in foreign currency; in a broader sense it includes all claims (assets) and obligations (liabilities) denominated in foreign currencies.
Exchange rate is the price of one currency expressed in terms of another. It tells how much of the domestic currency is required to buy one unit of a foreign currency (direct quotation) or how many units of a foreign currency one unit of the domestic currency will buy (indirect quotation).
Types and concepts
- Quotations: Direct (domestic currency per unit foreign, e.g., ₹83/USD) and Indirect (foreign currency per unit domestic, e.g., $0.012/USD per ₹1).
- Spot rate vs Forward rate: spot = immediate delivery; forward = agreed price for delivery at a future date.
- Nominal vs Real exchange rate: nominal is the quoted rate; real adjusts for price levels between countries (purchasing power).
- Appreciation/Depreciation vs Revaluation/Devaluation: appreciation/depreciation happen under flexible/floating systems (market-driven). Revaluation/devaluation are official changes under fixed-rate regimes.
- Exchange rate regimes: fixed (pegged), floating (market-determined), and managed/dirty float (central bank intervenes to smooth fluctuations).
How rates are determined
- Supply and demand for foreign exchange: exports, imports, capital flows, remittances, tourism, foreign investment, and interest rate differentials affect supply and demand curves and thus the rate.
- International parity relationships: interest rate parity (links spot and forward rates to interest rates), purchasing power parity (long-term link between price levels and exchange rates), and the Fisher effect (inflation and nominal interest rates).
Determinants of exchange rate movements include:
- Trade balance (exports minus imports)
- Capital flows and foreign investment
- Relative inflation and interest rates
- Speculation and market expectations
- Central bank interventions and foreign-exchange reserves
- Political and economic stability
Impacts: A depreciation (domestic currency falls) makes exports cheaper and imports costlier — it may boost export industries but raise inflation. Appreciation has the opposite effects. Exchange rate changes affect inflation, growth, external debt servicing, and competitiveness.
Class-12 focus: Understand definitions, types of quotations, causes of exchange rate changes, how supply–demand determines the rate, basic parity concepts (PPP, interest parity), and impact on trade and balance of payments.
- Currency conversion: If USD/INR (direct quotation) = ₹83.00 per US$1, then US$100 = 100 × 83 = ₹8,300.
- Appreciation example: If INR moves from ₹74/USD to ₹70/USD (fewer rupees needed per US$), the rupee appreciated. Percentage change = (74−70)/74 × 100 ≈ 5.41% appreciation.
- Depreciation example: If EUR/USD moves from 1.10 to 1.20, the euro has depreciated against the dollar (one euro now buys more dollars, meaning dollar strengthened).
- Forward-rate (interest parity) example: Spot S = ₹83/USD, domestic interest rate id = 5% (INR), foreign interest rate if = 2% (USD). Covered forward F ≈ S × (1 + id)/(1 + if) = 83 × 1.05/1.02 ≈ ₹85.4/USD.
- Real exchange rate (price competitiveness): If nominal rate = ₹83/USD, price level India = 100, price level US = 120, then Real rate = (83 × 100) / 120 ≈ 69.17 (interpretation: relative price of goods).
- Direct conversion (domestic per foreign): Domestic amount = Foreign amount × Exchange rate (e.g., ₹ = $ × ₹/USD).
- Indirect conversion (foreign per domestic): Foreign amount = Domestic amount × Exchange rate (when rate quoted as foreign per domestic).
- Percentage change (appreciation/depreciation): % change = (New rate − Old rate) / Old rate × 100. (Sign shows appreciation or depreciation depending on quotation convention.)
- Real exchange rate: RER = (Nominal exchange rate × Domestic price level) / Foreign price level.
- Absolute PPP: Nominal exchange rate = Domestic price level / Foreign price level (long run).
- Covered Interest Rate Parity (approx.): Forward rate F = S × (1 + id) / (1 + if), where S = spot rate, id = domestic interest rate, if = foreign interest rate.
Trade Documentation and Procedures
What is Trade Documentation and Why it Matters
Trade documentation comprises the set of papers required to move goods across borders, to get paid, to comply with customs and regulatory requirements, and to protect the rights of buyers, sellers and carriers. Proper documentation ensures legal clearance, reduces delays, guarantees payment (or remedies), and helps calculate duties and taxes.
Major Categories of Documents
- Commercial documents – Commercial Invoice, Proforma Invoice, Packing List, Sales Contract / Purchase Order.
- Transport documents – Bill of Lading (B/L) for sea shipments, Airway Bill (AWB) for air, Multimodal Transport Document (MMT).
- Payment and bank documents – Letter of Credit (L/C), Bill of Exchange (Draft), Documentary Collection papers, Bank Guarantee.
- Customs & regulatory documents – Export/Import Licences (where required), Shipping Bill (export), Bill of Entry (import), Customs declarations, Valuation documents.
- Certificates and permits – Certificate of Origin, Insurance Certificate, Phytosanitary Certificate, Inspection/Quality Certificate, Fumigation Certificate, Health Certificate.
- Special documents – Consular Invoice (where required), ATR/NAFTA/EU preferential certificates for reduced duties.
Typical Procedures (Step-by-step)
- Pre-shipment: Market enquiry → Negotiation & contract → Proforma invoice → Buyer arranges finance (e.g., L/C) or export credit → Production and quality checks → Packaging, marking and pre-shipment inspection (if required).
- Shipping & Documentation: Book carrier → Prepare documents (commercial invoice, packing list, certificate of origin, insurance, transport document) → Customs clearance for export (shipping bill) → Obtain transport document (B/L or AWB) → Goods loaded and shipped.
- Payment & Post-shipment: Present documents to bank under L/C or collection → Bank effects payment / buyer pays per agreed terms → Insurance claims if loss/damage → Import customs clearance on arrival (Bill of Entry), payment of duties and taxes → Inland delivery and after-sales obligations.
Key Practical Points
- Incoterms (EXW, FOB, CFR, CIF etc.) define responsibilities for cost, risk and who arranges transport/insurance and therefore determine which documents are needed and who obtains them.
- Accuracy is crucial: incorrect invoice values, mis-declared HS codes or missing certificates cause delays, fines or seizure.
- Payment methods (Advance, Open Account, Documentary Collection, Letter of Credit) determine bank documentation and risk allocation.
Example Flow (Export of Garments from India to UK)
- Seller issues Proforma Invoice → Buyer opens LC → Seller ships goods by sea → Seller obtains Bill of Lading, Commercial Invoice, Packing List, Certificate of Origin, Insurance Certificate → Seller submits documents to bank → Bank forwards documents to buyer's bank → Buyer pays and gets B/L to clear cargo in UK.
- Export example: An Indian exporter sells garments FOB Chennai at $10,000 to a UK buyer. Freight $500, insurance $50. Documents: Proforma invoice, Commercial invoice, Packing list, Certificate of Origin, Bill of Lading, Insurance Certificate, Letter of Credit. CIF price (for buyer’s import clearance calculation) = $10,550.
- Import example: An Indian importer purchases electronic components from China by air. Documents received: Commercial invoice, Airway Bill (AWB), Packing list, Manufacturer’s test certificate. Importer files Bill of Entry, pays customs duty and IGST, then gets cargo released from the airport warehouse.
- Banking example: Buyer and seller use a Letter of Credit. The exporter must present exactly compliant documents (invoice, B/L, insurance, certificate of origin) to the negotiating bank to receive payment. Minor discrepancies can delay or stop payment.
- Regulatory example: Exporting agricultural products to the EU requires a Phytosanitary Certificate and sometimes an Attestation of Residue Levels; lack of these documents can lead to rejection at the destination port.
- CIF = FOB + Freight + Insurance
- Total Landed Cost = CIF + Import Duty + Port Charges + Customs Clearance Fees + Inland Transport
- Customs Duty (INR or local currency) = Assessable Value × Duty Rate
- Assessable Value (for duty) often starts from CIF (for imports) and may be adjusted per local valuation rules
- Convert foreign currency: Domestic Amount = Foreign Amount × Exchange Rate (apply any bank charges or margins as needed)
Export Promotion Measures and Institutions
What are export promotion measures? Export promotion measures are policies, incentives and institutions set up by a government to increase the volume, value and competitiveness of a country’s exports. The aim is to diversify export basket, improve foreign exchange earnings, generate employment and integrate domestic producers into world markets.
Types of export promotion measures
- Fiscal measures: tax and duty-related incentives such as duty drawback, exemption/waiver of certain indirect taxes, reduced export duties, and targeted schemes that refund or compensate duties and taxes embedded in exports.
- Direct subsidy/ incentive schemes: schemes that give export incentives (cash or duty credit) to selected sectors or products to make them price-competitive in global markets (e.g., RoDTEP in India; earlier MEIS/DEPB in previous policies).
- Financial measures: export credit facilities, pre-shipment and post-shipment finance, favourable interest rates, and credit guarantee schemes to reduce payment risk for exporters.
- Infrastructure and institutional measures: creation of Special Economic Zones (SEZs), Export Processing Zones (EPZs), cold chains, port/airport improvements, courier networks, and quality testing labs.
- Marketing and non‑fiscal support: assistance for trade fairs, buyer-seller meets, market research, export promotion councils, and trade missions to help firms access foreign markets.
- Procedural/legal measures: simplification of documentation, single-window clearance, electronic filing, clear Foreign Trade Policy (FTP) rules, and streamlined customs procedures.
Key institutions involved (roles summarized)
- Directorate General of Foreign Trade (DGFT) – frames and implements the country’s Foreign Trade Policy, issues licences/authorisations (advance licences, EPCG etc.), administers export incentive schemes.
- Export Promotion Councils (EPCs) – sectoral bodies (e.g., Apparel EPC, Engineering EPC) that provide marketing support, trade intelligence, and liaison with government to address sector problems.
- APEDA / MPEDA / FIEO – specialised agencies: APEDA (agri & processed foods), MPEDA (marine products), FIEO (Federation of Indian Export Organisations) provide product-specific support, quality, and market development.
- Export Credit and Insurance – EXIM Bank (export finance, project support) and ECGC (Export Credit Guarantee Corporation) provide specialised finance and credit insurance to reduce commercial/political risk.
- Customs & Port Authorities – manage clearance, enforce regulations, and operate infrastructure that reduces clearance time and transaction costs.
- SEZ/EPZ Authorities – manage special zones with tax and procedural benefits to boost export-oriented manufacturing and services.
- Standards & Testing Bodies – BIS, laboratories and phytosanitary authorities (for agricultural exports) ensure exporters meet buyer and importing-country standards.
Typical export promotion instruments (examples)
- Advance Authorization / Duty-free import of inputs for export production.
- EPCG (Export Promotion Capital Goods) – allows import of capital goods at concessional duties for export production.
- Duty Drawback – refund of duties on imported inputs used in exports.
- RoDTEP – remission of certain duties and taxes on exported products to neutralize embedded taxes.
- Pre-shipment & post-shipment export credit and export factoring facilities.
- Credit guarantee and insurance cover (ECGC) against payment/default risks.
- SEZ/EPZ schemes offering tax holidays, relaxed labour rules, and simpler procedures.
How these measures help exporters
- Reduce cost of production by lowering taxes and duties on inputs.
- Improve access to working capital and reduce payment risk.
- Provide market intelligence, matchmaking and access to international buyers.
- Ensure product quality and compliance with foreign regulations to facilitate market entry.
- Reduce transaction time and paperwork, improving competitiveness.
Challenges and limits: incentives can be costly for governments, some schemes may cause trade disputes if seen as unfair subsidies, and benefits may be captured by few firms. Long-term competitiveness requires productivity gains, technology upgradation and diversification, not just incentives.
Class 12 relevance (simple framework for answers):
- Define export promotion measures.
- Classify measures (fiscal, financial, infrastructural, procedural, institutional).
- Mention key institutions and one role each (DGFT, EPCs, EXIM/ECGC, SEZ authorities, BIS/APEDA etc.).
- Give 1–2 real examples of schemes and zones.
- Conclude with a short comment on effectiveness and challenges.
- Special Economic Zones (SEZs) in India: SEEPZ (Mumbai) and Kandla SEZ encouraged export-oriented manufacturing by offering tax breaks, simplified procedures and built infrastructure, boosting jewellery, electronics and textile exports from those areas.
- APEDA (Agricultural & Processed Food Products Export Development Authority): supports exporters of fruits, vegetables and processed food by providing market intelligence, quality standards and assistance for trade fairs—helping India expand shipments of basmati rice, mango pulp, and spices.
- EPCG scheme (Export Promotion Capital Goods): an Indian exporter can import capital machinery at reduced duty provided they commit to specified export obligations, enabling modernization of production without heavy upfront tax burden.
- EXIM Bank and ECGC: EXIM Bank provides project/term finance for exporters; ECGC gives credit insurance protecting exporters from buyer default or political risk—e.g., an Indian engineering firm exporting to an African market uses ECGC cover to secure bank finance.
- Trade balance = Exports − Imports
- Export–Import ratio (percentage) = (Exports / Imports) × 100
- Share of commodity in total exports (%) = (Value of exports of commodity / Total exports) × 100
- \[Growth rate of exports (%) = [(Export_t − Export_{t−1}) / Export_{t−1}] × 100\]
- \[Revealed Comparative Advantage (RCA) = (X_{ij} / X_{it}) ÷ (X_{wj} / X_{wt}) where X_{ij} = country i’s exports of commodity j\]\[X_{it} = country i’s total exports\]\[X_{wj} and X_{wt} are world exports of commodity j and of total world exports respectively. (RCA > 1 indicates comparative advantage.)\]
Role of Multinational Corporations (MNCs) and TNCs
Definition: Multinational Corporations (MNCs) are firms that have production or service facilities in two or more countries but retain a clear home-country identity. Transnational Corporations (TNCs) are similar but have more integrated global operations with less identification with any single national home—decision-making and production are spread across countries.
Key differences (brief):
- MNCs: strong home-country base, centralized strategic control.
- TNCs: globally integrated operations, decentralized decision-making, operate as a single global firm.
Major roles in international trade and development
- Capital formation and FDI: MNCs/TNCs bring foreign direct investment (FDI) to host countries—funds for factories, infrastructure and technology. This increases productive capacity and contributes to GDP.
- Technology transfer and R&D: They introduce advanced production technologies, managerial practices and research capacities. Local firms and workers can learn through spillovers.
- Employment generation: Direct jobs in subsidiaries and indirect jobs through local suppliers, services and construction.
- Export promotion and market access: MNCs integrate host countries into global value chains (GVCs), increasing exports (component manufacturing, assembly, branded exports) and access to international markets.
- Economies of scale and efficiency: Large-scale production lowers average costs; global sourcing improves resource allocation.
- Product variety and consumer benefits: They introduce new products, quality standards and competitive prices.
- Infrastructure and institutional development: MNC-led projects often require improved transport, power and communications; sustained presence can strengthen local institutions and professional services.
- Linkages and skill development: Backward linkages to suppliers and forward linkages to distributors develop local firms; training programs raise human capital.
Negative impacts and challenges
- Profit repatriation: A significant share of profits may be sent back to the parent country, reducing net benefit to the host economy.
- Crowding out of local firms: Powerful MNCs can out-compete local enterprises, especially in capital-intensive and branded sectors.
- Tax avoidance and transfer pricing: Use of complex corporate arrangements can reduce tax revenues in host countries.
- Environmental and social costs: Resource extraction, pollution and weak local regulation can cause environmental damage and social disruption.
- Loss of policy autonomy: Large corporations can influence local policy to their advantage, limiting national policy space.
- Volatility and dependency: Sudden withdrawal or relocation of investment can cause job losses and balance-of-payments problems.
Role in development strategies (how governments respond): Governments try to maximise benefits by creating favourable FDI policies, performance requirements (local sourcing, export targets), joint ventures, incentives for technology transfer, and stronger regulation on environment and taxation.
Class 12 focus (summary): Understand both the contributions of MNCs/TNCs to capital, technology, employment and export growth and their potential drawbacks—profit repatriation, crowding out, environmental harm. Evaluate case-by-case, and recognise policy tools used by countries to attract FDI while protecting national interests.
- Apple (USA): Design and branding in the USA; assembly and component production largely in China and other Asian countries — example of global value chains.
- Toyota (Japan): Manufacturing plants and R&D centres across Asia, Europe and the Americas; regionalised production for local markets.
- Unilever (UK/Netherlands): Local brands and manufacturing across India, Africa and Latin America — adapts products to local tastes.
- Nestlé (Switzerland): Food processing factories worldwide; sources agricultural raw materials from many countries.
- Tata Group (India): Indian multinational with steel, automotive and IT operations worldwide — example of a home-grown MNC.
- Infosys/Wipro (India): IT services exported globally through subsidiaries and delivery centres — export-led FDI model.
- FDI share in GDP (%) = (FDI inflow / GDP) × 100 — shows relative importance of foreign investment.
- Export-Import Ratio (%) = (Value of Exports / Value of Imports) × 100 — indicates trade orientation and balance.
- Contribution of MNCs to GDP (%) = (Value added by MNC subsidiaries / GDP) × 100 — measures direct GDP impact.
- Employment share (%) = (Employment in MNC subsidiaries / Total employment) × 100 — measures labour market impact.
- Current Account Impact (simplified) = (Exports by MNC subsidiaries − Imports by subsidiaries) + (Net income repatriated) + (Net transfers) — shows effect on balance of payments (qualitative use).
Trade in Services
Trade in Services
Trade in services (often called invisible trade) is the international exchange of intangible products — activities or benefits that one country provides to residents of another. Unlike goods, services cannot be physically shipped; they are supplied by persons, companies or digital means and recorded in the balance of payments under the services account.
Main types of services traded
- Transport (sea, air, road freight and passenger services)
- Travel and tourism (expenditure by tourists abroad)
- Insurance and financial services (banking, insurance, investment management)
- Information Technology and Business Process Outsourcing (IT/BPO, software)
- Professional services (legal, accounting, consulting, architectural)
- Education and health services (international students, medical tourism)
- Royalties and licences (copyright, patents, trademarks)
- Other business services (research, advertising, engineering)
Key characteristics: intangibility, inseparability of production and consumption (often produced and consumed together), variability, perishability (cannot be stored), reliance on human capital and technology.
Why it matters: Services are an increasing share of world trade and a major source of foreign exchange earnings and employment for many countries (e.g., IT exports from India, tourism in Spain). Services can improve competitiveness of goods exports (logistics, finance, advertising) and play a major role in the balance of payments.
How services are supplied internationally (WTO/GATS modes)
- Mode 1 – Cross-border supply: service flows across the border (e.g., exported software downloaded online).
- Mode 2 – Consumption abroad: the consumer travels to the provider (e.g., tourism, students studying abroad).
- Mode 3 – Commercial presence: a foreign company establishes a subsidiary/branch (e.g., a bank opens a branch overseas).
- Mode 4 – Presence of natural persons: individuals travel to supply services (e.g., consultants, skilled contractors).
Measurement: Services trade is recorded as exports (services provided to non-residents) and imports (services purchased from non-residents) in a country’s balance of payments current account. Policy on services is influenced by trade agreements (WTO/GATS) and bilateral/regional treaties.
- India – IT and software services exports (TCS, Infosys, Wipro) earned large foreign exchange through cross-border provision of software and BPO.
- Spain and Thailand – Tourism accounts for a substantial part of service exports and national GDP; inbound tourists pay for accommodation, transport, food and entertainment.
- Suez Canal tolls – Egypt earns transport service revenue from ships using the canal.
- United Kingdom (London) and United States (New York) – major international financial services centres providing banking, insurance and asset management to non-residents.
- Australia/UK – international education: tuition and living expenditure by foreign students is recorded as service export.
- Net services = Services exports − Services imports
- Services export share (%) = (Services exports / Total exports) × 100
- Current account balance = (Goods balance) + (Services balance) + (Primary income) + (Secondary income)
- Export growth rate (%) = ((Exports in current year − Exports in previous year) / Exports in previous year) × 100
- CAGR of services exports = ((Final value / Initial value)^(1/number of years) − 1) × 100
Trends in India’s Foreign Trade
Overview: Trends in India’s foreign trade describe how the value, composition and direction of India's exports and imports have changed over time. Since economic liberalisation (1991) India’s trade has grown in value, become more diversified (especially towards services), and linked more closely with global markets.
Historical background
Before 1991, India followed a protectionist, import-substitution strategy with high tariffs and quantitative restrictions. The 1991 reforms liberalised trade, reduced tariffs, eased import controls and promoted exports. These policy shifts set the stage for long-term structural changes in trade.
Major trends
- Rapid growth in trade volume: Both merchandise and services exports and imports have expanded greatly after liberalisation, reflecting deeper integration with world markets.
- Rise of services exports: Information Technology (IT) and IT-enabled services (BPO) became a major export earners, increasing the share of services in total exports.
- Change in merchandise composition: From primarily agricultural/primary products to manufactured goods (engineering goods, pharmaceuticals, chemicals, textiles, gems & jewelry) and petroleum products.
- Concentration of imports: Energy imports (crude oil, petroleum products), gold, electronic components and capital goods form a large share of imports, making India sensitive to global commodity prices and exchange rate movements.
- Trade balance dynamics: India has often run a merchandise trade deficit because import bills (especially oil and gold) exceed export earnings; services exports help offset the deficit in the current account.
- Changing direction of trade: Traditional markets (Europe, USA) remain important while trade with Asia (China, ASEAN, West Asia) and African countries has grown; exports have diversified geographically.
- Policy and institutional influences: SEZs, export promotion measures, bilateral/ regional trade agreements and WTO rules have shaped trade patterns; ‘Make in India’ and export promotion aim to increase manufacturing exports.
Causes of these trends
- Liberalisation and reduced trade barriers post-1991.
- Technological change and global value chains enabling services and knowledge-intensive exports.
- Domestic policy incentives (SEZs, duty drawback, export incentives) and infrastructure improvements at ports and logistics.
- Rising domestic demand for energy and consumer goods leading to higher imports.
Implications and challenges
- Vulnerability to oil price shocks and exchange rate volatility because of heavy import dependence for energy and precious metals.
- Need to upgrade manufacturing competitiveness to reduce trade deficits and create jobs.
- Improving export diversification by product and market to reduce concentration risks.
- Addressing infrastructure bottlenecks, non-tariff barriers and ease-of-doing-business issues to boost exports.
Outlook
Prospects depend on policies to strengthen manufacturing, increase value addition, expand high-value services, and negotiate market access via trade agreements. Renewable energy adoption and reduced import dependence on fossil fuels could alter import composition over time.
- 1991 liberalisation: removal of many quantitative restrictions and reduction of tariffs led to sustained growth in exports and imports.
- IT and software services: Companies such as TCS, Infosys and Wipro helped India become a leading exporter of IT services, raising the share of services in export earnings.
- Gems & jewelry and textiles: Surat’s diamond cutting and textile clusters in Tamil Nadu and Gujarat are examples of manufacturing-led export hubs.
- Energy import dependence: India imports a large part of its crude oil needs, so spikes in global oil prices increase the import bill and widen the trade deficit.
- Direction change: Increasing trade with China, UAE and ASEAN countries alongside traditional partners like the USA and EU illustrates diversification of trade partners.
- \[Export growth rate (%) = [(Exports_t – Exports_{t-1}) / Exports_{t-1}] × 100\]
- Trade balance (net exports) = Exports – Imports (positive = surplus, negative = deficit)
- Trade openness ratio (%) = (Exports + Imports) / GDP × 100
- Export-import ratio (%) = (Exports / Imports) × 100
- Compound annual growth rate (CAGR) = [(Value_end / Value_start)^(1 / n) – 1] × 100, where n = number of years
- Share of commodity in exports (%) = (Value of commodity exports / Total exports) × 100
Problems, Challenges and Strategies
Overview
International trade brings growth opportunities but also creates problems and challenges for countries—especially developing ones. These arise from structural dependence on a narrow set of exports, price volatility of primary commodities, unequal access to markets, trade barriers, currency instability, and environmental and social costs. Effective strategies mix short-term policy tools and long-term structural reforms to increase resilience, add value, and broaden market access.
Major problems and challenges
- Export dependence and lack of diversification: Many countries rely on a few commodities (oil, minerals, agricultural products). A fall in global prices hits export earnings and employment.
- Terms of trade deterioration: Prices of primary exports can decline relative to manufactured imports, reducing real purchasing power.
- Trade deficits and balance of payments pressures: High imports (capital goods, fuel) relative to exports can force borrowing or currency depreciation.
- Volatility and external shocks: Global recessions, pandemics, wars, or sudden tariff changes disrupt supply chains and demand.
- Non-tariff barriers and market access: Sanitary/phytosanitary standards, quotas, complex rules of origin and technical standards can block small exporters.
- Currency fluctuations: Sudden depreciation raises import costs (fuel, capital goods) and inflation; appreciation hurts exporters’ competitiveness.
- Unequal gains and social impacts: Benefits of trade often concentrate in specific regions or skill-groups, increasing inequality and displacement of workers.
- Environmental and resource pressures: Export growth based on resource extraction or unsustainable agriculture causes deforestation, pollution and long-term degradation.
- Limited value addition and weak linkages: Exporting raw materials rather than processed goods keeps countries low in global value chains (GVCs).
- Institutional and infrastructural constraints: Poor ports, roads, customs inefficiency and weak credit/insurance systems raise trade costs and lower competitiveness.
Strategies to address problems
- Export diversification: Promote manufacturing and services (IT, tourism, logistics) to reduce dependence on a few commodities.
- Value addition: Invest in processing, branding and packaging to capture higher shares of final product prices.
- Trade facilitation: Simplify customs, adopt single-window systems, improve port efficiency and logistics to cut trade costs.
- Market access and trade agreements: Negotiate bilateral/regional trade pacts, reduce tariff barriers, and lobby for fairer rules in multilateral fora (WTO).
- Export promotion and finance: Provide export credit, insurance, subsidies for meeting standards, and support SMEs to enter export markets.
- Improve competitiveness: Invest in skills, R&D, technologies and infrastructure (power, transport, digital) to boost productivity.
- Macro-stability measures: Build foreign exchange reserves, prudent fiscal policy, and use hedging/instruments to manage currency and price risks.
- Sustainable trade policies: Enforce environmental standards, promote sustainable commodity certification and green value chains.
- Social safety nets and adjustment policies: Retraining programs, unemployment benefits and regional development to cushion displaced workers.
- Integration into GVCs: Attract investment into export-oriented manufacturing, improve local supplier linkages and meet global standards.
Policy instruments and implementation steps
- Identify priority sectors using comparative advantage and global demand analysis.
- Design targeted incentives (tax breaks, SEZs) combined with sunset clauses to avoid long-term subsidies.
- Strengthen institutions: trade promotion agencies, export credit agencies, quality standard bodies.
- Negotiate market access while protecting vulnerable sectors with adjustment measures.
- Monitor outcomes with indicators: export growth, trade/GDP ratio, terms of trade, employment in export sectors.
How strategies work together (example logic)
Improved port efficiency and reduced customs delays lower input costs for exporters → firms can invest in higher-value processing → exported products move up the value chain → earnings stabilize, employment rises and dependency on raw exports declines.
Summary
Addressing problems in international trade requires coordinated policies—diversification, value addition, market access, strong institutions, macroeconomic stability and sustainability—to manage short-term shocks and build long-term competitiveness.
- India’s oil import dependence: A rise in global crude prices (e.g., 2021–2022) increased India’s import bill, widened the current account deficit, and contributed to inflationary pressures. Strategy response: diversify energy sources, increase strategic petroleum reserves, and boost refining/exports of petroleum products.
- African commodity exporters (e.g., Nigeria, Zambia): Dependence on oil/copper led to severe revenue drops when prices fell. Strategies: promote value-added manufacturing, stabilize revenues via sovereign wealth funds and diversify exports to services and agriculture.
- US–China tariff war (2018–2020): Tariffs disrupted supply chains, raised costs for importers/exporters, and encouraged firms to re-shore or shift production to Southeast Asia. Strategy response: firms relocated to Vietnam and Mexico; countries negotiated alternative trade agreements (e.g., CPTPP interest, RCEP by others).
- COVID-19 supply chain disruption: Lockdowns disrupted global manufacturing and logistics, exposing dependence on single suppliers (e.g., PPE, semiconductors). Strategy response: countries pursued supply chain diversification, stockpiling critical goods, and incentives to localize strategic industries.
- China’s export-led growth and SEZs: Special Economic Zones (Shenzhen) attracted FDI, built export industries and integrated China into GVCs—an example of targeted policy transforming exports from primary to manufactured goods.
- EU’s Green Deal and trade: New environmental rules push exporters to meet sustainability standards, creating both barriers and opportunities for green technologies and certified commodities.
- Balance of Trade (BOT) = Value of Exports − Value of Imports
- Trade-to-GDP ratio = ((Exports + Imports) / GDP) × 100
- Terms of Trade (ToT) = (Index of Export Prices / Index of Import Prices) × 100
- \[Export Growth Rate (%) = ((Exports_t − Exports_{t−1}) / Exports_{t−1}) × 100\]
- Revealed Comparative Advantage (RCA) = (x_ij / X_it) / (X_wj / X_wt), where x_ij = country i's exports of product j; X_it = total exports of country i; X_wj = world exports of product j; X_wt = total world exports
Key Concepts
- International Trade
- Exchange of goods and services between residents of different countries.
- Export
- Goods or services produced domestically and sold to buyers in other countries.
- Import
- Goods or services bought from producers in other countries for domestic use or resale.
- Balance of Trade
- Difference between the value of visible exports and visible imports over a period.
- Balance of Payments (BOP)
- Systematic record of all economic transactions between residents of a country and the rest of the world during a period.
- Current Account
- Part of BOP recording trade in goods and services, primary income (like wages and investment income) and secondary income (transfers).
- Capital Account
- Part of BOP that records capital transfers and cross-border movements of capital such as investments and loans.
- Visible Trade
- International trade in tangible goods that can be seen and touched.
- Invisible Trade
- International trade in services, incomes (like dividends) and unilateral transfers, which are intangible.
- Trade Surplus
- When the value of a country's exports of goods exceeds its imports of goods.
- Trade Deficit
- When the value of a country's imports of goods exceeds its exports of goods.
- Tariff
- A tax imposed on imported goods to raise revenue or protect domestic industries.
- Import Quota
- A physical limit on the quantity of a commodity that can be imported over a specified period.
- Protectionism
- Policy of shielding domestic industries from foreign competition using tariffs, quotas or subsidies.
- Free Trade
- Trade policy where countries reduce or eliminate tariffs, quotas and other barriers to allow goods and services to move freely.
- World Trade Organization (WTO)
- International organization that sets global trade rules, facilitates negotiations and settles trade disputes among member countries.
- Preferential Trade Agreement (PTA)
- An agreement between countries to give preferential access to certain products by reducing tariffs for partner countries.
- Regional Trade Bloc
- Group of neighboring countries forming a pact to reduce trade barriers among themselves and increase economic integration.
- Exchange Rate
- The price of one country's currency expressed in terms of another country's currency.
- Foreign Direct Investment (FDI)
- Long-term investment by a foreign entity in productive assets or business operations in another country, typically involving control or significant influence.
End-of-Chapter Trial Paper & Test Questions
Topic-wise questions to test your understanding of every concept in this chapter.
-
Distinguish between visible and invisible trade with one example each. / दृश्य और अदृश्य व्यापार में अंतर बताइए तथा प्रत्येक का एक उदाहरण दीजिए।
Show answer
Visible (merchandise) trade is the exchange of tangible goods such as textiles or crude oil, while invisible trade is the exchange of services such as IT, tourism or insurance. / दृश्य (वस्तु) व्यापार मूर्त वस्तुओं जैसे वस्त्र या कच्चे तेल का विनिमय है, जबकि अदृश्य व्यापार सेवाओं जैसे आईटी, पर्यटन या बीमा का विनिमय है।
-
Define balance of trade and state when it is favourable. / व्यापार संतुलन को परिभाषित कीजिए और बताइए कब यह अनुकूल होता है।
Show answer
Balance of Trade = value of exports of goods minus value of imports of goods; it is favourable (surplus) when exports exceed imports. / व्यापार संतुलन = वस्तुओं के निर्यात का मूल्य घटा वस्तुओं के आयात का मूल्य; जब निर्यात आयात से अधिक हो तो यह अनुकूल (अधिशेष) होता है।
-
A country's export price index is 120 and import price index is 100. Calculate its terms of trade and interpret. / किसी देश का निर्यात मूल्य सूचकांक 120 और आयात मूल्य सूचकांक 100 है। इसका व्यापार-शर्त निकालिए और व्याख्या कीजिए।
Show answer
TOT = (120/100) × 100 = 120; since it exceeds 100, export prices rose relative to import prices, so terms of trade are favourable. / व्यापार-शर्त = (120/100) × 100 = 120; 100 से अधिक होने के कारण निर्यात मूल्य आयात मूल्य की तुलना में बढ़े हैं, अतः व्यापार-शर्त अनुकूल है।
-
Explain Ricardo's principle of comparative advantage as a basis of trade. / व्यापार के आधार के रूप में रिकार्डो के तुलनात्मक लाभ के सिद्धांत की व्याख्या कीजिए।
Show answer
Even if one country is less efficient in all goods, mutual gains arise if each specialises in the good with lower opportunity cost and trades for the rest. / यदि कोई देश सभी वस्तुओं में कम कुशल भी हो, तब भी पारस्परिक लाभ होता है यदि प्रत्येक देश कम अवसर लागत वाली वस्तु में विशेषज्ञता प्राप्त करे और शेष का व्यापार करे।
-
Differentiate between tariff and non-tariff barriers with one example each. / प्रशुल्क और गैर-प्रशुल्क बाधाओं में अंतर कीजिए तथा प्रत्येक का एक उदाहरण दीजiए।
Show answer
A tariff is a direct tax on imports (e.g., customs duty), whereas non-tariff barriers restrict trade indirectly through measures like quotas, technical standards or licensing. / प्रशुल्क आयात पर प्रत्यक्ष कर है (जैसे सीमा शुल्क), जबकि गैर-प्रशुल्क बाधाएँ कोटा, तकनीकी मानक या लाइसेंस जैसे उपायों से अप्रत्यक्ष रूप से व्यापार को प्रतिबंधित करती हैं।
-
What is entrepôt trade? Give an example. / पुनर्निर्यात (एंट्रिपो) व्यापार क्या है? एक उदाहरण दीजिए।
Show answer
Entrepôt trade is where a port or city acts as a hub to store, sort and re-ship imported goods to other countries, e.g., Singapore or Dubai. / एंट्रिपो व्यापार वह है जहाँ कोई बंदरगाह या नगर आयातित वस्तुओं को संग्रहित, छाँट कर अन्य देशों को पुनः भेजने वाले केंद्र के रूप में कार्य करता है, जैसे सिंगापुर या दुबई।
-
State two principles of the WTO that limit protectionism. / डब्ल्यूटीओ के दो सिद्धांत बताइए जो संरक्षणवाद को सीमित करते हैं।
Show answer
Most-Favoured-Nation (equal treatment among members) and National Treatment (imported and domestic goods treated equally after import). / सर्वाधिक अनुकूल राष्ट्र (सदस्यों के बीच समान व्यवहार) तथा राष्ट्रीय व्यवहार (आयात के बाद आयातित और घरेलू वस्तुओं के साथ समान व्यवहार)।
-
How has the composition of India's exports changed since independence? / स्वतंत्रता के बाद भारत के निर्यातों की संरचना में किस प्रकार परिवर्तन आया है?
Show answer
India's trade has shifted from primary commodities towards manufactured goods and services, notably IT and software exports. / भारत का व्यापार प्राथमिक वस्तुओं से हटकर विनिर्मित वस्तुओं और सेवाओं की ओर, विशेषकर आईटी और सॉफ्टवेयर निर्यात की ओर स्थानांतरित हुआ है।
Related Laws & Principles
Explore allFoundational laws & principles behind this chapter. Each one opens a full page — what it says, why it matters, five practice questions and the mistakes to avoid.