Overview
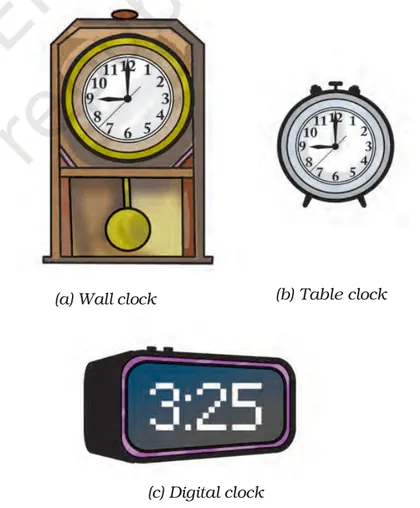
Introduction: Motion and Time (Science – VII) introduces how and why objects move, how to measure motion, and how time is used to describe movement. The chapter explains basic types of motion (uniform and non-uniform), the ideas of distance and time, and how speed quantifies motion. Simple experiments and distance–time graphs help students visualise and analyse motion. Importance: Understanding motion and time is fundamental to everyday life (walking, cycling, travel, sports) and to many scientific and technological applications (transport, engineering, physics). The chapter builds measurement skills, encourages careful observation and data recording, and introduces graphical interpretation — all essential skills for higher classes. Key themes: - Distinguishing between motion and rest; observing motion relative to a reference point. - Measuring distance and time using appropriate units and instruments (metre rule, measuring tape, stopwatch/clock). - Types of motion: uniform (equal distances in equal intervals) and non-uniform. - Speed as a rate: formula, units, average speed, and simple calculations. - Distance–time graphs: plotting experimental data, reading graphs, and using…
Learning Objectives
- Define motion and rest with reference to a chosen frame of reference and give examples.
- Explain uniform and non-uniform motion with everyday examples.
- Distinguish between distance and displacement and illustrate with suitable examples.
- Define speed and state its SI unit.
- Calculate average speed using s = d/t for numerical problems.
- Determine distance or time using d = s × t in problem-solving questions.
- Convert speed between km/h and m/s accurately.
- Plot distance–time graphs for uniform and non-uniform motion from given data.
Topics in this chapter
10 topics · tap a topic title to jump straight to it.
Motion — Introduction
What is motion? Motion is the change in the position of an object with respect to a chosen reference point (frame of reference) over time. If an object's position changes when observed from a particular reference frame, the object is said to be in motion relative to that frame.
Frame of reference: To describe motion you must specify a reference point or coordinate system (for example, a road sign, the ground, or the classroom floor). Motion is always described relative to that frame.
Types of motion (basic):
- Translatory (linear) motion: All parts of the object move the same distance in the same direction (e.g., a car moving on a straight road).
- Rotational motion: The object spins about an axis (e.g., a wheel or a ceiling fan).
- Oscillatory motion: Back-and-forth motion about a mean position (e.g., a pendulum, a child on a swing).
Uniform and non-uniform motion: Uniform motion means an object covers equal distances in equal intervals of time (constant speed). Non-uniform motion means the distance covered in equal time intervals is not the same (speed changes).
Distance and displacement: Distance is the total path length covered and is a scalar (only magnitude). Displacement is the change in position from initial to final point, measured along a straight line, and is a vector (has magnitude and direction). Example: If you walk 3 m east and then 4 m west, the distance = 7 m, the displacement = 1 m west (vector).
Speed and velocity: Speed is the rate of change of distance (scalar). Velocity is the rate of change of displacement (vector). For an introductory class we often use average speed/average velocity over a time interval.
Units: The SI unit of distance is metre (m). Common time units are second (s), minute (min) and hour (h). Speed units: m/s, km/h. (Conversion: 1 km = 1000 m, 1 h = 3600 s → to convert km/h to m/s multiply by 5/18.)
- A person walking along a straight road: if their position relative to a lamppost changes, they are in motion (linear motion).
- A car moving at constant speed on a straight highway demonstrates uniform motion.
- A bus slowing down to stop at a bus stop is in non-uniform motion (speed changes).
- A pendulum swinging to and fro exhibits oscillatory motion.
- The Earth revolving around the Sun is an example of rotational/orbital motion (on a much larger scale).
- Speed (average) = Total distance travelled / Total time taken (s = d / t).
- Average velocity = Displacement / Time taken (v_avg = Δx / t).
- If motion is uniform: speed = distance / time (constant).
- Unit conversions: 1 km = 1000 m; 1 h = 3600 s; to convert km/h to m/s multiply by 5/18.
Types of Motion
Overview: Motion describes change in the position of an object with time. Types of motion are classified by the path followed, by how speed changes, and by whether the motion repeats.
1. By the path followed (Nature of motion)
- Translatory (Translational) motion: Every point of the body moves the same distance in the same time. Two common subtypes:
- Rectilinear (straight line) motion: Path is a straight line (e.g., a car on a straight road).
- Curvilinear motion: Path is a curve; special case: circular motion where path is a circle (e.g., a stone tied to a string whirled around).
- Rotational motion: Object spins about an internal axis and different points move in circles about the axis (e.g., a rotating wheel, a spinning top).
- Oscillatory (vibratory) motion: Object moves to-and-fro about a mean position. If it repeats at regular intervals it is periodic (e.g., pendulum, a vibrating guitar string).
2. By how speed changes
- Uniform motion: Object covers equal distances in equal intervals of time (speed constant).
- Non-uniform motion: Speed changes with time (acceleration or deceleration).
3. Periodic vs Non-periodic
- Periodic motion: Motion that repeats after equal time intervals (e.g., Earth around the Sun, pendulum swings).
- Non-periodic motion: Motion that does not repeat regularly (e.g., movement of a person walking along different routes).
How to identify types in examples: Look at the path (straight or curved), check if every part of the object moves equally (translatory) or about an axis (rotational), see if motion repeats (oscillatory/periodic). To tell uniform vs non-uniform, check whether equal time intervals show equal distances.
Important idea: An object can exhibit more than one type simultaneously. Example: A rolling wheel has rotational motion about its centre and translational motion of its centre along the road.
- Car moving on a straight highway — rectilinear translatory motion (can be uniform or non-uniform).
- Wheel of a bicycle — rotational motion (every point on rim moves in a circle).
- Earth revolving around the Sun — nearly circular (orbital) periodic motion.
- Pendulum of a clock — oscillatory and periodic motion.
- A child on a swing — oscillatory motion (to-and-fro), often non-uniform within each swing.
- A running person changing speed — non-uniform motion.
- Speed (uniform) = distance / time => v = s / t
- Average speed (non-uniform) = total distance / total time => v_avg = total s / total t
- Angular speed (for circular motion) = angle turned / time => ω = θ / t (θ in radians)
- Relation between linear and angular speed => v = r * ω (r = radius)
- Speed in circular motion using period T => v = 2πr / T
- Frequency and period relation => f = 1 / T (f = number of cycles per unit time)
Measurement of Time
What is time?
Time is a measurable quantity used to sequence events, compare durations and quantify rates of change (for example, speed = distance/time). To measure time we use periodic or regularly repeating events (like the swing of a pendulum, vibration of atoms or the oscillation of a quartz crystal).
Units of time
The SI unit of time is the second (s). Common larger units are minute (1 min = 60 s), hour (1 h = 60 min = 3600 s), day (24 h), and year (~365 days). For very small intervals millisecond (ms = 10^-3 s), microsecond (µs = 10^-6 s) etc. are used.
Devices for measuring time
- Clocks and watches (analog and digital) — use gears, quartz oscillators or atomic standards for accurate timekeeping.
- Stopwatch — used to measure short durations in experiments and sports (start/stop timing).
- Pendulum clocks — use periodic motion of a pendulum (historically important; Huygens developed the pendulum clock).
- Sundials, water clocks — ancient methods, less accurate.
- Atomic clocks — most accurate; SI second is defined by the radiation periods of cesium-133 atoms.
How measurement is done in practice
We record the start and end times of an event and take the difference to get the duration. For very short events we use devices (stopwatch or electronic timers). For periodic events, measure the time for many cycles and divide to reduce random error (e.g., time for 20 swings of a pendulum divided by 20 gives average period).
Accuracy and errors
Human reaction time causes error when using manual start/stop. To reduce error: repeat measurements, take average, use electronic timing for high precision. For periodic measurements, timing many cycles reduces fractional error.
SI definition of second (brief)
One second is defined as the duration of 9,192,631,770 periods of radiation corresponding to the transition between two hyperfine levels of the ground state of the cesium-133 atom. This definition allows extremely precise and stable clocks.
Connection to motion
Time measurement is essential to describe motion. If you measure how far an object moves in a measured time, you can calculate speed and study uniform or non-uniform motion.
- Measuring how long it takes a ball to roll 2 m using a stopwatch. Time recorded and divided by distance gives average speed.
- Timing 50 swings of a simple pendulum and dividing the total time by 50 to find the period of one swing (reduces measurement error).
- Converting 2 hours 30 minutes into seconds: 2 h = 7200 s, 30 min = 1800 s, total = 9000 s.
- Using a digital clock to schedule daily activities (school start time, travel time).
- Measuring reaction time by noting the time between a signal and a student's response using a stopwatch; repeating several times and averaging.
- Comparing a quartz watch (accurate to seconds per month) with an atomic clock (accurate to billionths of a second per day) to understand different precisions.
- 1 min = 60 s, 1 h = 60 min = 3600 s, 1 day = 24 h
- Speed (average) = Distance / Time (v = d / t)
- Time = Distance / Speed (t = d / v)
- Period and frequency relation: Period T = 1 / Frequency f (T = 1/f)
- For a simple pendulum (useful to relate length to period): T = 2π √(L/g) where L is length, g is acceleration due to gravity
Speed — Concept and Definition
What is speed?
Speed of an object tells us how fast it is moving. It is the distance covered by the object per unit time. In simple words, speed = how much distance is covered in how much time.
Definition: Speed is a scalar quantity that gives the rate of change of distance with time. It does not include direction (only magnitude).
Types of speed/motion:
- Uniform speed (or uniform motion): When an object covers equal distances in equal intervals of time. On a distance–time graph it is shown by a straight line.
- Non‑uniform speed (or non‑uniform motion): When distances covered in equal time intervals are not the same. On a distance–time graph it is a curved line.
Average speed and instantaneous speed:
- Average speed = (Total distance traveled) / (Total time taken). Useful when speed changes during the trip.
- Instantaneous speed is the speed of an object at a particular instant of time (what a speedometer shows). For beginners it can be thought of as the speed measured over a very small time interval.
Units: SI unit of speed is metre per second (m/s). Kilometre per hour (km/h) is also commonly used.
How to use speed: If you know any two of the three quantities (distance, speed, time) you can find the third using the relation: distance = speed × time.
Important idea for graphs: On a distance–time graph, the slope (steepness) of the line gives the speed. Steeper straight line = higher constant speed. On a speed–time graph, constant speed is a horizontal line; changing speed is shown by a rising or falling line.
- A student walks 600 metres in 5 minutes. Average speed = 600 m / (5 × 60 s) = 600 / 300 = 2 m/s.
- A car travels 90 km in 2 hours. Average speed = 90 ÷ 2 = 45 km/h. To convert to m/s: 45 × (5/18) = 12.5 m/s.
- A bicyclist rides at a constant speed of 10 km/h on a straight road — this is uniform motion (distance–time graph: straight line).
- A bus stops and starts due to traffic — its motion is non‑uniform (distance–time graph: curve or broken slope).
- If a jogger’s speedometer shows 5 m/s at a moment, that is the jogger’s instantaneous speed at that instant.
- Speed = Distance / Time (s = d / t)
- Average speed = Total distance covered / Total time taken
- Distance = Speed × Time (d = s × t)
- Unit conversion: 1 km/h = 5/18 m/s, so multiply km/h by 5/18 to get m/s
- Unit conversion: 1 m/s = 3.6 km/h, so multiply m/s by 3.6 to get km/h
Average Speed
What is average speed?
The average speed of a moving object is the total distance it travels divided by the total time taken for the journey. It gives one single value that describes the overall rate of motion for the whole trip, even if the object moved at different speeds at different times.
Definition (simple): Average speed = (Total distance travelled) / (Total time taken). Its SI unit is metres per second (m/s); common units in daily life are kilometres per hour (km/h).
Important points:
- Average speed depends on the entire trip (including stops). If the object stops for some time, the average speed decreases because the total time increases while the distance does not.
- Average speed is different from the arithmetic mean of speeds unless special conditions hold. You must use total distance and total time.
- Average speed is the slope of the straight line that joins the initial and final points on a distance–time graph (the secant line). On a speed–time graph, average speed = (area under the speed–time curve) / (total time).
When does average = simple mean?
If the object spends equal amounts of time at two (or more) speeds, the average speed is the arithmetic mean of those speeds. If the object covers equal distances at two speeds, the average speed is the harmonic mean: v_avg = 2*v1*v2/(v1+v2) for two speeds v1 and v2.
- Example 1 (basic): A car travels 60 km in 2 hours and then 40 km in 1 hour. Total distance = 60 + 40 = 100 km. Total time = 2 + 1 = 3 h. Average speed = 100 / 3 = 33.33 km/h.
- Example 2 (effect of stop): A bus covers 90 km in a trip that took 1.5 hours including a 30-minute (0.5 h) stop. Total distance = 90 km. Total time = 1.5 h. Average speed = 90 / 1.5 = 60 km/h. (Note: moving speed during motion was 90 / 1.0 = 90 km/h, but average including the stop is 60 km/h.)
- Example 3 (equal distances, show difference from mean): A cyclist goes 10 km at 10 km/h (1.0 h) and then 10 km at 20 km/h (0.5 h). Total distance = 20 km. Total time = 1.5 h. Average speed = 20 / 1.5 = 13.33 km/h. Arithmetic mean of speeds would be (10 + 20)/2 = 15 km/h (which is WRONG here).
- Example 4 (equal times): A car travels for 2 h at 40 km/h and 2 h at 60 km/h. Average speed = (total distance)/(total time) = (40*2 + 60*2) / (2+2) = (80 + 120)/4 = 200/4 = 50 km/h. Here average = arithmetic mean (40+60)/2 = 50 km/h because times are equal.
- Average speed = Total distance / Total time. (v_avg = d_total / t_total)
- Units: metres per second (m/s) or kilometres per hour (km/h). To convert: 1 m/s = 3.6 km/h.
- If two equal distances are travelled at speeds v1 and v2: v_avg = 2 * v1 * v2 / (v1 + v2) (harmonic mean).
- If speeds v1 and v2 are each maintained for the same time: v_avg = (v1 + v2) / 2 (arithmetic mean).
- On a distance–time graph: v_avg = slope of the straight line joining initial and final points (secant line).
- On a speed–time graph: distance = area under the curve; v_avg = (area under speed–time curve) / (total time).
Instantaneous Speed and Speedometers
Instantaneous speed is the speed of an object at a particular instant of time. It tells us how fast something is moving right now (for example, the speed shown by a car's speedometer at this moment).
Difference from average speed: Average speed = (total distance) / (total time) and gives an overall value for a journey. Instantaneous speed may be higher or lower than the average at different moments during the journey.
Concept (simple): If a body moves from position s(t) at time t to s(t+Δt) at time t+Δt, the average speed over that short interval is Δs/Δt. Instantaneous speed is what you get if you make Δt very, very small — the speed at that exact moment. In school-level terms, you can think of it as the speed measured over a very small time interval around the instant.
How a speedometer works (basic idea):
- Mechanical speedometer: the spinning of the vehicle's wheels (or gearbox) turns a flexible cable that rotates a dial. The dial position gives the current speed.
- Electronic speedometer: sensors (hall-effect sensors or wheel sensors) count wheel rotations or pulses. The vehicle’s control unit converts the pulse rate into speed and displays it digitally.
- GPS-based speed: uses change in GPS position over short time intervals to estimate instantaneous speed.
Units: Common units are metres per second (m/s) and kilometres per hour (km/h). Many car speedometers display speed in km/h. To convert: 1 m/s = 3.6 km/h.
Practical notes:
- Speedometers indicate approximate instantaneous speed — they update continuously and can lag slightly or show small errors due to calibration, tyre size, or sensor delays.
- Drivers use the speedometer to maintain safe and legal speeds because it shows the vehicle’s current speed rather than the average for the trip.
- A car accelerating from a traffic light: its instant speed at 6.5 seconds after starting is the reading on the speedometer at that moment.
- A cyclist pedalling up a hill slows down — the instantaneous speed at the top is lower than just before the hill.
- A runner completes a 100 m race in 12 s: average speed = 100/12 ≈ 8.33 m/s, but their instantaneous speed at the finish may be higher if they sprinted at the end.
- A bus that stops at bus stops has low instantaneous speed (zero) at stops but a higher average speed between stops.
- A train's speedometer shows its current speed which the driver watches during approach to stations or speed-restricted sections.
- A GPS on a phone shows the current speed while you bike; it updates every second or so to show the instantaneous speed estimate.
- Average speed = total distance / total time (v_avg = s_total / t_total)
- Instantaneous speed ≈ Δs / Δt for very small Δt (conceptual; becomes exact as Δt → 0)
- Unit conversion: 1 m/s = 3.6 km/h (so multiply m/s by 3.6 to get km/h, divide km/h by 3.6 to get m/s)
Distance–Time Graphs
What is a distance–time graph?
A distance–time graph (d–t graph) is a visual way to show how the distance of a moving object from a fixed point changes with time. Time is plotted on the horizontal axis (x-axis) and distance on the vertical axis (y-axis).
How to read the graph
- Slope (steepness) of the line: The slope represents speed. A steeper line means a larger speed (object is moving faster).
- Straight line with constant slope: Represents uniform motion (constant speed). The speed = change in distance / change in time (rise/run).
- Horizontal line: Distance does not change with time → object is stationary (speed = 0).
- Curved line: Slope changes with time → speed is changing (non-uniform motion or acceleration). The instantaneous speed at any instant is the slope of the tangent to the curve at that point.
- Intercepts: The point where the line meets the vertical axis gives the initial distance at time zero.
Steps to draw a d–t graph
- Choose suitable scales for time (x-axis) and distance (y-axis) so the plotted points fit neatly.
- Label axes and units (for example, time in s or h, distance in m or km).
- Plot the (time, distance) data points.
- Join points with straight lines for uniform motion segments or with a smooth curve if motion is non-uniform.
Important notes
- Distance is always non-negative. If using displacement instead, values can be negative (but that is treated in later classes).
- Area under a distance–time graph does not have a direct physical meaning; do not confuse with velocity–time graphs where area represents displacement.
- A student walks away from school. At 0 min she is 0 m from school, at 5 min she is 400 m, and at 10 min she is 800 m. Plotting these points gives a straight line through the origin — constant speed (uniform motion).
- A car travels on a road: for the first 2 minutes it moves 200 m (steady speed), then it stops for 1 minute (distance stays the same), then it moves again with a different speed. The distance–time graph will show a sloped line, a horizontal segment, then another sloped line (piecewise graph).
- A runner accelerates at the start of a race: the d–t graph is a curve that becomes steeper with time, showing that distance increases faster as speed increases.
- A bus route where the bus waits at a stop: the graph has flat (horizontal) portions when parked and sloped portions while moving.
- Speed = distance / time (v = d / t). Example units: m/s, km/h.
- Average speed = total distance travelled / total time taken.
- Slope of d–t graph = (change in distance) / (change in time) = Δd / Δt = speed.
- Instantaneous speed at a point on a curved d–t graph = slope of the tangent at that point.
- Conversion between km/h and m/s: 1 km/h = 5/18 m/s (multiply km/h by 5/18 to get m/s).
Practical Activities and Measurements
What this topic covers
"Practical Activities and Measurements" in the chapter Motion and Time teaches how to measure how far and how long something moves, calculate its speed, record observations, and draw and interpret simple graphs (distance–time and speed–time). The focus is on correct use of measuring instruments, arranging simple experiments, reducing errors, and presenting results clearly.
Key concepts
- Distance — how much ground an object covers. SI unit: metre (m). Measured with a metre scale, measuring tape, or ruler.
- Time — duration of motion. SI unit: second (s). Measured with a stopwatch, clock, or a digital timer (smartphone timer is acceptable for school experiments).
- Speed — how fast an object is moving. For uniform motion: speed = distance ÷ time. Units: m/s or km/h.
- Average speed — total distance travelled divided by total time taken, useful when speed is not constant.
- Graphs — distance–time graphs show how distance changes with time; slope of a distance–time graph gives speed. Speed–time graphs show how speed varies with time; area under a speed–time graph equals distance travelled.
Typical classroom practicals
- Measure a fixed distance (e.g., 10 m), make a toy car or a student walk/run that distance several times while timing with a stopwatch. Note time for each trial, calculate speed, and take average.
- Roll a toy car at (approximately) constant speed along a track and record distance travelled at regular time intervals (e.g., every 1 s). Use the data to plot a distance–time graph.
- Use a metronome or phone to create equal time intervals and measure how far a bicycle or tricycle moves in each interval to test uniformity of motion.
How to perform a simple experiment (step-by-step)
- Decide the motion to study and choose suitable distance (long enough to reduce relative error) and timing method.
- Measure and mark the start and end points using tape or chalk. Record the exact distance in metres.
- Use a stopwatch: one student starts the watch at the start and stops at the finish. Repeat the trial 3–5 times.
- Record each time in a table, calculate speed = distance/time for each trial, and compute the average speed.
- Plot distance (y-axis) versus time (x-axis) using the recorded data points and draw the best-fit line.
- If the points lie on a straight line through the origin, the motion is uniform.
- The slope (rise/run) gives the speed: slope = Δdistance/Δtime.
Sources of experimental error and how to reduce them
- Reaction time of the person operating the stopwatch — reduce by using electronic timers or photo gates; repeat trials and take average.
- Parallax error when reading scales — view scale straight-on.
- Instrument least count (resolution) — use a finer scale or measure a longer distance so the error is a smaller fraction.
- Non-uniform starting or stopping — ensure consistent starting method (e.g., releasing car without push) and clear marking of finish line.
Presentation of results
- Always include units (m, s, m/s, km/h) in tables and calculations.
- Label graph axes with variable and unit (e.g., Time (s) on x-axis, Distance (m) on y-axis).
- Use an appropriate scale so plotted points occupy most of the graph area and draw a smooth best-fit line or curve.
- Walking speed: Measure a 20 m straight path, time a student walking at a steady pace for that distance 3 times, calculate speed for each trial and average them.
- Toy car on track: Measure distances at 1 s intervals while a toy car rolls with approximately constant speed. Plot distance vs time — a straight line shows uniform motion.
- Bicycle ride: Use an odometer (or measure distance) and a stopwatch to find average speed for a short trip: average speed = total distance/total time.
- Reaction time experiment: One student drops a ruler and another catches it; measure distance fallen to estimate reaction time using s = (1/2)gt^2 (advanced idea) — shows importance of reaction-time errors.
- Train timetable check: Record departure and arrival times and distances between stations to calculate average speed between stations and compare with listed speeds.
- Speed = Distance ÷ Time (v = d / t)
- Average speed = Total distance ÷ Total time
- Distance = Speed × Time (d = v × t)
- Time = Distance ÷ Speed (t = d / v)
- Conversion: 1 km/h = 5/18 m/s (multiply km/h by 5/18 to get m/s; multiply m/s by 18/5 to get km/h)
Problem Solving — Numerical Problems
What this topic covers
Numerical problems in Motion and Time teach how to use the relation between distance, speed (or velocity) and time to solve questions. Problems also test unit conversions, average speed, and reading or drawing distance–time graphs.
Key ideas and a step-by-step approach
- Read the problem carefully: Identify what is given (distance, time, speed) and what is asked.
- Write symbols and units: Use d for distance, v (or s) for speed, t for time. Keep units consistent (metre/second or km/hour).
- Convert units if needed: 1 km = 1000 m, 1 h = 3600 s. To convert: km/h ÷ 3.6 = m/s; m/s × 3.6 = km/h.
- Use the correct formula: v = d/t, d = v × t, t = d/v. For average speed: total distance / total time.
- Calculate and check: Do the arithmetic, check units and whether the answer is reasonable (e.g., speeds should be positive and within expected range).
Types of problems you will meet
- Find speed when distance and time are given.
- Find distance or time when speed and one other quantity are given.
- Convert speeds between units (m/s and km/h).
- Calculate average speed for journeys with different segments (equal time or equal distance cases).
- Interpret distance–time graphs: slope = speed, flat line = rest, steeper slope = higher speed.
Tips for graphs: On a distance–time graph put time on x-axis and distance on y-axis. The slope (rise/run) gives speed. For uniform motion you get a straight line; for non-uniform motion the curve’s slope changes.
- 1) Simple speed calculation — A car travels 150 km in 3 hours. Find its speed. Solution: v = d/t = 150 km ÷ 3 h = 50 km/h.
- 2) Units conversion and two forms — A cyclist covers 500 m in 2 minutes. Find the speed in m/s and in km/h. Solution: t = 2 min = 120 s. v = d/t = 500 m ÷ 120 s = 4.1667 m/s. In km/h: 4.1667×3.6 = 15.0 km/h.
- 3) Average speed for equal distances — A car goes from A to B (60 km) at 30 km/h and returns B to A (60 km) at 60 km/h. What is the average speed for the round trip? Solution: total distance = 120 km. Time for first = 60/30 = 2 h, time for return = 60/60 = 1 h, total time = 3 h. Average speed = total distance / total time = 120 ÷ 3 = 40 km/h. (For equal distances, a shortcut: v_avg = 2v1v2/(v1+v2) = 2×30×60/(30+60) = 40 km/h.)
- 4) Distance–time graph interpretation — A distance–time graph shows: 0–2 h: horizontal at 0 km (rest). 2–5 h: straight line from 0 to 90 km. 5–7 h: horizontal at 90 km (rest). Questions: (a) What is the speed while moving? (b) When was the object at rest? Solution: (a) During 2–5 h, speed = rise/run = 90 km ÷ 3 h = 30 km/h. (b) Rest from 0–2 h and 5–7 h (flat line segments).
- Speed: v = d / t (where v = speed, d = distance, t = time).
- Distance: d = v × t.
- Time: t = d / v.
- Average speed (general): v_avg = total distance / total time.
- Conversion: 1 m/s = 3.6 km/h. So km/h to m/s: ÷ 3.6. m/s to km/h: × 3.6.
- Average speed for equal distances at two speeds v1 and v2: v_avg = 2·v1·v2 / (v1 + v2).
Summary and Key Definitions
Summary
Motion is the change in position of an object with respect to a reference point with time. Whether an object is said to be in motion depends on the chosen reference point; if the position changes relative to that point, the object is moving, otherwise it is at rest.
Types of motion
- Uniform motion: the object covers equal distances in equal intervals of time (speed is constant).
- Non-uniform motion: the object covers unequal distances in equal intervals of time (speed changes).
Time and its measurement
Time is measured using clocks and stopwatches. The SI unit of time is the second (s). Other common units are minute (min) and hour (h). Accurate timing is essential for measuring speed.
Distance and displacement
Distance is the total path length travelled (scalar). Displacement is the straight-line change in position from initial to final point (vector). In Class 7 emphasis is usually on distance.
Speed
Speed is how fast an object moves. It is a scalar quantity defined as distance travelled per unit time. Average speed = total distance / total time. The SI unit of speed is m/s; km/h is also commonly used.
Periodic motion and time period
Periodic motion repeats itself at regular intervals (e.g., a swinging pendulum, hands of a clock). The time taken to complete one full cycle is called the time period (T).
Distance–time graphs
A distance–time graph plots distance (y-axis) against time (x-axis). The slope of a distance–time graph gives the speed. A straight line with constant slope = uniform motion; a curved line = changing speed; a horizontal line = object at rest.
Important ideas to remember
- Motion is relative: depends on the reference point.
- Speed is a scalar; it does not include direction.
- For uniform motion the distance–time graph is a straight line; the steeper the line, the greater the speed.
- Convert units before using formulas (e.g., km/h to m/s, hours to seconds).
- A car travels 120 km in 2 hours. Its average speed = 120 km ÷ 2 h = 60 km/h (uniform if speed remains constant).
- A person walking to school covers 1000 m in 10 minutes. Convert 10 min to 600 s, speed = 1000 m ÷ 600 s ≈ 1.67 m/s.
- A pendulum swinging to-and-fro repeats its motion. If it completes 20 swings in 40 s, time period T = 40 s ÷ 20 = 2 s per swing (periodic motion).
- A bus starts from a stop and accelerates, then slows down at traffic signals. Its distance–time graph is curved when accelerating and flattens (horizontal) when stopped.
- Hands of a clock show uniform circular motion; the minute hand covers equal angles in equal time intervals (uniform periodic motion).
- Speed (average) = distance / time — v = d / t
- Distance = speed × time — d = v × t
- Time = distance / speed — t = d / v
- Unit conversions: 1 km = 1000 m; 1 h = 3600 s
- Convert km/h to m/s: multiply by 5/18 (1 km/h = 5/18 m/s); m/s to km/h: multiply by 18/5
- Time period (periodic motion) T = total time / number of cycles
Key Concepts
- Motion
- Change in the position of an object with respect to a reference point over time.
- Rest
- State of an object when its position does not change with respect to a reference point.
- Reference point
- A fixed point used to describe the position or motion of an object.
- Path length
- Total distance actually covered by a moving object along its path; a scalar quantity.
- Distance
- Total length of the path travelled by an object, irrespective of direction.
- Displacement
- Shortest straight-line distance and direction from the initial to the final position of an object; a vector.
- Scalar quantity
- A physical quantity described by magnitude only (no direction).
- Vector quantity
- A physical quantity described by both magnitude and direction.
- Speed
- Distance travelled by an object per unit time; scalar. Common unit: m/s or km/h.
- Uniform motion
- Motion in which an object covers equal distances in equal intervals of time.
- Non-uniform motion
- Motion in which an object covers unequal distances in equal intervals of time.
- Average speed
- Total distance travelled divided by total time taken.
- Instantaneous speed
- Speed of an object at a particular instant of time.
- Velocity
- Displacement of an object per unit time; a vector quantity (has direction).
- Average velocity
- Total displacement divided by total time taken.
- Acceleration
- Rate of change of velocity with time; it indicates speeding up, slowing down, or changing direction.
- Time
- A scalar quantity that measures duration of events; measured in seconds (s) as SI unit.
- Clock
- Instrument used to measure and display time in hours, minutes and seconds.
- Stopwatch
- Precise timing device used to measure short time intervals, commonly in experiments and sports.
- Time period (Periodic motion)
- Time taken by an object to complete one full cycle of a repeating motion.
End-of-Chapter Trial Paper & Test Questions
Topic-wise questions to test your understanding of every concept in this chapter.
-
A car travels 150 km in 3 hours at constant speed. What is its speed? / एक कार स्थिर गति से 3 घंटे में 150 किमी चलती है। उसकी गति क्या है? (a) 450 km/h / 450 किमी/घंटा (b) 50 km/h / 50 किमी/घंटा (c) 30 km/h / 30 किमी/घंटा (d) 153 km/h / 153 किमी/घंटा
Show answer
(b) 50 km/h / 50 किमी/घंटा — Speed = Distance ÷ Time = 150 km ÷ 3 h = 50 km/h. / गति = दूरी ÷ समय = 150 किमी ÷ 3 घंटा = 50 किमी/घंटा।
-
On a distance–time graph, a straight line with a steep slope represents ______. / दूरी-समय ग्राफ पर, तीव्र ढाल (steep slope) वाली सीधी रेखा ______ को दर्शाती है।
Show answer
high constant speed (uniform motion) / उच्च नियत गति (एकसमान गति) — The slope of a distance–time graph equals speed; a steeper straight line means a higher constant speed. / दूरी-समय ग्राफ की ढाल गति के बराबर होती है; अधिक तीव्र सीधी रेखा अधिक नियत गति दर्शाती है।
-
What does a horizontal (flat) line on a distance–time graph indicate? / दूरी-समय ग्राफ पर एक क्षैतिज (समतल) रेखा क्या दर्शाती है? (a) Increasing speed / बढ़ती हुई गति (b) Decreasing speed / घटती हुई गति (c) Object is at rest / वस्तु विराम में है (d) Object moving in a circle / वस्तु वृत्त में गति कर रही है
Show answer
(c) Object is at rest / वस्तु विराम में है — A horizontal line means distance does not change with time, so the slope (speed) is zero and the object is stationary. / क्षैतिज रेखा का अर्थ है कि समय के साथ दूरी नहीं बदलती, इसलिए ढाल (गति) शून्य है और वस्तु स्थिर है।
-
True or False: Average speed is the same as instantaneous speed for all types of motion. / सत्य या असत्य: सभी प्रकार की गति के लिए औसत गति और तात्कालिक गति समान होती है।
Show answer
False / असत्य — Average speed equals total distance ÷ total time; it equals instantaneous speed only for uniform motion. For non-uniform motion they differ. / औसत गति = कुल दूरी ÷ कुल समय; यह तात्कालिक गति के बराबर केवल एकसमान गति में होती है। असमान गति में दोनों भिन्न होती हैं।
-
Convert 54 km/h into m/s. / 54 किमी/घंटा को मीटर/सेकंड में बदलिए।
Show answer
54 km/h × (5/18) = 15 m/s. / 54 किमी/घंटा × (5/18) = 15 मीटर/सेकंड। — To convert km/h to m/s, multiply by 5/18 (since 1 km = 1000 m and 1 h = 3600 s). / किमी/घंटा को मीटर/सेकंड में बदलने के लिए 5/18 से गुणा करें (क्योंकि 1 किमी = 1000 मीटर और 1 घंटा = 3600 सेकंड)।
-
A pendulum completes 20 full swings in 40 seconds. What is the time period of one swing? / एक लोलक 40 सेकंड में 20 पूर्ण दोलन पूरे करता है। एक दोलन का आवर्तकाल क्या है?
Show answer
Time period T = total time ÷ number of cycles = 40 s ÷ 20 = 2 s. / आवर्तकाल T = कुल समय ÷ दोलनों की संख्या = 40 सेकंड ÷ 20 = 2 सेकंड।
-
What type of motion does a pendulum exhibit? / एक लोलक किस प्रकार की गति प्रदर्शित करता है?
Show answer
Oscillatory (periodic) motion. / दोलनीय (आवर्ती) गति। — A pendulum swings to-and-fro about its mean position and repeats the motion at regular intervals, making it oscillatory and periodic. / लोलक अपनी माध्य स्थिति के बारे में आगे-पीछे झूलता है और नियमित अंतराल पर गति दोहराता है, जिससे यह दोलनीय और आवर्ती होता है।
-
A cyclist covers 600 m in 2 minutes. Calculate the average speed in m/s. / एक साइकिल चालक 2 मिनट में 600 मीटर की दूरी तय करता है। औसत गति m/s में परिकलित कीजिए।
Show answer
Time = 2 min = 120 s; Speed = Distance ÷ Time = 600 m ÷ 120 s = 5 m/s. / समय = 2 मिनट = 120 सेकंड; गति = दूरी ÷ समय = 600 मीटर ÷ 120 सेकंड = 5 मीटर/सेकंड।
Related Laws & Principles
Explore allFoundational laws & principles behind this chapter. Each one opens a full page — what it says, why it matters, five practice questions and the mistakes to avoid.