Overview
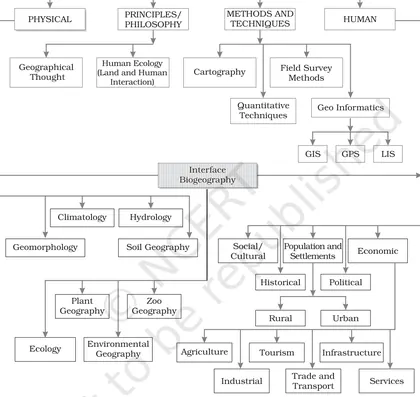
This chapter introduces Geography as a systematic discipline that studies the locations, distributions and relationships between natural features and human activities on Earth. It explains the nature and scope of geography, its objectives and importance, major branches (physical, human and integrated/techniques), fundamental concepts (space, place, region, scale, environment, interrelationships), and the methods and tools geographers use (field observation, surveying, maps, remote sensing and GIS). The chapter shows how geography links natural and social sciences to explain patterns of climate, landforms, vegetation, population and economic activities, and how this knowledge helps in planning, resource management and addressing environmental challenges like sustainability and disaster mitigation.
Learning Objectives
- Define geography and outline its scope as a discipline
- Explain the importance of geography in analysing human–environment relationships
- Distinguish between physical and human geography with suitable examples
- Compare systematic and regional approaches to geography and state the kinds of questions each addresses
- Describe the main branches and sub‑disciplines of geography (e.g., geomorphology, climatology, biogeography, economic and urban geography)
- Explain environmental determinism and possibilism and assess their significance in geographic thought
- Identify and classify types of regions (formal, functional/nodal, vernacular) with examples
- Explain common methods and techniques used in geographic research (field observation, surveys, sampling, statistical analysis)
Topics in this chapter
9 topics · tap a topic title to jump straight to it.
Geography as a Discipline
Definition and core idea: Geography is the systematic study of the Earth’s surface, the distribution of phenomena (physical and human), and the processes that shape places and environments. It asks where things are, why they are there, and how they are connected.
Nature and scope: Geography is both a physical and social science. It links natural systems (landforms, climate, vegetation) with human activities (settlement, economy, culture). Its scope includes location, distribution, spatial organization, interaction, change over time and regional uniqueness.
Branches: Major branches are Physical Geography (landforms, climatology, biogeography, hydrology), Human Geography (population, economic, cultural, urban), and Technical/Applied Geography (cartography, remote sensing, GIS, spatial analysis).
Approaches: Systematic approach studies one theme (e.g., climate) across the globe. Regional approach studies all aspects (physical + human) of a particular area (e.g., the Deccan Plateau). Both approaches complement each other.
Methods and tools: Geography uses observation, field survey, mapping, remote sensing, GIS, statistical and quantitative techniques, models and case studies. Maps are the fundamental tool — used to represent spatial information, show patterns and support analysis.
Relationship with other disciplines: Geography is interdisciplinary. It borrows from geology, meteorology, ecology, economics, sociology, history and demography. For example, physical geography relies on geology; urban geography uses economics and sociology.
Why it matters (importance): Geography helps in planning (urban, regional, resource management), disaster risk reduction (flood mapping, landslide zoning), environmental management (land-use planning, conservation), and policy making (transport, public health, agriculture).
Key principles: Spatial interaction (flows of people/goods/information), scale (local to global), location (absolute and relative), region (formal, functional, perceptual), and human-environment interdependence.
- Using GIS to plan the most efficient bus routes in a city by analyzing population density, road network and travel demand.
- Remote sensing used to detect crop health and predict yields; farmers and governments use NDVI images to target inputs.
- A regional study of the Himalayan region combining geology (tectonics), climatology (monsoon patterns) and human geography (transhumance, settlements).
- Map scale example: On a map with scale 1:1,000,000, a measured map distance of 5 cm represents 50 km on the ground (5 × 1,000,000 cm = 50,000,000 cm = 50 km).
- Population density example: Delhi’s high population density (persons per sq. km) used to prioritize infrastructure and public service delivery.
- Representative Fraction (RF) scale: RF = 1 : n (e.g., 1:50,000). Ground distance = map distance × n.
- Statement (verbal) scale: 1 cm on map = x km on ground. Convert to RF by: n = (x km × 100,000) if x in km and map units are cm.
- Linear scale conversion example: If RF = 1:1,000,000, then 1 cm on map = 10 km on ground (because 1,000,000 cm = 10 km).
- Population density: D = P / A, where P = population, A = area (e.g., persons per km²).
- Rate of population growth (annual, compound): r (%) = [(P2 / P1)^(1/n) − 1] × 100, where P1 and P2 are populations at start and end, n = number of years.
- Gradient / Slope (percent): slope% = (vertical rise / horizontal run) × 100. For angle: slope° = arctan(rise/run).
Branches of Geography
Geography is the study of Earth's surfaces, environments and human-environment relationships. It is commonly divided into two major approaches — systematic and regional — and into several specialized branches that apply different methods and focus on particular phenomena.
1. Systematic vs Regional approaches
- Systematic geography studies one theme or phenomenon across the world (for example, climatology studies climate patterns everywhere).
- Regional geography studies all phenomena (natural and human) within a particular region to understand its unique character (for example, studying the Himalaya as a distinct region).
2. Major branches of Geography
A. Physical Geography — studies natural features and processes.
- Geomorphology: origin, evolution and form of landforms (rivers, mountains, coasts). Methods: field survey, topographic maps, cross-sections. Example topics: river incision, mountain building, coastal erosion.
- Climatology and Meteorology: atmospheric processes, weather, climate classification, climate change. Tools: weather stations, synoptic charts, climate models.
- Hydrology: distribution and movement of water (rivers, groundwater, floods). Uses hydrographs, discharge calculations.
- Biogeography (Floral and Faunal Geography): distribution of plants and animals, ecosystems and biomes, biodiversity patterns.
- Soil Geography (Pedology): soil types, formation processes, fertility and distribution.
B. Human (Cultural) Geography — studies people, societies and their spatial behavior.
- Population Geography: distribution, density, growth, migration, demographic structure.
- Economic Geography: location of industries, agriculture patterns, resource use and trade.
- Cultural Geography: language, religion, customs and cultural landscapes.
- Political Geography: territorial organization, boundaries, geopolitics.
- Settlement and Urban Geography: types of settlements, urbanization, land use, city planning.
C. Regional Geography — integrates physical and human aspects to describe and explain particular regions (e.g., South Asia, Western Ghats).
D. Applied and Technical Branches
- Cartography: map-making and map interpretation.
- Remote Sensing: using aerial and satellite imagery to observe Earth (crop monitoring, disaster assessment).
- Geographic Information Systems (GIS): spatial data storage, analysis and visualization for planning, hazard mapping, resource management.
- Quantitative Methods and Spatial Analysis: statistical and mathematical tools used in geography (spatial models, regression, interpolation).
- Environmental Geography and Resource Management: sustainable management, conservation, impact assessment.
3. Methods and Interdisciplinary Nature
Geography uses fieldwork, mapping, remote sensing, GIS, quantitative analysis, case studies and models. It often integrates knowledge from geology, ecology, economics, sociology, climatology and political science.
4. Importance
- Informs regional and urban planning, disaster management and environmental conservation.
- Helps in resource allocation, transport and infrastructure planning.
- Provides tools for monitoring climate change, land-use change and biodiversity loss.
5. How branches interlink (example)
To manage floods in a river basin you need hydrology (flood dynamics), geomorphology (river channel and floodplain form), climatology (rainfall patterns), soil geography (infiltration rates), land use and settlement geography (population exposed), and GIS/remote sensing (mapping inundation and planning mitigation).
Summary: The branches of geography provide specialized lenses — physical, human, regional and technical — to study Earth’s environments and human activities, often working together to solve real-world problems.
- Geomorphology: Study of the Himalayan mountain-building, processes causing landslides in Sikkim and Uttarakhand.
- Climatology: Analysis of the Indian monsoon seasonal cycle and its impact on agriculture.
- Hydrology: Flood monitoring and forecasting in the Ganga–Brahmaputra basin using discharge records and hydrographs.
- Biogeography: Mapping the Western Ghats biodiversity hotspots and patterns of endemic species.
- Soil Geography: Assessing soil erosion and fertility decline in the Deccan Plateau affecting crop yields.
- Population Geography: Studying high population density and migration patterns in Mumbai metropolitan region.
- Population density = Total population / Area (people per sq. km).
- Arithmetic growth rate (%) = [(P2 - P1) / P1] × 100, where P1 and P2 are populations at two times.
- Exponential growth rate (annual, r) ≈ (ln P2 - ln P1) / t, where t is years between P1 and P2.
- Doubling time (approx) = 70 / r (%), where r is annual percent growth.
- Rate of natural increase (%) = (Crude Birth Rate - Crude Death Rate) / 10 (if rates are per 1000).
- Physiological density = Population / Arable land area (people per unit arable land).
Approaches in Geography
Introduction
In geography an 'approach' is a way of looking at and studying the Earth and its phenomena. Different approaches emphasise different units, questions and methods — from studying themes (systematic) to studying places (regional) to analysing human–environment relations (ecological). Modern geography uses a mix of approaches supported by fieldwork, cartography, statistics, remote sensing and GIS.
1. Systematic approach
Definition: Studies specific geographical themes or fields (for example physical geography, economic geography, population geography) across space and time to form generalisations and theories.
Focus: Concepts, spatial patterns, processes and laws within particular sub-fields. Methods: classification, comparative study, mapping, quantitative analysis and modelling.
Strengths: Encourages depth in thematic understanding, easier to compare places; useful for hypothesis testing and building theory.
Limitations: May ignore local uniqueness and interactions among themes.
2. Regional (Areal Differentiation) approach
Definition: Studies the uniqueness and interrelationship of both physical and human phenomena in a particular area or region.
Focus: Spatial integration — how landforms, climate, soils, vegetation, people and economic activities interact to create distinct regions.
Types of regions: formal (uniform physical or cultural traits), functional (nodal or service areas), vernacular/perceptual (popularly perceived regions).
Methods: regionalisation (delimiting regions using criteria), field study, synthesis of multiple thematic maps.
Strengths: Captures complexity and local identity; useful for planning. Limitations: Boundaries can be subjective; difficult to generalise.
3. Ecological / Human–Environment approach
Definition: Emphasises relationships and feedbacks between human societies and natural environment (man–land relationships).
Focus: Impact of human activity on environment (deforestation, urbanisation), and how environmental conditions constrain or enable human activities.
Methods: case studies, field observation, environmental impact assessment, modelling of flows (energy, matter).
Strengths: Useful for sustainable planning and resource management. Limitations: Complex causality; requires interdisciplinary data.
4. Locational (Spatial) approach
Definition: Concerned with absolute and relative location of phenomena and their spatial distribution and patterns.
Focus: Where things are, why they are there and how spatial arrangement affects processes (e.g., site and situation, central place theory, network analysis).
Methods: point pattern analysis, spatial statistics, GIS network analysis.
Strengths: Crucial for transport, urban planning, logistics. Limitations: May underplay human/social meanings.
5. Systems and Integrated approaches
Systems approach: Treats geographic entities as systems with inputs, processes, outputs and feedbacks (e.g., drainage basin as a hydrological system). Useful for modelling flows and equilibrium/disequilibrium.
Integrated / multidisciplinary approach: Combines physical and human geography, plus economics, sociology, ecology and technology (GIS/RS) for holistic understanding and applied solutions (e.g., watershed management).
6. Modern quantitative and technological approaches
Includes statistical methods, mathematical models, spatial analysis, remote sensing, GIS and GPS. These increase precision, allow large-area analysis and support decision-making (urban growth modelling, hazard mapping, resource inventory).
Summary: how to choose an approach
Choice depends on the question: to explain a theme across places use systematic; to understand a specific place use regional; to study interactions use ecological or systems; to solve location or network problems use locational and quantitative/GIS tools. Most real geographic inquiries use a combination.
- Systematic: Studying world rainfall patterns (monsoon, equatorial, temperate) to identify global climatic zones.
- Regional: Analysing the Himalayan region—its topography, climate, vegetation, settlement patterns and economic activities together as a distinct region.
- Ecological: Examining how deforestation in the Western Ghats affects slope stability, streamflow and downstream agriculture.
- Locational/Spatial: Choosing a site for a new logistics hub using distance-to-market, transport connectivity and accessibility analyses in GIS.
- Systems: Modelling a river basin as a system — inputs (precipitation), processes (infiltration, runoff), outputs (river discharge) and feedbacks (land-use change altering runoff).
- Integrated/Applied: Urban flood management combining land-use maps, rainfall-runoff models, drainage capacity data and community vulnerability surveys.
- Population density = Total population / Area (people per sq. km)
- Decadal growth rate (%) = [(P2 - P1) / P1] × 100, where P1 and P2 are populations at two dates
- Distance (Cartesian) between two points = sqrt[(x2 - x1)^2 + (y2 - y1)^2] (useful in spatial analysis and GIS)
- Slope (%) = (vertical rise / horizontal run) × 100; Slope (degrees) = arctan(vertical rise / horizontal run) × (180/π)
- Drainage density = Total length of streams in a basin / Basin area (km per sq. km)
- Pearson correlation coefficient (r) = [Σ(x - x̄)(y - ȳ)] / [sqrt(Σ(x - x̄)^2) × sqrt(Σ(y - ȳ)^2)] — used to measure spatial relationships
Fundamental Geographical Concepts
Fundamental geographical concepts are basic ideas and analytical tools that geographers use to describe, compare and explain the arrangement of phenomena on the Earth's surface. They form the conceptual foundation of geographic thought and practice, linking spatial description with explanation and prediction.
Key concepts (with brief definitions):
- Location – The position of a phenomenon on Earth. Absolute location uses coordinates (latitude/longitude); relative location describes position in relation to other places.
- Place – Characteristics (physical and human) that give a location its identity (e.g., climate, landforms, culture).
- Region – An area defined by one or more unifying characteristics. Types: formal (uniform), functional (nodal), and perceptual (vernacular).
- Scale – The spatial extent of analysis (local, regional, national, global) and the map scale (ratio between map distance and ground distance).
- Distribution – How phenomena are arranged in space, described by pattern (linear, clustered, dispersed), density and concentration.
- Density – Frequency of occurrence per unit area (e.g., population per km2).
- Pattern – The geometric arrangement of objects on the ground (e.g., grid, radial).
- Spatial association – Degree to which two or more phenomena co-occur in space (positive, negative or random association).
- Interaction/Movement – Flows of people, goods, energy and information between places; includes migration, trade, commuting.
- Connectivity and Accessibility – How well places are linked (networks, transport); accessibility is ease of reaching a place.
- Diffusion – The spread of ideas, innovations, diseases or cultural traits across space (contagious, hierarchical, relocation diffusion).
- Site and Situation – Site is the physical character of a place; Situation is its relational position relative to other places.
- Landscape and Environment – Landscape is the composite of natural and cultural features; geography studies interactions between humans and environment (human–environment relationship).
- Tobler's First Law – ‘‘Everything is related to everything else, but near things are more related than distant things’’ (principle of distance decay).
Applications and methods: geographers measure and map these concepts using tools like maps, thematic maps (choropleth, dot, isoline, proportional symbol), GIS, remote sensing and field observation. Quantification (e.g., densities, rates), spatial statistics and models (gravity model, network analysis) help explain patterns and predict flows.
Why these concepts matter: they enable systematic description (where), explanation (why there) and forecasting (what next). For example, understanding region and scale helps policy-makers design local vs. regional interventions; spatial association helps identify environmental hazards correlated with socio-economic conditions.
- Location: Mumbai’s absolute location ≈ 19.07°N, 72.87°E; relative location—on the west coast of India, near major shipping routes.
- Place: Varanasi’s identity is shaped by the Ganga river (physical) and religious practices (human).
- Region: The Indo-Gangetic Plain as a formal region defined by flat alluvial soils and intensive agriculture; a metropolitan area as a functional region centered on commuting patterns.
- Scale: A city plan (large scale) shows street-level detail; a national map (small scale) shows broad patterns but not street detail.
- Distribution & Pattern: Urban housing can be clustered (slums), linear (settlements along a road or river) or dispersed (rural farmsteads).
- Density: Arithmetic population density = total population / total land area (e.g., people per km²).
- Map scale (Representative Fraction): RF = 1 : n (map distance : ground distance). For example, 1:50,000 means 1 cm on map = 50,000 cm on ground (500 m).
- Map distance to ground distance: Ground distance = Map distance × Scale denominator. (e.g., 4 cm on 1:50,000 map = 4 × 50,000 cm = 2 km).
- Arithmetic (population) density: D_a = Total population / Total land area (people per km²).
- Physiological density: D_p = Total population / Arable land area (people per km² of arable land).
- Agricultural density: D_ag = Number of farmers / Arable land area (farmers per km²).
- Euclidean (planar) distance between two points: d = sqrt((x2 - x1)^2 + (y2 - y1)^2). (Use coordinate units in same projection.)
Methods and Techniques of Geographic Study
Overview: Methods and techniques of geographic study are the procedures geographers use to collect, analyse, represent and interpret spatial information about the Earth's surface and human-environment interactions. Geography uses both qualitative and quantitative approaches and integrates field observation, mapping, remote sensing, GIS, statistical analysis and models.
Major methods and what they do:
- Fieldwork (Primary data collection): direct observation, transect walks, point/plot sampling (soil, vegetation), GPS location, measurement of features, photo-recording, structured and unstructured interviews, household surveys. Purpose: acquire ground truth and contextual detail not visible from remote data.
- Cartography and Thematic Mapping: designing maps (choice of scale, projection, symbols). Thematic maps (choropleth, dot, proportional symbol, isopleth/contour, flow maps, cartograms) summarize spatial patterns and relationships.
- Remote Sensing and Aerial Photography: acquisition of information from satellites, aircraft or drones (multispectral images, aerial photos). Useful for land-use/land-cover mapping, vegetation indices, detection of changes (deforestation, urban expansion), coastal erosion monitoring.
- Geographic Information Systems (GIS): storage, retrieval, analysis and visualization of spatial data (vector and raster). Functions: overlay analysis, buffering, network analysis, spatial query, suitability modelling and map production.
- Quantitative and Statistical Methods: descriptive statistics (mean, median, standard deviation), measures of density and growth, correlation and regression, spatial statistics (autocorrelation), sampling theory and hypothesis testing to detect and quantify patterns.
- Qualitative Methods: participant observation, oral histories, focus groups, content analysis of texts and images—important for human and cultural geography to understand perceptions, behaviours and meanings.
- Modeling and Simulation: conceptual, mathematical and computer models to represent processes (population growth models, migration models, urban growth simulations). Models help test scenarios and predict changes.
Data sources and validation: Primary data (field surveys, measurements, interviews), secondary data (census, administrative records, published maps, satellite products). Validation techniques include ground truthing (comparing remote data with field observations), accuracy assessment (confusion matrix for classified images) and cross-checking multiple sources.
Steps in a typical geographic study:
- Define objectives and spatial/temporal scope.
- Choose methods (sampling design, instruments, data sources).
- Collect data (fieldwork, remote sensing, secondary datasets).
- Process and clean data (georeferencing, digitization, classification).
- Analyse (statistical tests, GIS spatial analysis, thematic mapping).
- Interpret results and draw conclusions (consider scale, limitations, uncertainties).
- Communicate findings (maps, charts, reports, presentations).
Good practice and limitations: select appropriate scale and projection; use representative sampling; document methods and metadata; account for errors (instrumental, sampling, classification); consider ethical issues (consent in surveys, privacy of location data).
- Fieldwork: Students measure river channel width and depth along a transect to compute cross-sectional area and relate discharge to rainfall events.
- Remote sensing: Use Landsat or Sentinel imagery to map urban expansion around a city over three decades and quantify the increase in built-up area.
- GIS application: Municipal planners use overlay analysis (soil suitability, slope, distance to roads) to identify suitable zones for a new residential development.
- Statistical study: Calculate decadal population growth rates from census data and use scatter plots and correlation to test relationships between literacy rate and per-capita income.
- Aerial/drone survey: Monitor coastal erosion by comparing repeated drone orthophotos and generating coastline change maps (gain/loss).
- Qualitative research: Conduct focus-group interviews with farmers to understand perceptions of changing rainfall patterns and adaptation strategies.
- Population density = Total population / Area (persons per sq. km)
- Decadal growth rate (%) = ((P2 - P1) / P1) × 100 where P1 = population at start, P2 = population after 10 years
- Compound annual growth rate (CAGR) (%) = [(P2 / P1)^(1/n) - 1] × 100 where n = number of years
- Map scale (representative fraction, RF) = map distance / ground distance. If RF = 1 : n then Ground distance = map distance × n
- Slope (%) = (Vertical change ÷ Horizontal distance) × 100
- Mean (x̄) = Σx / n; Standard deviation (σ) = sqrt[Σ(x - x̄)^2 / n] (population)
Relationship with Other Disciplines
Geography is an integrative discipline that links physical processes and human activities across space and time. Its relationships with other disciplines can be grouped into three broad types: complementary (sharing methods and concepts), application-based (providing data/tools for other fields), and interdisciplinary (joint approaches to solve complex problems).
1. Relationship with Earth and Physical Sciences
- Geology: Explains rock types, structure and tectonics; geography uses this to map landforms, mineral resources and hazards (earthquakes, landslides).
- Meteorology/Climatology: Provides atmospheric processes and weather systems; geography applies them to climatic zonation, weather-related hazards and regional climate impacts.
- Oceanography: Supplies knowledge of ocean currents, tides and marine ecosystems; geography uses it for coastal landform studies, marine resources and coastal management.
2. Relationship with Biological Sciences
- Biology/Ecology: Explains species, ecosystems and biogeographical distributions; geography uses these for vegetation mapping, land use, conservation and environmental impact assessment.
3. Relationship with Social Sciences and Humanities
- History: Integrates past human settlement, landscape evolution and historical maps to explain current spatial patterns.
- Economics: Uses spatial distribution of resources, industry, trade and regional development; geography contributes location analysis, spatial planning and resource management.
- Political Science: Interacts on boundaries, geopolitics, territoriality and governance of resources.
- Sociology/Anthropology: Shares study of population, culture, migration, urbanization and human-environment interactions.
4. Relationship with Quantitative and Technical Disciplines
- Mathematics & Statistics: Provide tools for spatial analysis, probability, sampling, demographic calculations and modeling.
- Remote Sensing, GIS & IT: Offer data acquisition, spatial databases, analysis and visualization techniques that are central to modern geographic research and planning.
5. Applied and Interdisciplinary Areas
- Urban and Regional Planning: Geography supplies land-use analysis, transport networks and site selection methods for planners.
- Disaster Management: Combines physical hazard analysis (geology, meteorology) with social vulnerability (sociology, economics) to prepare risk maps and response plans.
- Agricultural Sciences: Use soil, climate and topography data from geography to decide cropping patterns, irrigation and sustainable practices.
- Environmental Science: Jointly addresses pollution, biodiversity loss and climate change through spatial assessment and policy recommendations.
Why these relationships matter: Geography acts as a bridge—taking theories and methods from other disciplines and applying them at varying spatial scales (local to global). This multidisciplinary character makes geography essential for solving real-world problems such as climate adaptation, sustainable resource use and equitable regional development.
- Disaster Management: Geographers map flood-prone zones using rainfall (meteorology), soil permeability (soil science), topography (geomorphology) and population density (demography) to plan evacuation routes and shelters.
- Urban Planning: GIS layers (land use, transport networks, population data from sociology/economics) help planners decide locations for hospitals, schools and waste disposal.
- Agriculture: Crop suitability maps combine climate data (climatology), soil maps (pedology), slope (geomorphology) and market access (economics) to recommend optimal crops.
- Climate Change Impact Assessment: Climatology provides temperature/precipitation trends; ecology predicts species range shifts; geography maps vulnerable regions for conservation and adaptation.
- Mineral Exploration: Geology identifies rock formations and structures, geochemistry tests mineral content, while geography maps accessibility, land use and socio-economic impacts of mining.
- Population Density = Total Population / Area (people per sq. km)
- Annual Growth Rate (%) ≈ [(P2/P1)^(1/t) - 1] × 100, where P1 and P2 are populations at two times separated by t years
- Doubling Time (approx) = 70 / Growth Rate (%) (Rule of 70)
- Map Scale (Representative Fraction) RF = Map Distance / Ground Distance (e.g., 1/50,000 means 1 cm on map = 50,000 cm on ground)
- Distance on Ground = Map Distance × Scale Factor (convert units appropriately)
- Time Difference in hours = Longitude Difference (degrees) × 4 minutes per degree ÷ 60
Historical Development of Geographic Thought
Introduction
Geographic thought has evolved from early descriptive and cartographic activity to a diverse, theory-rich, and technology-driven discipline. The changes reflect shifting questions (Where? Why there? How?), methods (maps → measurement → statistics → GIS), and values (determinism → human agency → critical perspectives).
1. Ancient and Classical Geography (to ~500 CE)
Key contributions: Eratosthenes (approximate Earth circumference, latitude/longitude idea), Ptolemy (Geographia — coordinate-based mapping), Strabo (regional descriptions). Focus: mapping the known world, positional geography and travel description.
2. Medieval and Islamic/Asian Traditions (500–1500 CE)
Scholars such as Al-Idrisi and Al-Biruni advanced cartography, regional descriptions, and measurements; Chinese geographers (e.g., Pei Xiu) developed detailed maps. Emphasis remained descriptive but improved accuracy and instruments.
3. Age of Discovery and Cartographic Advances (15th–17th centuries)
European voyages (Columbus, Magellan) expanded geographic knowledge. Mercator’s projection (1569) improved navigation. The period emphasized exploration, map-making, and integrating new spatial data.
4. 18th–19th Centuries: Systematic and Thematic Beginnings
Alexander von Humboldt pioneered systematic physical geography and thematic mapping (linking climate, vegetation, and altitude). Carl Ritter and others promoted comparative regional study. Geography began moving from mere description to explanation of spatial patterns.
5. Environmental Determinism → Possibilism (late 19th–early 20th c.)
Environmental determinism argued that climate and landforms determined human societies (proponents: Ellsworth Huntington, Ellen Semple). Critics (notably French geographers like Paul Vidal de la Blache) developed possibilism: the environment offers possibilities, but human agency, culture and technology choose among them. This debate shifted focus toward human–environment interactions.
6. Regional vs Systematic Geography (early–mid 20th c.)
Regional (idiographic) geography emphasized unique descriptions of places (Hartshorne). Systematic (nomothetic) geography sought general laws (physical processes, economic patterns). This methodological debate set the stage for later quantitative analysis.
7. Quantitative Revolution (1950s–1960s)
Geography adopted statistical, mathematical and model-based methods: spatial statistics, gravity models, central place theory (Christaller), and spatial interaction models. The aim: testable, generalizable explanations of spatial phenomena.
8. Behavioral and Humanistic Geography (1960s–1970s)
Responding to the perceived coldness of quantitative methods, behavioral geography explored perception, decision-making and subjective human experience (focus on mental maps, decision processes). Humanistic geography (Yi-Fu Tuan) emphasized meaning, place and lived experience.
9. Critical, Marxist, Feminist and Postmodern Geographies (1970s–1990s)
These approaches critique power structures, capitalism (David Harvey), gendered spaces, and the assumptions behind knowledge production. They emphasize inequality, social justice and multiple narratives about space and place.
10. Technological Revolution and Contemporary Geography (1990s–present)
GIS, remote sensing, GPS, spatial modeling and big spatial data transformed methods and applications. Contemporary geography integrates physical and human systems (earth system science), addresses climate change, sustainability, political ecology, urbanization, and uses data-intensive tools for planning and management.
Key trends summarized: descriptive → explanatory; deterministic → agency/possibilism; regional idiographic → systematic nomothetic; qualitative ↔ quantitative; manual cartography → digital GIS & big data; emphasis now on interdisciplinary, applied, and critical approaches.
Why this matters (applications): Understanding the history of geographic thought explains why geographers use particular methods (maps, models, GIS), how spatial policies are formed, and how to critically evaluate geographic claims (e.g., when environment is wrongly blamed for social outcomes).
- Eratosthenes’ measurement of Earth’s circumference (ancient use of geometry and shadows) — an early quantitative geographic method.
- Mercator projection (1569) enabled safer long-distance navigation by preserving direction, shaping Age of Discovery voyages.
- Von Thünen’s land-use rings (19th century) illustrate economic geography explaining agricultural patterns around a market town.
- Central place theory (Christaller) applied to locating retail centers and service hierarchies in urban planning.
- Humboldt’s plant geography: linking altitude, climate and vegetation — an early example of systematic physical geography.
- Use of GIS and remote sensing for flood-risk mapping in Bangladesh (modern application combining physical and human geography).
- Population density = Total population (P) / Area (A). Unit: persons per sq. km.
- Crude Birth Rate (CBR) = (Number of births in a year / Mid-year population) × 1000. Crude Death Rate (CDR) similar.
- Rate of Natural Increase (per 1000) = CBR − CDR. Annual growth rate (%) ≈ (P2 − P1)/P1 × 100 ÷ number of years.
- Doubling time (approx.) = 70 / annual growth rate (%).
- Map scale (Representative Fraction) = map distance / ground distance (e.g., 1:50,000 means 1 cm on map = 50,000 cm on ground).
- Gravity model of interaction: Tij = k (Pi^α * Pj^β) / Dij^γ, where Tij = interaction between places i and j, Pi/Pj = masses (population), Dij = distance, and α,β,γ are parameters.
Applications and Importance of Geography
Geography is the study of the Earth’s surfaces, environments, and the relationships between people and places. Its applications span physical, human and applied branches and use tools such as maps, remote sensing (RS), Geographic Information Systems (GIS) and spatial statistics to analyze location, distribution, interaction and change over space and time.
Applications: Geography is applied to solve real-world problems in planning, resource management, hazard mitigation, environmental protection, transportation, public health, agriculture and economic development. Geographical methods help locate facilities (industries, hospitals, schools), select routes for transport, map resources, plan urban growth and model environmental impacts.
Importance: Geography provides spatial thinking — the ability to see patterns, relationships and processes on the Earth’s surface. It integrates natural and social sciences, helping policymakers and communities make evidence-based decisions. Geography improves disaster preparedness by mapping vulnerability zones, supports sustainable land use by identifying suitable areas for crops and infrastructure, and enables monitoring of climate change, deforestation, water resources and urbanization.
Tools & Techniques: Modern geography relies on maps, thematic maps (choropleth, dot), GIS for layering spatial data and performing analyses (buffering, overlay, network analysis), and remote sensing for large-scale monitoring (land use change, crop health, flood mapping). Field surveys, statistical analysis and modelling (spatial interpolation, suitability analysis) complement these tools.
Interdisciplinary role: Geography connects geology, meteorology, ecology, economics, sociology and public health. For example, epidemiologists use geographical analysis to trace disease spread; economists use regional geography to study resource distribution and market accessibility.
Outcome & societal benefits: Geographical studies lead to better land-use zoning, efficient transportation networks, safer cities, optimised agriculture, targeted disaster response and conservation strategies. These outcomes increase economic efficiency, reduce risk and support sustainable development.
- Disaster management: Using GIS and satellite images to map flood-prone zones and plan evacuation routes (e.g., flood zoning and early-warning systems for rivers).
- Urban planning: City planners use land-use maps and population distribution to locate new schools, hospitals and public transport routes.
- Public health: Mapping COVID-19 cases to identify hotspots and direct resources; tracing disease spread patterns using spatial clustering.
- Agriculture: Precision farming guided by soil maps, moisture indices from remote sensing and suitability analysis to improve crop yields.
- Resource management: Locating groundwater potential zones using geological maps and remote sensing to plan sustainable extraction.
- Transport logistics: Route optimisation and site-selection for distribution centers using network analysis in GIS.
- Population density = Total population / Area (persons per sq. km)
- Map scale (Representative Fraction, RF) = Distance on map / Distance on ground. Ground distance = Map distance × RF denominator.
- Area conversion using scale: Ground area = Map area × (Scale denominator)^2 (when RF is used)
- Slope (gradient) = Vertical change / Horizontal distance. Slope (%) = (Vertical change ÷ Horizontal distance) × 100
- Annual growth rate (approx) = [(P2 − P1) / P1] × (100 / t) where P1 and P2 are populations at start and end and t is time in years; exact annual growth rate = [(P2/P1)^(1/t) − 1] × 100
- Population change (%) = [(P2 − P1) / P1] × 100
Key Terminology and Concepts to Remember
Geography — definition: Geography is the systematic study of the Earth’s surface, the relationships between people and their environments, and the spatial patterns of phenomena. It integrates physical and human aspects to explain why things are located where they are and how they interact.
Major branches:
- Physical Geography: Studies natural features and processes — landforms, climate, soils, vegetation, water.
- Human Geography: Studies people, settlements, economic activities, culture, population and their spatial patterns.
- Environmental Geography: Links human and physical geography, focusing on interactions, sustainability and environmental change.
Approaches:
- Systematic Geography: Studies a specific theme (e.g., climate) across the world.
- Regional Geography: Studies all themes within a specific area or region (e.g., Indian Subcontinent).
Location concepts:
- Absolute location: Exact position using coordinates (latitude, longitude).
- Relative location: Position in relation to other places (e.g., upstream, inland, near the coast).
- Site: Local physical characteristics of a place (e.g., hilltop, riverbank, soil type).
- Situation: How a place is positioned relative to other places and its accessibility (e.g., a port’s situation along trade routes).
Map basics and scale:
- Map Scale: Relationship between map distance and ground distance. Types — representative fraction (RF), verbal and graphic (scale bar).
- Map Projections: Methods to represent the 3D Earth on a 2D map. All projections cause some distortion. Types: conformal (preserves shape, e.g., Mercator), equal-area (preserves area, e.g., Mollweide), compromise (reduces overall distortion, e.g., Robinson).
- Topography & Relief: Shape and elevation of land surfaces; relief is the difference between highest and lowest elevations.
Coordinate system:
- Latitude (parallels): Angular distance north or south of the Equator (0° to 90° N/S). 1° latitude ≈ 111 km.
- Longitude (meridians): Angular distance east or west of the Prime Meridian (0° to 180° E/W). Distance represented by 1° longitude varies with latitude (1° longitude = 111 km × cos(latitude)).
- Time zones: Earth divided into 24 zones; 15° longitude ≈ 1 hour difference in solar time.
Cartography and thematic maps:
- Topographic maps: Show elevation and landform details with contour lines (isolines).
- Thematic maps: Emphasize a single theme: choropleth (shaded by area values), dot map (points represent counts), proportional symbol (symbols scaled to value), isopleth (interpolated surface like temperature), flow map (movement/flows), cartogram (areas resized by value).
Modern tools:
- Remote Sensing: Acquisition of information from satellites or aircraft (used for land-use mapping, disaster assessment).
- GIS (Geographic Information System): Software to store, manipulate, analyze and display spatial data in layers (used in urban planning, resource management).
- GPS (Global Positioning System): Satellite-based navigation providing accurate location (latitude, longitude, altitude).
Important distinctions to remember: qualitative vs quantitative data; discrete (point/area features) vs continuous surfaces (elevation, temperature); scale of analysis — local, regional, national, global — affects interpretation and patterns.
- Absolute vs Relative location: Absolute — New Delhi: 28°38'N, 77°13'E. Relative — New Delhi is north of Agra and inland from the Bay of Bengal.
- Site vs Situation: Site of Mumbai — natural harbour on the Arabian Sea with rocky promontories; Situation — gateway for trade with Europe and Middle East, located on India’s west coast facilitating shipping routes.
- GIS in real life: Urban planners use GIS layers (roads, land use, population density) to decide where to site a new hospital.
- Remote sensing: Satellite images used after floods to map inundated areas for rescue operations.
- Thematic map example: Choropleth map showing literacy rates by district; dot map showing population distribution in a state; contour map used by hikers to assess steepness of a trail.
- Representative Fraction (RF) = map distance / ground distance (e.g., 1:50,000 means 1 cm on map = 50,000 cm on ground).
- Map distance = Ground distance × RF
- Ground distance = Map distance / RF
- Convert degrees latitude to km: 1° latitude ≈ 111 km (approx.).
- Distance along meridian between two latitudes = |Δlatitude°| × 111 km.
- Distance along parallel between two longitudes = |Δlongitude°| × 111 km × cos(mean latitude).
Key Concepts
- Geography
- The study of the Earth's surfaces, places, environments and the relationships between people and their environments.
- Physical Geography
- A branch of geography that examines natural features and processes of the Earth such as climate, landforms, soils, vegetation and water.
- Human Geography
- The branch of geography concerned with human activities, settlements, culture, economy and how people interact with their environments.
- Systematic Geography
- An approach that studies specific geographical phenomena (like climate, agriculture or transport) across the world to understand general principles.
- Regional Geography
- An approach that studies particular regions to understand the unique combination of natural and human features within them.
- Spatial Perspective
- A way of looking at the world that emphasizes the location, arrangement and organization of phenomena across space.
- Location
- The position of a place on the Earth's surface; can be absolute (coordinates) or relative (in relation to other places).
- Place
- A location with distinctive physical and human characteristics that give it meaning and identity.
- Scale
- The spatial extent of study or the ratio between distance on a map and distance on the ground, used to show detail or overview.
- Region
- An area defined by one or more common characteristics (physical, cultural, economic) that makes it distinct from surrounding areas.
- Distribution
- The arrangement or spread of a phenomenon across space, often described by patterns and density.
- Pattern
- The geometric or spatial arrangement of objects or phenomena on the Earth's surface.
- Cartography
- The science and art of making maps, including design, compilation and interpretation.
- Map
- A scaled, symbolic representation of selected features of the Earth’s surface on a flat medium.
- Map Projection
- A method of representing the curved surface of the Earth on a flat map, each with its own distortions of area, shape, distance or direction.
- Remote Sensing
- The acquisition of information about the Earth's surface from a distance, typically via satellites or aircraft sensors.
- Geographic Information System (GIS)
- A computer-based system for capturing, storing, analyzing and visualizing spatial data in layers to solve geographic problems.
- Global Positioning System (GPS)
- A satellite-based navigation system that provides precise location (latitude, longitude and altitude) and time information.
- Fieldwork
- The collection of primary data by geographers through observation, measurement and interviews conducted on-site.
- Interdisciplinary Approach
- Integrating methods, concepts and data from other disciplines (like economics, sociology, ecology) to enrich geographic analysis.
End-of-Chapter Trial Paper & Test Questions
Topic-wise questions to test your understanding of every concept in this chapter.
-
Define geography and explain why it is considered both a physical and a social science. / भूगोल को परिभाषित कीजिए और समझाइए कि इसे भौतिक तथा सामाजिक विज्ञान दोनों क्यों माना जाता है।
Show answer
Geography is the systematic study of the Earth's surface, the distribution of physical and human phenomena and the processes that shape places; it is both a physical and social science because it links natural systems like landforms and climate with human activities like settlement and economy. / भूगोल पृथ्वी की सतह, भौतिक व मानवीय परिघटनाओं के वितरण तथा स्थानों को आकार देने वाली प्रक्रियाओं का व्यवस्थित अध्ययन है; यह भौतिक व सामाजिक विज्ञान दोनों है क्योंकि यह भू-आकृति व जलवायु जैसी प्राकृतिक प्रणालियों को बस्ती व अर्थव्यवस्था जैसी मानवीय गतिविधियों से जोड़ता है।
-
Distinguish between the systematic and regional approaches in geography with an example each. / भूगोल में क्रमबद्ध (systematic) और प्रादेशिक (regional) उपागमों में अंतर एक-एक उदाहरण सहित कीजिए।
Show answer
The systematic approach studies one theme across the whole world (e.g., climatology studying climate patterns everywhere), whereas the regional approach studies all physical and human aspects of one particular area (e.g., studying the Himalayan region as a whole). / क्रमबद्ध उपागम एक विषय का पूरे विश्व में अध्ययन करता है (जैसे जलवायु-विज्ञान सर्वत्र जलवायु प्रतिरूपों का अध्ययन), जबकि प्रादेशिक उपागम किसी विशेष क्षेत्र के सभी भौतिक व मानवीय पहलुओं का अध्ययन करता है (जैसे हिमालय क्षेत्र का समग्र अध्ययन)।
-
Explain the difference between environmental determinism and possibilism. / पर्यावरणीय निश्चयवाद (determinism) और संभववाद (possibilism) के बीच अंतर समझाइए।
Show answer
Environmental determinism holds that climate and landforms determine human societies and activities, while possibilism argues that the environment offers possibilities and it is human agency, culture and technology that choose among them. / पर्यावरणीय निश्चयवाद मानता है कि जलवायु और भू-आकृतियाँ मानव समाज व गतिविधियों को निर्धारित करती हैं, जबकि संभववाद का तर्क है कि पर्यावरण संभावनाएँ प्रदान करता है और मानव की सक्रियता, संस्कृति व प्रौद्योगिकी उनमें से चयन करती हैं।
-
On a map of scale 1:50,000, a road measures 6 cm. Calculate the actual ground distance in kilometres. / 1:50,000 मापनी वाले मानचित्र पर एक सड़क 6 cm मापती है। वास्तविक भू-दूरी किलोमीटर में ज्ञात कीजिए।
Show answer
Ground distance = map distance × scale denominator = 6 × 50,000 = 3,00,000 cm = 3,00,000 / 1,00,000 = 3 km. / भू-दूरी = मानचित्र दूरी × मापनी हर = 6 × 50,000 = 3,00,000 cm = 3,00,000 / 1,00,000 = 3 km।
-
Differentiate between formal, functional and vernacular regions with examples. / प्रारूपिक (formal), प्रकार्यात्मक (functional) और लोकप्रिय (vernacular) प्रदेशों में अंतर उदाहरण सहित कीजिए।
Show answer
A formal region has uniform characteristics (e.g., the Indo-Gangetic Plain defined by alluvial soils), a functional region is organised around a node or service centre (e.g., a metropolitan commuting area), and a vernacular region is one popularly perceived by people (e.g., a culturally recognised area). / प्रारूपिक प्रदेश में समान विशेषताएँ होती हैं (जैसे जलोढ़ मृदा से परिभाषित सिंधु-गंगा का मैदान), प्रकार्यात्मक प्रदेश किसी केंद्र या सेवा-नोड के चारों ओर संगठित होता है (जैसे महानगरीय आवागमन क्षेत्र), और लोकप्रिय प्रदेश वह है जिसे लोग सामान्य धारणा से पहचानते हैं (जैसे सांस्कृतिक रूप से मान्य क्षेत्र)।
-
Calculate the population density of a region with a population of 24,00,000 living in an area of 8,000 sq km. / 8,000 वर्ग किमी क्षेत्र में रहने वाली 24,00,000 जनसंख्या वाले प्रदेश का जनसंख्या घनत्व ज्ञात कीजिए।
Show answer
Population density = Total population / Area = 24,00,000 / 8,000 = 300 persons per sq km. / जनसंख्या घनत्व = कुल जनसंख्या / क्षेत्रफल = 24,00,000 / 8,000 = 300 व्यक्ति प्रति वर्ग किमी।
-
Name any four modern tools and techniques used in geographic study and state the use of GIS. / भौगोलिक अध्ययन में प्रयुक्त कोई चार आधुनिक उपकरण/तकनीकें बताइए और GIS का उपयोग लिखिए।
Show answer
Four tools are field survey, remote sensing, Geographic Information Systems (GIS) and statistical/quantitative methods; GIS is used to store, retrieve, analyse and visualise spatial data in layers for tasks like overlay analysis, hazard mapping and resource management. / चार उपकरण हैं — क्षेत्र सर्वेक्षण, सुदूर संवेदन (remote sensing), भौगोलिक सूचना तंत्र (GIS) तथा सांख्यिकीय/मात्रात्मक विधियाँ; GIS का उपयोग स्थानिक आँकड़ों को परतों में संग्रहित, पुनर्प्राप्त, विश्लेषित व दृश्यांकित करने के लिए होता है, जैसे ओवरले विश्लेषण, संकट मानचित्रण और संसाधन प्रबंधन।
-
State Tobler's First Law of Geography and explain its significance. / भूगोल के टॉब्लर के प्रथम नियम को बताइए और इसका महत्व समझाइए।
Show answer
Tobler's First Law states that 'everything is related to everything else, but near things are more related than distant things,' which expresses the principle of distance decay and is significant because it underlies spatial analysis and the study of interaction, diffusion and spatial association. / टॉब्लर का प्रथम नियम कहता है कि 'हर वस्तु हर दूसरी वस्तु से संबंधित है, परंतु निकट की वस्तुएँ दूर की वस्तुओं की तुलना में अधिक संबंधित होती हैं', जो दूरी-क्षय (distance decay) सिद्धांत को व्यक्त करता है और महत्वपूर्ण है क्योंकि यह स्थानिक विश्लेषण तथा अंतःक्रिया, प्रसार व स्थानिक सहचर्य के अध्ययन का आधार है।
Related Laws & Principles
Explore allFoundational laws & principles behind this chapter. Each one opens a full page — what it says, why it matters, five practice questions and the mistakes to avoid.