Overview
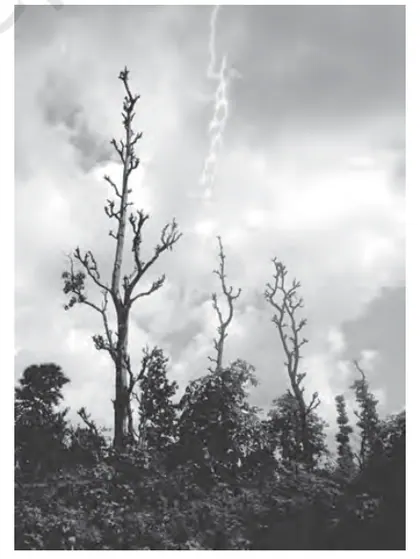
This chapter explains the climate of India — its causes, seasonal patterns and regional variations — with special emphasis on the South-West monsoon that shapes life, agriculture and the economy. It introduces the elements of climate (temperature, pressure and winds, humidity, precipitation), the controls of climate (latitude, altitude, relief, distance from sea, pressure and wind systems, ocean currents), and the dynamics that produce India’s distinct seasons (winter, pre-monsoon/summer, south-west monsoon, and retreating monsoon). Key topics include the mechanism and stages of the monsoon (ITCZ, differential heating, jet streams), types and distribution of rainfall (orographic, convectional, cyclonic), western disturbances and cyclones, spatial patterns of rainfall and temperature across India, and climatic regions/variability. The chapter also links climate to agriculture, water resources and disaster risk (floods, droughts, cyclones) and introduces impacts of climatic variability and change. Studying this chapter helps students interpret climatic data and maps, explain causes of seasonal changes and regional differences, and appreciate the role of climate in shaping human…
Learning Objectives
- Define climate and distinguish it from weather with examples.
- Explain the factors affecting climate (latitude, altitude, distance from sea, ocean currents, pressure and wind systems, relief).
- Describe the distribution and seasonal variation of insolation and its effect on surface temperature.
- Analyze global pressure belts and planetary wind systems and their influence on regional climates.
- Explain the causes and characteristics of different types of precipitation (convectional, orographic, cyclonic).
- Describe the mechanism, stages and climatic effects of the Indian monsoon, including the role of the Himalayas and the Indian Ocean.
- Explain the origin, structure and impacts of tropical cyclones, temperate cyclones and western disturbances.
- Interpret and construct climographs and hythergraphs to analyze monthly temperature and rainfall patterns for selected locations.
Topics in this chapter
17 topics · tap a topic title to jump straight to it.
Introduction: Weather vs Climate
Weather refers to the short-term state of the atmosphere at a particular place and time — the combination of temperature, humidity, precipitation, cloudiness, visibility, wind and atmospheric pressure. Weather changes over minutes, hours and days and is what we experience and forecast for daily planning.
Climate is the long-term statistical description of weather for a place, usually expressed as averages, variability and extremes over standard periods (WMO recommends 30 years). Climate describes typical seasonal patterns and long-term trends (for example, a region being temperate, tropical, arid, etc.).
Key differences
- Timescale: Weather = minutes to weeks; Climate = decades to millennia (commonly 30-year normals).
- Measure: Weather = instantaneous observations and short forecasts; Climate = statistical aggregates (means, variances, percentiles, anomalies).
- Predictability: Weather forecasting is limited by chaotic dynamics beyond ~10–14 days; climate describes boundary conditions and long-term probabilities and is predictable in a statistical sense.
- Use: Weather guides daily decisions; climate guides long-term planning (agriculture, infrastructure, water resources, policy).
Related concepts
- Climate variability: natural fluctuations around the mean (e.g., El Niño/La Niña) that occur on interannual to decadal timescales.
- Climate change: long-term shifts in climate statistics (often multi-decadal) caused by natural and/or anthropogenic forcings.
How they connect: Weather events (e.g., extreme storms, heatwaves) are realizations on top of a region's climate. Climate sets the probabilities and background conditions that influence the frequency and intensity of weather events.
- Tomorrow's heavy rain over Mumbai is weather; the fact that Mumbai has a tropical wet-dry monsoon climate is climate.
- A week-long heatwave in Delhi (weather extreme) vs the observed multi-decade increase in mean annual temperature in northern India (climate change).
- Intermittent cold snaps in Europe are weather; Europe’s temperate maritime climate is the long-term pattern.
- El Niño causing a drier-than-normal monsoon season across India is climate variability influencing seasonal weather.
- Urban heat island: city temperatures higher than surrounding rural areas — a local climate effect produced by land use, not a single weather event.
- Farmers use 30-year climate normals (average rainfall and temperature for each month) to plan cropping calendars — climate, not daily weather.
- Daily mean temperature: T_mean = (T_max + T_min) / 2
- Monthly/annual mean: mean = (1/n) * Σ T_i where T_i are daily (or monthly) temperatures
- Temperature anomaly: anomaly = T_observed - T_reference_mean (used to show deviation from a climatology)
- Standard deviation (variability): σ = sqrt( (1/n) * Σ (T_i - mean)^2 )
- Relative humidity (RH): RH (%) = (e / e_s) * 100 where e = actual vapor pressure, e_s = saturation vapor pressure
- Dew point (Magnus approximation): Td ≈ (b * γ) / (a - γ), with γ = (a*T/(b+T)) + ln(RH/100), a = 17.27, b = 237.7°C
Elements of Climate
Overview
The "elements of climate" are measurable atmospheric features that together describe the climate of a place. These are long‑term average conditions and include temperature, atmospheric pressure, winds, humidity, precipitation, cloudiness, insolation (sunshine), evaporation and atmospheric transparency. Each element is controlled by geographic factors (latitude, altitude, land/sea distribution, ocean currents, relief) and interacts with others to produce characteristic climates.
- Temperature: The degree of hotness or coldness of the air measured in °C (or K). Controls: latitude, altitude (lapse rate), continentality, ocean currents, aspect and vegetation. Instruments: thermometer (maximum/minimum). Significance: determines vegetation zones and human comfort.
- Atmospheric pressure: Weight of air above a unit area, measured in hPa/mbar. Controls: temperature (warm air = low pressure), altitude, large‑scale circulation. Instruments: barometer (aneroid, mercurial). Isobars on weather maps show pressure patterns and help infer winds.
- Winds: Horizontal movement of air caused by pressure gradients and modified by the Coriolis force and friction. Described by direction and speed (m/s, km/h, knots). Instruments: anemometer (speed), wind vane (direction). Local winds (sea/land breeze, mountain/valley winds) and global winds (trade winds, westerlies) are important for weather and climate.
- Humidity: Amount of water vapour in the air. Types: absolute humidity (mass/volume), specific humidity (mass vapour per mass moist air), relative humidity (RH, %). Measured by hygrometers or psychrometers. Affects comfort, precipitation, cloud formation.
- Precipitation: Any form of water that falls from the atmosphere (rain, snow, sleet, hail), measured in mm (rain gauge). Types: convectional, cyclonic/frontal, orographic. Amount and seasonal distribution are central to defining climate (e.g., monsoon climates).
- Cloudiness: Fraction of sky covered by clouds (oktas or %). Controls insolation and nighttime cooling; measured by visual observation or ceilometers.
- Insolation / Sunshine: Incoming solar radiation and duration of bright sunshine (hours). Instruments: pyranometer (radiation), Campbell–Stokes sunshine recorder (hours). Insolation controls temperature and evaporation.
- Evaporation and Evapotranspiration: Loss of water to the atmosphere from open surfaces and vegetation. High in hot, dry, windy conditions; measured/estimated by pan evaporimeters and models (Penman). Important for water balance and drought assessment.
- Atmospheric transparency: Clarity of the atmosphere (aerosols, dust, haze) which affects the amount of solar radiation reaching the surface.
Interactions and Climate Typing
Elements act together. For example, low pressure + warm sea surface produces cyclones; orographic uplift + moisture results in heavy rainfall on windward slopes and a rain shadow on leeward sides. Climatologists use long‑term averages (typically 30 years) of these elements to classify climates (e.g., Koppen classification).
Common instruments & units (quick reference)
Temperature: °C (thermometer); Pressure: hPa/mbar (barometer); Wind speed: m/s, km/h, knots (anemometer); Humidity: % (hygrometer/psychrometer); Precipitation: mm (rain gauge); Sunshine: hours (Campbell–Stokes); Radiation: W/m² (pyranometer).
- Monsoon rainfall in India — seasonal wind reversal (winds + pressure) brings heavy summer precipitation (convectional and cyclonic) to the Indian subcontinent.
- Western Ghats orographic rainfall — moist southwest monsoon winds rise over the Ghats causing heavy rainfall on the windward side and a rain shadow (drier Deccan plateau) on the leeward side.
- Thar Desert — high insolation, large diurnal temperature range, low humidity and high evaporation produce an arid climate.
- Sea breeze/land breeze at coastal cities (e.g., Mumbai) — differential heating between land and sea produces daily wind shifts affecting temperature and humidity.
- Himalayan temperature lapse — temperature falls roughly with height, so high altitude areas (Leh) are much colder than nearby lowlands (Kashmir Valley).
- Cyclone formation in the Bay of Bengal — low pressure over warm seas, high humidity and unstable atmosphere lead to intense storms with strong winds and heavy rainfall.
- Celsius to Kelvin: K = °C + 273.15
- Celsius to Fahrenheit: °F = (°C × 9/5) + 32
- Normal environmental lapse rate (average): ≈ 6.5°C per 1000 m (temperature decrease with height)
- Dry adiabatic lapse rate (DALR): ≈ 9.8°C per 1000 m (unsaturated rising air)
- Saturated (moist) adiabatic lapse rate (SALR): ≈ 5–6°C per 1000 m (varies with moisture)
- Relative Humidity (RH, %): RH = (actual vapor pressure / saturation vapor pressure) × 100
Temperature
What is Temperature?
Temperature is a measure of the degree of hotness or coldness of the atmosphere. In climatology it indicates the average kinetic energy of air molecules and is a fundamental element of climate because it controls evaporation, atmospheric stability, and many biological processes.
How is Temperature Measured?
Common instruments: clinical/mercury thermometer for spot readings, maximum-minimum thermometer (Six's thermometer) to record highest and lowest daily values, thermograph for continuous recording. Observations are sheltered in a Stevenson screen to avoid direct radiation and to ensure standardized exposure.
Basic Types of Temperature Values
- Daily maximum (Tmax) and daily minimum (Tmin)
- Daily mean (= (Tmax + Tmin)/2 or average of 24 hourly values)
- Monthly mean = average of daily means for the month
- Annual mean = average of 12 monthly means
- Diurnal range = Tmax - Tmin
- Annual range = highest monthly mean - lowest monthly mean
Factors Controlling Temperature
- Latitude: controls solar angle and day length. Lower latitudes receive higher insolation and higher mean temperatures.
- Altitude: temperature decreases with height (normal environmental lapse rate ~6.5°C per 1000 m).
- Continentality vs maritime influence: land heats and cools faster than sea. Coastal regions have smaller annual and diurnal ranges; interiors have larger ranges.
- Ocean currents: warm currents increase coastal temperatures; cold currents lower them.
- Cloud cover and albedo: clouds reduce daytime heating and limit night cooling; surface reflectivity (snow, deserts, vegetation) affects absorption.
- Wind and air masses: advection of warm or cold air alters local temperatures (e.g., warm foehn winds raise mountain lee temperatures).
- Aspect and local topography: south-facing slopes (in Northern Hemisphere) are warmer; valleys may trap cold air causing inversions.
Diurnal and Seasonal Variations
Diurnal cycle: highest temperature usually mid-afternoon, lowest just before sunrise. Seasonal (annual) cycle: driven by solar declination and continental distribution; mid-latitudes show large annual variation, equatorial regions small variation.
Temperature Lapse and Inversion
Normal lapse rate: temperature decreases with altitude at about 6.5°C per 1000 m in the troposphere. Temperature inversion occurs when temperature increases with height in a layer, trapping pollutants and causing fog in valleys.
Importance
Temperature affects vegetation zones, agricultural cropping seasons, human comfort, energy demand, and weather phenomena (stability, convection, storm formation).
- Coastal vs inland: Mumbai (maritime) has milder summers and winters with small annual range, while New Delhi (continental) has hot summers and cold winters with a large annual range.
- Altitude effect: Temperatures in hill stations like Shimla or Darjeeling are much lower than adjacent plains due to lapse rate; e.g., a rise of 1000 m reduces temperature by roughly 6.5°C.
- Sea-breeze cooling: During daytime coastal areas experience a sea breeze that lowers daytime temperatures compared to inland areas nearby.
- Temperature inversion in valleys: Cold air pooling overnight in a valley (e.g., some Himalayan valleys) creates fog and traps pollutants until sunlight disperses the inversion.
- Ocean currents: Western Europe is warmer than other regions at similar latitudes because of the warm North Atlantic Current.
- Desert heating: The Thar Desert has very high daytime temperatures and very large diurnal ranges because of low moisture and sparse vegetation.
- Daily mean temperature = (Tmax + Tmin) / 2
- Monthly mean temperature = average of daily mean temperatures for the month
- Annual mean temperature = (Sum of 12 monthly mean temperatures) / 12
- Diurnal temperature range = Tmax (day) - Tmin (day)
- Annual temperature range = Maximum monthly mean - Minimum monthly mean
- Approximate environmental lapse rate = 6.5°C per 1000 m (temperature decrease with increasing altitude)
Atmospheric Pressure and Winds
What is atmospheric pressure?
Atmospheric pressure is the force exerted by the weight of air above a unit area of the Earth's surface. Standard sea‑level pressure is about 1013.25 hPa (hectopascal) or 1013.25 mb (millibar). Pressure decreases with height.
Why does pressure vary?
- Temperature: Warm air expands and becomes less dense, producing lower surface pressure; cold air is denser and produces higher pressure.
- Altitude: Pressure falls roughly exponentially with height.
- Air mass movements: Convergence raises pressure aloft and divergence lowers it; horizontal differences create pressure gradients.
Pressure systems and belts
Large-scale horizontal patterns of pressure create pressure belts: the equatorial low (ITCZ), the subtropical highs (around 30°), the subpolar lows (around 60°) and the polar highs. These belts shift seasonally with the sun.
How winds are generated
Winds flow because of horizontal pressure differences. Air moves from high to low pressure due to the pressure gradient force. However, other forces modify this motion:
- Pressure gradient force (PGF): pushes air from high to low pressure; magnitude depends on how closely packed isobars are.
- Coriolis force: an apparent deflection due to Earth's rotation; to the right of motion in the Northern Hemisphere and to the left in the Southern Hemisphere. Its strength depends on latitude.
- Friction: near the surface friction reduces wind speed and alters direction so winds cross isobars toward low pressure.
Types of atmospheric winds
- Planetary (global) winds: Trade winds (NE and SE), subtropical westerlies, polar easterlies—these are produced by the global pressure belt system and Earth's rotation.
- Periodic/Seasonal winds: Monsoon winds—seasonal reversal (e.g., South Asian summer monsoon: southwest winds bring heavy rain because heating of the land creates a low pressure that draws moist ocean air).
- Local/diurnal winds: Sea breeze and land breeze, mountain (anabatic) and valley (katabatic) winds—caused by local temperature contrasts and topography.
- Storms and cyclones: Intense low pressure systems with strong converging winds; wind flow is counterclockwise around lows in the Northern Hemisphere and clockwise around highs.
Important consequences
Winds distribute heat and moisture, shape climates (e.g., trade winds create tropical rain belts), determine ocean currents, and influence weather events such as monsoons, cyclones, and local breezes.
How maps show pressure and winds
Isobars (lines of equal pressure) on weather maps show pressure patterns: close isobars mean strong pressure gradients and stronger winds; widely spaced isobars mean weak winds. Wind direction near the surface crosses isobars toward low pressure because of friction; aloft, winds tend to flow parallel to isobars (geostrophic flow).
Practical example (India): In summer the Thar desert heats up producing a thermal low; the resulting pressure gradient draws moist southwest monsoon winds from the Arabian Sea, causing heavy rainfall over the subcontinent.
- Sea breeze on a sunny coastline: daytime heating of land creates a low pressure over land; cooler air from the sea moves inland as a sea breeze.
- Land breeze at night: land cools faster than sea so cooler, denser air flows from land to sea.
- Mountain-valley winds: during day warm air rises up valley slopes (anabatic), at night cold air descends (katabatic).
- Monsoon in South Asia: summer low over heated land draws moist SW winds from the Indian Ocean causing seasonal rainfall.
- Tropical cyclone: intense low pressure over warm ocean causes strong inward-spiraling winds and heavy rain (e.g., cyclones in Bay of Bengal).
- Mistral and Santa Ana: strong, cold, downslope winds created by pressure differences and topography (Mistral in France, Santa Ana in California).
- Hydrostatic equilibrium: dp/dz = -ρ g (pressure decreases with height due to gravity)
- Ideal gas law (air): p = ρ R T (relates pressure p, density ρ, gas constant R, temperature T)
- Scale height / vertical pressure fall: p = p0 · exp(-z/H) where H = RT/g (H is the scale height)
- Pressure gradient force per unit mass: F_pg = -(1/ρ) ∇p
- Coriolis parameter: f = 2 Ω sin φ (Ω = 7.2921×10^-5 s^-1, φ = latitude)
- Geostrophic wind (vector form): V_g = (1/(f ρ)) k × ∇p (algebraic magnitude approx V_g ≈ (1/(f ρ)) · |Δp/Δn|)
Humidity, Condensation and Precipitation
Humidity is the amount of water vapour present in the air. Water vapour is an invisible but important atmospheric constituent that influences weather and climate.
Types and measures of humidity
- Absolute humidity: mass of water vapour per unit volume of air (g/m3). It varies with temperature and pressure.
- Specific humidity (q): mass of water vapour per unit mass of moist air (g/kg). It is conserved for a parcel of air unless moisture is added or removed.
- Mixing ratio (r): mass of water vapour per unit mass of dry air (g/kg). It is often used in atmospheric thermodynamics.
- Relative humidity (RH): percentage of actual vapour pressure to saturation vapour pressure at the same temperature. RH expresses how close the air is to saturation and depends on temperature.
- Saturation vapour pressure increases rapidly with temperature — warm air can hold much more water vapour than cold air.
- Dew point: the temperature to which air must be cooled at constant pressure for saturation (RH = 100%) to occur. It is a direct measure of actual moisture content.
Condensation occurs when air becomes saturated (RH = 100%) and excess water vapour changes to liquid water or ice. This happens when air is cooled to its dew point or when moisture is added. Condensation requires condensation nuclei (tiny particles like dust, salt, soot) on which vapour will condense. Observable forms of condensation include clouds, fog, dew and frost (if temperature is below freezing).
How condensation happens in the atmosphere
- Air parcel rises (forced uplift, convection, orographic lifting, frontal uplift) and expands and cools adiabatically.
- If cooling brings the parcel to its dew point, condensation begins and cloud droplets form on condensation nuclei.
- If enough condensation occurs and droplets grow, precipitation can form.
Precipitation is any form of water (liquid or solid) falling from the atmosphere to the ground. Key mechanisms of precipitation formation:
- Collision-coalescence process: In warm clouds (above freezing) larger droplets fall and collide/coalesce with smaller droplets to form raindrops. Common in tropical convective clouds.
- Bergeron-Findeisen (ice-crystal) process: In mixed-phase or cold clouds, ice crystals grow at the expense of supercooled water droplets because saturation vapour pressure over ice is lower than over liquid water. Ice crystals become heavy and fall as snow or melt into rain.
Types of precipitation (by mechanism)
- Convectional: Caused by surface heating and upward convection (e.g., afternoon thunderstorms over plains and urban areas).
- Orographic: Caused by moist air forced to ascend over mountains (heavy precipitation on windward slopes, rain shadow on leeward side).
- Frontal / Cyclonic: Associated with air-mass collisions along weather fronts in low-pressure systems (widespread rain or snow along frontal zones).
Forms of precipitation include rain, drizzle, snow, sleet, hail and graupel, depending on temperature profiles in the atmosphere and microphysical processes.
Key atmospheric lapse rates
- Dry adiabatic lapse rate (DALR): about 9.8 °C per km for unsaturated air.
- Saturated adiabatic lapse rate (SALR): variable (roughly 4–7 °C per km) because latent heat release during condensation reduces cooling rate.
Importance: Humidity and precipitation control human comfort, agriculture, water resources, soil moisture, cloud cover, storm development and many climate processes (monsoon dynamics, cyclones).
- Morning dew on grass: air near the ground cools overnight to its dew point causing condensation.
- Fog over river valleys: radiative cooling or advection cooling causes air to reach saturation and form a low cloud.
- Convective thunderstorms in summer over the Indo-Gangetic plains: strong surface heating causes rising moist air, condensation, and heavy showers.
- Orographic rainfall on the Western Ghats: moist Arabian Sea air ascends the ghats producing heavy rain on the windward slopes and a rain shadow to the east.
- Monsoon/cyclonic rain in India (frontal/cyclonic precipitation): large-scale uplift around low-pressure systems causes widespread precipitation.
- Hail during severe thunderstorms: strong updrafts carry ice particles repeatedly through freezing layers so they grow and fall as hail.
- Relative humidity (RH): RH = (actual vapour pressure / saturation vapour pressure) × 100%
- Mixing ratio (r): r = mass of water vapour / mass of dry air (commonly expressed in g/kg)
- Specific humidity (q): q = mass of water vapour / mass of moist air (g/kg)
- Tetens (approx.) saturation vapour pressure over water (T in °C): e_s(T) = 6.11 × 10^(7.5T / (237.3 + T)) in hPa
- Magnus-Tetens approximate dew point (Td) from T (°C) and RH (%): let a=17.27, b=237.7°C, γ = ln(RH/100) + aT/(b+T); then Td = (b × γ) / (a − γ)
- Dry adiabatic lapse rate (DALR): ≈ 9.8 °C per km (temperature decrease with ascent for unsaturated air)
Types and Mechanisms of Rainfall
Definition: Rainfall (precipitation) is the process by which condensed water vapor in the atmosphere falls to the earth in the form of drops. Rain forms when moist air rises, cools, becomes saturated and condensation produces cloud droplets that grow large enough to fall.
Basic physical mechanism (common steps):
- Uplift: Air is forced to rise by heating, topography, frontal encounters or convergence.
- Adiabatic cooling: Rising air expands and cools at the dry adiabatic lapse rate (≈ 9.8 °C/km) until saturation; after condensation it cools slower at the saturated adiabatic lapse rate (≈ 5–6 °C/km).
- Condensation and cloud formation: When air temperature reaches the dew point, water vapor condenses on condensation nuclei forming cloud droplets.
- Coalescence/ice processes: Droplets collide and coalesce (warm clouds) or ice processes grow hydrometeors (cold clouds) until they are heavy enough to fall as rain, snow or sleet.
Key atmospheric concepts: saturation vapour pressure (depends on temperature), relative humidity (RH), dew point, lifting condensation level (LCL), and lapse rates (DALR and SALR).
Main types of rainfall:
1. Convectional (Convective) Rainfall
Cause: Strong surface heating (solar radiation) warms near-surface air; the warm air becomes buoyant and rises. Typical in tropical latitudes and during hot afternoons.
Mechanism: Intense local heating → rapid vertical uplift → adiabatic cooling → condensation and towering cumulonimbus clouds → heavy, short-lived showers and thunderstorms.
Characteristics: Sudden, heavy showers, often with lightning and gusty winds; localized and short duration.
2. Orographic (Relief) Rainfall
Cause: Moist air is forced to ascend when it encounters mountain ranges.
Mechanism: Windward uplift → cooling → condensation → heavy precipitation on windward slopes. Air descends on the leeward side, warms and dries, creating a rain shadow.
Characteristics: Persistent rainfall on windward slopes; one side of range (leeward) much drier.
3. Frontal (Cyclonic) Rainfall
Cause: Interaction of two air masses of different temperature (a warm front meeting a cold front) associated with mid-latitude cyclones and disturbances.
Mechanism: Warm air is forced to rise over denser cold air along a front → gradual or steep ascent depending on front type → widespread cloudiness and prolonged precipitation (stratiform) or intense showers along cold fronts.
Characteristics: Widespread, often prolonged rainfall with associated cloud bands; in winter can produce snow in cold regions.
4. Convergent (Cyclonic/ITCZ) Rainfall
Cause: Air flows from different directions meet (converge) at a low-pressure area (e.g., ITCZ), forcing air upward.
Mechanism: Convergence → upward motion → cooling and condensation → persistent convective and stratiform precipitation over the convergence zone.
Characteristics: Important in equatorial regions (ITCZ) and monsoon troughs; produces heavy seasonal rains.
How these types apply to India (CBSE-relevant examples): Convectional — afternoon thunderstorms in central and peninsular India during pre-monsoon heat. Orographic — heavy rainfall on the windward side of the Western Ghats and Khasi-Jaintia Hills (Cherrapunji, Mawsynram); rain shadow east of the Ghats. Frontal/Cyclonic — western disturbances producing winter rain/snow in northwestern India and Himalaya. Convergent — monsoon trough and ITCZ drive large-scale monsoon rainfall over India.
Important practical notes: Cloud condensation nuclei (dust, sea salt) are necessary for droplet formation; temperature controls the amount of moisture the air can hold (warmer air → higher saturation vapour pressure → more moisture possible).
- Convectional: Afternoon thunderstorms (local heavy showers) in Delhi and Mumbai during hot pre-monsoon months.
- Orographic: Heavy windward rainfall on the Western Ghats; rain shadow causing dry Deccan Plateau on the leeward side.
- Frontal (Cyclonic): Western disturbances causing winter rain and snow over Punjab, Himachal Pradesh, and Jammu & Kashmir.
- Convergent: ITCZ and monsoon trough producing large-scale rainfall across India during the Southwest Monsoon.
- Relative humidity (RH): RH = (e / e_s) × 100%, where e = actual vapour pressure and e_s = saturation vapour pressure at temperature T.
- Approximate saturation vapour pressure (Magnus-Tetens): e_s(T) ≈ 6.112 × exp(17.62 × T / (243.12 + T)) in hPa (T in °C).
- Lifting Condensation Level (approximate): LCL ≈ 125 × (T - T_d) metres, where T is temperature (°C) and T_d is dew point (°C).
- Dry Adiabatic Lapse Rate (DALR): ≈ 9.8 °C/km; Saturated Adiabatic Lapse Rate (SALR): ≈ 5–6 °C/km (varies with moisture).
Factors Controlling Climate
Overview
Climate of any place is shaped by several interacting physical factors that control temperature, precipitation, humidity and wind patterns. These factors determine regional and local climate types and seasonal changes.
Main factors
- Latitude: Determines the angle of incoming solar radiation and day length. Areas near the equator receive more direct sunlight year-round → higher mean temperatures; polar regions receive low-angle sunlight → low temperatures.
- Altitude (Elevation): Temperature falls with height. Higher elevations are colder; mountains influence local climates and precipitation patterns (orographic effects).
- Pressure and Wind Systems: Large-scale pressure belts (Equatorial low, Subtropical highs, Subpolar lows) and prevailing winds (trade winds, westerlies) drive air mass movement, moisture transport and storm tracks.
- Ocean Currents: Warm currents raise coastal temperatures and increase moisture; cold currents cool coasts and can reduce precipitation. Currents redistribute heat globally and modulate coastal climates.
- Distance from the Sea (Continentality): Oceans moderate temperature because of high heat capacity. Coastal locations have smaller annual temperature ranges; interior (continental) areas show larger seasonal extremes.
- Topography (Relief): Mountain ranges force air to rise (windward) causing cooling and condensation (orographic rainfall); leeward sides are drier (rain-shadow effect). Valley and slope orientation (aspect) affect solar heating locally.
- Vegetation and Soil: Vegetation influences albedo, evapotranspiration and humidity. Forested regions tend to be cooler and moister; deserts (sparse vegetation) are hotter and drier.
- Human Activities: Urbanisation (urban heat island), deforestation, irrigation and greenhouse gas emissions alter local and global climates.
How these factors operate (mechanisms)
- Solar angle and day length (latitude) control incoming solar energy. Lower angle spreads energy over larger area → lower heating.
- Air cools as it rises (expansion) — lapse rates determine rate of cooling with height, influencing mountain climates and cloud formation.
- Warm ocean currents add heat and moisture to overlying air, promoting milder winters and increased precipitation; cold currents stabilize the lower atmosphere and reduce rainfall.
- Large-scale pressure systems set prevailing wind directions; winds transport heat and moisture between regions (e.g., monsoon circulation transporting moisture inland).
Interdependence: Factors rarely act alone. Example: a coastal mountain at mid-latitude may receive heavy orographic rainfall because prevailing moist winds (wind systems + ocean moisture) hit the windward slopes (topography), while altitude and latitude govern temperature.
Summary: Latitude, altitude, pressure/winds, ocean currents, continentality, topography, vegetation and human actions together determine the climate observed at a place. Understanding their combined influence explains spatial climate patterns and seasonal variability.
- Latitude: Equatorial regions (Amazon Basin) are hot and wet year‑round; polar regions (Siberia) remain very cold.
- Altitude: Shimla (≈2200 m) is much cooler than nearby plains like Chandigarh at the same latitude; temperature drops with height.
- Ocean currents: The Gulf Stream keeps northwestern Europe (e.g., UK, Norway coasts) milder in winter than other locations at similar latitudes; the cold Humboldt Current cools Peru’s coast and contributes to aridity (Atacama Desert).
- Continentality: Mumbai (coastal) has moderate seasonal range; Delhi (inland) shows hotter summers and colder winters.
- Topography (orographic effect): Western Ghats receive heavy rain on windward side during SW monsoon (e.g., Munnar); the leeward Deccan plateau lies in a rain shadow and receives much less rainfall.
- Aspect: In the Northern Hemisphere, south-facing slopes (sunny aspect) are warmer and drier than north-facing slopes at same altitude.
- Approximate solar insolation on a horizontal surface: I = S0 × cos(Z) (S0 ≈ 1361 W/m² is the solar constant; Z = solar zenith angle).
- Zenith angle relation (useful concept): cos(Z) = sin(φ)·sin(δ) + cos(φ)·cos(δ)·cos(H) (φ = latitude, δ = solar declination, H = hour angle).
- Environmental lapse rate (typical average): ≈ 6.5 °C per 1000 m (temperature decreases with elevation).
- Dry adiabatic lapse rate: ≈ 9.8 °C per 1000 m; Moist adiabatic lapse rate: ≈ 5–7 °C per 1000 m (varies with moisture).
- Simple pressure gradient (conceptual): Pressure gradient ≈ ΔP / Δx. Larger gradients → stronger winds (force proportional to ΔP/Δx).
- Stefan–Boltzmann (for blackbody radiation, climate energy balance concept): E = σT^4 (σ = 5.67×10⁻⁸ W·m⁻²·K⁻⁴).
Global Distribution of Temperature and Precipitation
Temperature and precipitation are the two main climatic elements that determine climate zones and ecosystems. Their global distribution is controlled by a combination of astronomical, geographic and atmospheric factors. Below is a concise explanation of the main controls and typical global patterns.
- Primary controls on temperature
- Latitude: Incoming solar radiation falls most directly at the equator and at a slant toward the poles. Lower latitudes receive more energy year-round and have higher mean temperatures; higher latitudes receive less and are colder.
- Angle of incidence and day length: Seasonal change in day length and solar angle (due to Earth's axial tilt) produces strong seasonal temperature differences, especially at mid and high latitudes.
- Altitude: Temperature generally decreases with height. The average environmental lapse rate is about 6.5°C per 1000 m.
- Continentality and oceanic influence: Oceans moderate temperature (smaller annual range, milder winters) while large landmasses heat and cool faster (larger annual range).
- Ocean currents: Warm currents (e.g., Gulf Stream) raise coastal temperatures; cold currents (e.g., Peru/ Humboldt Current) cool them.
- Cloud cover and albedo: Clouds reduce daytime heating and trap longwave radiation at night; surface albedo (ice, snow, deserts) affects how much solar energy is absorbed.
- Atmospheric circulation: Prevailing winds and pressure belts redistribute heat (westerlies, trade winds, polar easterlies).
- Typical temperature patterns
- Latitudinal gradient: Mean annual temperature generally decreases from equator to poles.
- Isotherms (lines of equal temperature) are roughly parallel to parallels but are deflected by continentality, ocean currents and altitude.
- Seasonality: Tropics show small annual temperature range; mid-latitudes show large seasonal swings; polar regions remain cold year-round.
- Primary controls on precipitation
- Atmospheric circulation and pressure belts: Rising air at the equator (Intertropical Convergence Zone, ITCZ) produces heavy rainfall; sinking air in subtropical highs (~30°) creates deserts; mid-latitude westerlies and fronts produce variable precipitation in temperate zones.
- Convection: Strong heating (equatorial and tropical landmasses) produces convective thunderstorms and heavy short-term rainfall.
- Orographic uplift: Moist air forced over mountains cools and condenses on windward slopes, producing heavy rainfall; the leeward side lies in a rain shadow and is dry.
- Monsoons and seasonal shifts: Large land-sea temperature contrasts (e.g., South Asia) cause seasonal reversal of winds and heavy seasonal rainfall during the wet monsoon months.
- Tropical cyclones and storms: Hurricanes/typhoons bring intense rainfall in their paths.
- Ocean currents: Cold currents reduce coastal evaporation and precipitation (e.g., west coasts of continents), while warm currents increase moisture availability.
- Typical precipitation patterns
- Equatorial belt (ITCZ): very high annual rainfall (Amazon, Congo, Indonesia) produced by convection and persistent convergence.
- Subtropical belts (~20–30°): persistent high pressure and descending air produce major deserts (Sahara, Arabian, Australian deserts).
- Mid-latitudes: variable precipitation from westerly winds and cyclones; western margins of continents at these latitudes often wetter (e.g., western Europe).
- Orographic rainfall: windward mountain slopes are wet (e.g., western Ghats, windward side of the Andes), leeward sides are dry (rain shadows such as the Atacama's eastern rain shadow of the Andes or the Great Basin behind Sierra Nevada).
- Polar regions: low absolute precipitation (polar deserts) because cold air holds little moisture.
Interaction and regional climates: The combination of these temperature and precipitation controls creates the world's climatic regions: humid tropical, tropical monsoon and savanna, arid and semi-arid deserts/steppes, Mediterranean, temperate maritime, temperate continental, and polar/alpine climates.
Summary: Global temperature distribution is mainly a function of latitude, altitude, continentality and ocean currents. Precipitation distribution is governed by atmospheric circulation (ITCZ, subtropical highs, westerlies), orography, oceanic moisture supply, and seasonal wind reversals (monsoons). Together these patterns explain why some places are hot and wet, others hot and dry, and some cold and dry.
- Amazon Basin: Equatorial region with high year-round rainfall and small temperature range due to strong convection and persistent ITCZ influence.
- Sahara Desert: Subtropical high-pressure belt and descending air produce arid conditions around 20–30°N.
- Mawsynram and Cherrapunji (Northeast India): Extreme orographic rainfall caused by moist southwest monsoon winds rising against the Khasi hills.
- Western Europe (UK, Norway): Mild winters and ample precipitation due to prevailing westerlies and the warming Gulf Stream/North Atlantic Drift.
- Atacama Desert (Chile): Extremely dry because of cold Peru (Humboldt) Current, subtropical high, and rain shadow from the Andes.
- Siberia: Strong continentality yields very cold winters and large annual temperature range.
- Solar irradiance on a horizontal surface: S = S0 × cos θ, where S0 ≈ 1361 W/m² is the solar constant and θ is the solar zenith angle (angle between sun direction and normal to surface).
- Approximate environmental lapse rate (average): ΔT ≈ −6.5°C per 1000 m (temperature decrease with altitude).
- Mean annual temperature: T_mean = (Σ monthly mean temperatures) / 12.
- Relative humidity: RH (%) = (actual vapor pressure / saturation vapor pressure) × 100.
- Clausius–Clapeyron rule (practical statement): Saturation vapor pressure (and therefore potential water-holding capacity of air) increases by about 6–7% per °C rise in temperature.
- Stefan–Boltzmann law (radiative emission): E = σT⁴, where σ = 5.67×10⁻⁸ W m⁻² K⁻⁴ and T is absolute temperature in kelvin (useful for global energy balance concepts).
Atmospheric Circulation and Pressure Belts
Overview: Atmospheric circulation is the large‑scale movement of air that redistributes heat and moisture around the Earth. It results from unequal solar heating between the equator and the poles and is modified by the Earth's rotation. The result is a system of pressure belts and prevailing wind systems that determine global climates.
Why it forms:
- Unequal heating: The equator receives more solar energy than the poles. Warm air near the equator rises, creating low pressure; cold air near the poles sinks, creating high pressure.
- Pressure gradient force (PGF): Air moves from high to low pressure. The PGF initiates wind.
- Coriolis effect (Earth's rotation): Moving air is deflected to the right in the Northern Hemisphere and to the left in the Southern Hemisphere, altering straight PGF flow into curved wind patterns.
- Friction and continental effects: Near-surface friction with land/ocean and local heating/cooling modify wind speed and direction.
The three-cell model (idealized):
- Hadley Cell (0°–30° each hemisphere): Sunlit equator heats air, which rises at the Intertropical Convergence Zone (ITCZ). Aloft air flows poleward, cools and descends near ~30° creating the subtropical highs (horse latitudes). Surface flow returns equatorward as the trade winds (NE trades in the Northern Hemisphere; SE trades in the Southern Hemisphere).
- Ferrel Cell (30°–60°): A mid-latitude, indirect cell where surface winds (westerlies) flow poleward and eastward. Air rises near ~60° (subpolar lows) and sinks at ~30°.
- Polar Cell (60°–90°): Cold dense air sinks at the poles (polar highs) and flows equatorward near the surface as polar easterlies; converges and rises near ~60° at the polar front.
Major pressure belts and latitude positions (approximate):
- Equatorial Low / ITCZ (0°): Low pressure, rising air, heavy convective rainfall — doldrums.
- Subtropical Highs (~30° N/S): High pressure, descending dry air — source regions of deserts.
- Subpolar Lows (~60° N/S): Low pressure, rising air — storm tracks and precipitation.
- Polar Highs (~90° N/S): High pressure, cold sinking air — very cold and dry conditions.
Surface wind systems:
- Trade winds: NE trades (N. Hemisphere) and SE trades (S. Hemisphere) blow from subtropical highs to the equator.
- Westerlies: Prevailing winds in mid-latitudes blowing from SW (N. Hemisphere) or NW (S. Hemisphere) toward poles.
- Polar easterlies: Cold winds blowing from polar highs toward subpolar lows.
Seasonal shifts: The pressure belts and the ITCZ migrate north and south with the Sun’s declination. This seasonal migration is crucial for monsoon development (e.g., South Asian monsoon when the ITCZ shifts north in boreal summer).
Implications:
- Deserts at ~30° latitude (Sahara, Arabian, Australian deserts, Kalahari) are linked to descending dry air in subtropical highs.
- Equatorial rainforests (Amazon, Congo, Indonesia) correspond to persistent low pressure and convective rainfall at the ITCZ.
- Storm tracks and temperate climates in mid-latitudes are associated with westerlies and the subpolar low region.
Limitations: The three-cell model is an idealization. Real circulation is affected by continents, oceans, mountain ranges, seasonal heating, and transient weather systems (jet streams, cyclones).
- Sahara and Arabian deserts: Located near 30°N under the subtropical high-pressure belt where descending dry air inhibits rainfall.
- Amazon and Congo rainforests: Located around the ITCZ (equatorial low) where warm moist air rises, producing heavy convectional rainfall.
- South Asian monsoon: Seasonal northward migration of the ITCZ and thermal low over the Asian landmass draws moist southwesterly trade winds bringing heavy summer rainfall to India.
- Trade wind sailing routes: Historically, sailing ships used steady NE and SE trade winds; doldrums near the ITCZ were regions of calm that could stall ships.
- Coriolis parameter: f = 2 Ω sin φ (Ω = angular velocity of Earth ≈ 7.2921 × 10^−5 s^−1; φ = latitude)
- Coriolis acceleration (magnitude): a_c = 2 Ω v sin φ (v = speed of the moving parcel)
- Pressure-gradient force per unit mass: F_PG = - (1/ρ) (∂p/∂n) (ρ = air density, ∂p/∂n = pressure gradient normal to flow)
- Geostrophic wind (balanced PGF and Coriolis): V_g ≈ (1 / (ρ f)) × (Δp / Δn) (useful estimate where friction is small and flow is steady)
- Hydrostatic equilibrium (vertical balance): dp/dz = -ρ g (g = acceleration due to gravity)
Monsoons and Seasonal Reversals
Definition: Monsoons are seasonal reversals in the large-scale wind circulation caused primarily by differential heating of land and sea, migration of the Inter Tropical Convergence Zone (ITCZ), and planetary rotation. In practice, `monsoon` usually refers to the wet summer winds (e.g., the southwest monsoon in South Asia) and the complementary dry winter winds.
Basic mechanism (stepwise):
- Solar heating changes seasonally. In summer the land heats faster than the adjacent ocean. This produces a low pressure (thermal low) over the continent and relatively higher pressure over the sea.
- A pressure gradient develops from ocean to land. Air flows toward the low; over tropical oceans this air is moist, so onshore winds carry moisture inland.
- Earth's rotation (Coriolis effect) deflects these winds: in the Northern Hemisphere the inflow is turned to produce the southwest (southwesterly) monsoon; in the Southern Hemisphere winds are deflected oppositely.
- The ITCZ (belt of low pressure and convective activity) migrates north in summer and south in winter; monsoonal circulation shifts with it, producing seasonal rainfall belts.
- Upper-air features (subtropical jet, tropical easterly jet, and upper-air anticyclones) and sea surface temperatures (including ENSO) modulate strength, onset, and distribution.
Indian subcontinent — typical seasonal reversal:
- Summer (approx. June–September): Strong thermal low over northwestern India and the Tibetan plateau/land mass draws moist southwesterly winds from the Arabian Sea and Bay of Bengal. Moist air rising over windward slopes (Western Ghats, Himalayas) yields heavy rainfall. The monsoon trough and depressions/cyclones in the Bay of Bengal intensify rains over northeastern India and the Gangetic plains.
- Winter (approx. October–March): Continental land becomes colder than the ocean producing high pressure over the interior. Winds reverse to offshore northeasterlies (the northeast monsoon), bringing dry conditions to much of northern India but moisture and rainfall to southeast India and Sri Lanka (Tamil Nadu coasts) from the Bay of Bengal.
Important modifiers:
- Orography: Mountains force moist air to rise producing orographic rainfall on windward slopes and rain shadow on leeward slopes (e.g., Western Ghats vs Deccan Plateau).
- Sea-surface temperatures & ENSO: El Niño typically weakens the Indian summer monsoon; La Niña often strengthens it, though relationships are statistical not deterministic.
- Active and break phases: The monsoon does not bring continuous rain. Active phases (frequent depressions and low-pressure systems) cause heavy widespread rain; breaks bring reduced rainfall and dry spells.
Consequences: Large seasonal water supply for agriculture, flooding, soil replenishment, but also droughts, floods and socio-economic vulnerability when monsoon variability is large.
- Indian summer (southwest) monsoon: Moist winds from the Arabian Sea and Bay of Bengal bring most of India’s annual rainfall between June and September; Kerala onset typically in early June.
- Northeast monsoon: After October the wind reverses; southeast Tamil Nadu and Puducherry get significant October–December rainfall from moisture over the Bay of Bengal.
- Orographic contrast: Heavy rainfall on the windward Western Ghats and the Meghalaya plateau (Cherrapunji, Mawsynram) vs dry rain-shadow on the Deccan Plateau (parts of Maharashtra and Karnataka).
- Pre-monsoon Loo winds: Hot, dry westerly winds over northwest India in May; these are symptomatic of strong land heating before monsoon onset.
- ENSO impact: Many El Niño years (e.g., 2009) saw deficient Indian monsoon rainfall and drought-like conditions, while some La Niña years (e.g., 1999 associated with a strong monsoon) saw excess rainfall and flooding.
- Coriolis parameter: f = 2Ω sin φ (Ω = 7.2921 × 10^-5 s^-1; φ = latitude). f measures the strength of Coriolis acceleration at a latitude.
- Geostrophic wind (approximation for large-scale flow): Vg = (1/(ρ f)) × (∂p/∂n) (Vg is speed parallel to isobars, ρ is air density, ∂p/∂n is the cross-isobar pressure gradient).
- Pressure‑gradient force per unit mass: F = -(1/ρ) ∇p (force directed from high to low pressure).
- Clausius–Clapeyron rule (practical statement): saturation vapor pressure rises by ~7% per 1 °C increase in temperature — explains why warmer air can carry more moisture and intensify rainfall potential.
Indian Monsoon: Features and Variability
Overview: The Indian Monsoon is a seasonal reversal of winds accompanied by distinct wet (southwest/summer) and dry (northeast/winter) seasons. It is the chief controller of India’s climate and agricultural calendar. The southwest (SW) monsoon (June–September) supplies about 75% of India’s annual rainfall; the northeast (NE) or retreating monsoon (October–December) brings rain to southeast India and Tamil Nadu.
Main features:
- Seasonality: Two principal seasons — SW monsoon (summer; main rainy season) and NE monsoon (winter; regional rainfall in SE India).
- Onset and withdrawal: SW monsoon normally advances over Kerala around 1 June (onset) and retreats from northwest India by late September. Withdrawal from southern peninsular India happens during October.
- Branches: Arabian Sea branch (moves north-west along western coast; heavy rainfall on Western Ghats) and Bay of Bengal branch (moves northward then westward along the monsoon trough; brings rain to northeastern India, north India and induces rainfall over the Ganges plain).
- Wind reversal and pressure pattern: Driven by seasonal thermal contrast — low pressure over the heated Asian landmass and relative high over the Indian Ocean. This sets up cross-equatorial flow and the Somali Jet that carries moisture.
- Orographic effects: Western Ghats, Himalayas and other uplands force moist winds to rise producing heavy orographic rainfall on windward slopes and rain-shadow regions on leeward sides.
- Active and break spells: Within the monsoon season there are alternating active (heavy rainfall) and break (reduced rainfall) periods, typically governed by intraseasonal oscillations.
Variability — types and causes:
- Spatial variability: Rainfall varies greatly across India — very heavy in the northeastern hills and windward Western Ghats, low in the Thar Desert and parts of peninsula (rain-shadow).
- Temporal variability: Includes intra-seasonal (days to weeks), inter-annual (year-to-year) and long-term trends.
- Intra-seasonal variability: Active/break cycles (30–60 day oscillations) related to the Madden–Julian Oscillation (MJO) and northward/southward oscillation of the monsoon trough.
- Inter-annual variability: Strongly modulated by global factors — El Niño (tends to reduce Indian monsoon rainfall) and La Niña (often enhances it). Indian Ocean Dipole (IOD) and sea surface temperature (SST) anomalies in the Indian Ocean also affect the monsoon. The frequency and location of depressions and cyclonic systems over the Bay of Bengal influence year-to-year distribution.
- Other influences: Eurasian snow cover, Himalayan winter precipitation and Western Disturbances, local land-use change, and Himalayan orography can modify monsoon intensity and distribution.
Impacts: Variability of the monsoon affects agriculture, water resources, hydroelectric power, and the economy. Excess monsoon causes floods and landslides (e.g., heavy rainfall in Himalayan catchments); deficient monsoon causes droughts, crop failures and water stress.
Monitoring and forecasting: The India Meteorological Department (IMD) issues seasonal outlooks, weekly bulletins and daily forecasts using global and regional climate models, observational networks (radiosondes, satellites, buoys), and indices like Niño 3.4, IOD, and MJO phase.
Key points for students:
- Remember the two branches (Arabian Sea and Bay of Bengal) and why Western Ghats get heavy rainfall.
- Understand active/break spells as part of intraseasonal variability and ENSO/IOD as drivers of inter-annual variability.
- Link monsoon variability to real socio-economic outcomes — agricultural output, floods and droughts.
- 2018 Kerala floods — an extreme monsoon rainfall event caused by persistent heavy rainfall, poor drainage and saturated catchments (illustrates extreme excess rainfall and orographic runoff in Western Ghats).
- 2013 Uttarakhand floods — intense cloudbursts and heavy monsoon rains in Himalayan catchments led to flash floods and landslides (illustrates vulnerability of mountain regions to concentrated rainfall).
- 2015 Chennai floods — unusually heavy northeast monsoon/late-season rainfall produced urban flooding in Tamil Nadu (shows importance of NE monsoon for southeast India and role of urban drainage).
- Drought years associated with El Niño (e.g., notable droughts in some El Niño years) — demonstrate inter-annual variability where large-scale Pacific SST anomalies reduce monsoon rainfall over India.
- Percentage departure (departure from normal rainfall) = ((Actual rainfall − Normal rainfall) / Normal rainfall) × 100
- Coefficient of variation (CV) for rainfall = (Standard deviation of rainfall / Mean rainfall) × 100 — useful to measure spatial or temporal variability
- Seasonal or annual mean rainfall = (Sum of monthly rainfall for the season or year) / (Number of months) — basic aggregation used in climatology
Cyclones and Western Disturbances
Cyclones: Tropical cyclones are intense low-pressure systems that form over warm ocean waters and are characterized by strong rotating winds, heavy rain and a well-defined structure (eye, eye‑wall, rainbands). Formation requires (1) sea surface temperature >~26–27 °C, (2) sufficient Coriolis force to provide rotation (hence they form away from the equator), (3) low vertical wind shear, and (4) pre-existing low-level disturbance. Convection (thunderstorms) around the surface low leads to latent heat release; warming aloft lowers central pressure and intensifies inflow and rotation, producing the mature cyclone.
Structure: eye (calm, lowest pressure), eye‑wall (maximum winds and heaviest rain), spiral rainbands (outer convection). Cyclones are warm‑core systems and derive energy from latent heat of condensation.
Characteristics & lifecycle: disturbance → depression → deep depression → cyclonic storm → severe/very severe cyclone → landfall/dissipation. Over land the cyclone weakens rapidly due to loss of heat/moisture source and increased friction.
Impacts: high winds (structural damage), heavy rainfall (river flooding, landslides), storm surge (coastal inundation), salty inundation of farmland, disruption of transport and power. Preparedness (forecasting, evacuation, shelters) reduces casualties.
Seasonality & regional pattern (India): two main seasons — pre-monsoon (April–June) and post-monsoon (October–December). Bay of Bengal produces more and generally more intense cyclones than the Arabian Sea. Typical tracks differ: Bay cyclones often move northwest/north/northeast, affecting eastern India, Bangladesh and Myanmar; Arabian Sea cyclones can affect western India, Gujarat and the Arabian Peninsula.
Western Disturbances: Extratropical cyclonic storms originating over the Mediterranean Sea and Caspian/Black Sea region that move eastwards with the mid-latitude westerly flow (jet stream). They reach north‑west India mainly during winter (December–February) and bring cloudiness, moderate to heavy rainfall over plains and snowfall in the Himalayas.
Mechanism: an upper‑level trough or shortwave in the westerly jet induces surface cyclonic circulation; moisture picked up over the Mediterranean, Caspian or Arabian Sea and orographic uplift over the Himalayas leads to precipitation. Western disturbances are essential for winter precipitation and for replenishing soil moisture for rabi crops; they can also cause cold waves and fog in north India.
Interactions: Western disturbances interact with the subtropical westerly jet; blocking or slow movement can produce prolonged rain/snow. Sometimes a western disturbance may combine with local convective activity to enhance precipitation.
Forecasting & Observation: synoptic charts (isobars), satellite imagery (infrared, water vapour), Doppler weather radars, buoy and ship observations, and numerical weather prediction models are used to track and predict cyclones and western disturbances. Early warning systems and cyclone shelters have reduced fatalities in India in recent decades.
- Cyclone Fani (2019) — severe cyclone that struck Odisha and affected eastern India with high winds and storm surge.
- Cyclone Amphan (2020) — intense cyclone that impacted West Bengal and Bangladesh, causing large storm surge and coastal damage.
- 1999 Odisha Super Cyclone — a very severe cyclone with catastrophic damage and high fatalities; highlighted need for improved warning and evacuation.
- Cyclone Phailin (2013) — intensive cyclone where timely evacuation significantly reduced loss of life.
- Western Disturbance causing winter rains and snowfall — recurring phenomenon responsible for December–February snowfall in the western Himalaya and winter rains over Punjab, Haryana and Delhi (supports rabi crops and groundwater recharge).
- Coriolis parameter: f = 2 Ω sin φ, where Ω = 7.2921 × 10⁻⁵ s⁻¹ (Earth's angular velocity) and φ is latitude. This determines the magnitude of Coriolis force that turns winds.
- Pressure‑gradient force (per unit mass): F_pg = -(1/ρ) ∇p, where ρ is air density and ∇p is the pressure gradient; this force accelerates air from high to low pressure.
- Approximate geostrophic balance (useful for large‑scale winds away from the surface): V_g ≈ (1/(ρ f)) × (Δp/Δn), i.e., geostrophic wind is proportional to horizontal pressure gradient divided by Coriolis parameter (Δn is distance normal to isobars).
- IMD (India Meteorological Department) classification (surface wind speed): - Depression: 31–49 km/h (17–27 knots) - Deep Depression: 50–61 km/h (28–33 knots) - Cyclonic Storm: 62–88 km/h (34–47 knots) - Severe Cyclonic Storm: 89–117 km/h (48–63 knots) - Very Severe Cyclonic Storm: 118–165 km/h (64–89 knots) - Extremely Severe Cyclonic Storm: 166–220 km/h (90–119 knots) - Super Cyclonic Storm: ≥221 km/h (≥120 knots) (These ranges are used operationally to categorise intensity.)
Köppen's Climate Classification
Overview
Köppen's Climate Classification (developed by Wladimir Köppen) is a widely used system that classifies world climates primarily on the basis of annual and monthly averages of temperature and precipitation, and the seasonality of precipitation. It was designed to reflect the distribution of natural vegetation.
Structure of the system
The system groups climates by a letter code: one capital letter (major group), one lowercase letter (precipitation pattern), and sometimes a third lowercase letter (temperature). The five major groups are:
- A – Tropical (all months mean ≥ 18°C)
- B – Dry (arid & semi-arid; defined by precipitation insufficient relative to temperature)
- C – Temperate / Mesothermal (warm temperate; coldest month between ≈ −3°C and 18°C; warmest >10°C)
- D – Continental / Microthermal (coldest month < −3°C; warmest >10°C)
- E – Polar (warmest month < 10°C)
Second letter (precipitation)
A, C, D groups use: f = no dry season, w = dry winter, s = dry summer; A also uses m = monsoon. B uses W = desert and S = steppe.
Third letter (temperature)
For B: h = hot (mean annual T ≥ 18°C), k = cold (mean annual T < 18°C). For C and D: a = hot summer (warmest month ≥ 22°C), b = warm summer (warmest <22°C and ≥ four months >10°C), c = short/cool summer (<4 months >10°C), and some versions use d for extremely cold winters (in D climates).
How to classify a location (stepwise)
- Compute mean monthly and mean annual temperature and total annual precipitation (P).
- If warmest month < 10°C → Group E (Polar); else if coldest month ≥ 18°C → Group A (Tropical).
- If neither A nor E, test dryness (Group B) using the Köppen aridity threshold formula (see formulas below).
- If not B, separate C and D by coldest month: C if coldest month >= about −3°C (some versions use 0°C), D if colder.
- Assign precipitation letter (f/w/s/m) from monthly precipitation pattern and assign temperature letter (a/b/c/d) from summer/winter temperature rules.
Notes and variants
Textbooks sometimes use 0°C instead of −3°C as the boundary between C and D climates; mention this when comparing sources. The system is empirical and intended to match vegetation zones.
- Af: Amazon Basin (e.g., Manaus, Brazil) — Tropical rainforest: all months ≥ 18°C and no dry season.
- Aw: Nairobi, Kenya — Tropical savanna/monsoon: high temperatures year-round with a distinct dry season.
- BWh: Sahara Desert (e.g., El Obeid, Sudan; Phoenix, USA) — Hot desert: very low annual precipitation well below the aridity threshold; mean annual T ≥ 18°C.
- BSk: Mongolian steppe — Cold semi-arid: precipitation between 50% and 100% of the aridity threshold and mean annual T < 18°C.
- Csa: Mediterranean (e.g., Rome, Italy; Athens, Greece) — Hot-summer Mediterranean: dry summers and wet winters with hot summers (warmest month ≥ 22°C).
- Cfb: Western Europe (e.g., London, UK) — Temperate oceanic: no dry season, warmest month < 22°C but at least four months > 10°C.
- Köppen aridity threshold for Group B (precipitation threshold P_th, in mm): P_th = 20 × T_ann + S, where T_ann = mean annual temperature (°C) and S is an adjustment based on seasonal distribution of precipitation:
- S = 280 if ≥70% of annual precipitation falls in the high-sun (summer) half of the year; S = 0 if ≥70% falls in the low-sun (winter) half; S = 140 otherwise.
- Classification rule for B climates: if annual precipitation P < 0.5 × P_th → BW (desert); if 0.5 × P_th ≤ P < P_th → BS (steppe). Then add h (hot, mean annual T ≥ 18°C) or k (cold, mean annual T < 18°C).
- Temperature boundaries (commonly used): A: coldest month ≥ 18°C; C: coldest month between ≈ −3°C and 18°C; D: coldest month < −3°C; E: warmest month < 10°C. (Note: some references use 0°C instead of −3°C for the C/D boundary.)
- Third-letter rules for C/D: a = warmest month ≥ 22°C; b = warmest month < 22°C but ≥4 months >10°C; c = <4 months >10°C; d = very cold winters (used in some versions of D).
Climatic Regions of the World (Brief)
Overview
The world's climates are grouped into major regions based on long‑term patterns of temperature and precipitation and their seasonality. The most widely used system is the Köppen classification, which links climate to vegetation. Major classes are Tropical (A), Dry (B), Mild Mid‑Latitude/Temperate (C), Severe Mid‑Latitude/Continental (D), Polar (E) and Highland (H). Each class is subdivided by rainfall pattern and temperature.
Main climatic regions — brief characteristics
- Tropical (A): Constant high temperatures (monthly mean > 18°C). Subtypes: Af (tropical rainforest — year‑round heavy rain), Am (tropical monsoon — short dry season), Aw/As (tropical savanna — distinct wet and dry seasons). Vegetation: rainforests, grasslands with scattered trees.
- Dry (B): Potential evaporation exceeds precipitation. Includes deserts (BW) and steppes (BS); further divided into hot (h) and cold (k) types. Sparse vegetation, xerophytes.
- Temperate / Mild Mid‑Latitude (C): Mild winters (coldest month 0 to 18°C). Includes Mediterranean (Csa/Csb — dry summers, wet winters), Humid subtropical (Cfa — hot, humid summers, mild winters), and Marine west coast (Cfb/Cfc — cool summers, year‑round rain).
- Continental / Severe Mid‑Latitude (D): Large annual temperature range; cold winters (coldest month < 0°C). Subtypes: humid continental (warm summers) and subarctic (very cold winters). Forests (taiga), grasslands in some regions.
- Polar (E): All months have mean < 10°C. ET (tundra) with short cool summers; EF (ice cap) where temperature always < 0°C. Sparse or no vegetation.
- Highland (H): Climate modified by altitude; local variations produce cold, temperate or even tropical conditions over short distances (e.g., Andes, Himalaya).
Causes of regional climates
Latitude (solar angle), general atmospheric circulation (Hadley, Ferrel, Polar cells), prevailing winds, ocean currents, continentality (distance from sea), altitude, and local factors (mountains, rain shadows, vegetation).
Köppen system — practical note
Köppen groups climates by temperature and precipitation thresholds tied to natural vegetation. It is practical for mapping and comparing world climates.
How to identify a Dry (B) climate — practical test
Calculate a precipitation threshold (Pth) from mean annual temperature T (°C) and the seasonal distribution of rainfall. If annual precipitation P < Pth the climate is dry (B). If P < 0.5·Pth it is desert (BW); if 0.5·Pth ≤ P < Pth it is steppe (BS). (See formulas below.)
Typical vegetation and human impacts
Vegetation follows climate: rainforests in Af, savannas in Aw, grasslands in BS, temperate forests in C, taiga in D, tundra in ET. Human activities (irrigation, deforestation, urbanization) can modify local climates and vegetation, e.g., irrigation turning steppe into cropland; urban heat islands raising local temperatures.
Use in real life
Climate region maps guide agriculture (crop choices, sowing/harvest periods), water management, urban planning, biodiversity conservation and tourism (e.g., Mediterranean climates attract seasonal tourism).
- Tropical rainforest (Af): Amazon Basin (Brazil), Congo Basin (Central Africa), Singapore — high, year‑round rainfall; evergreen forest.
- Tropical monsoon (Am): Mumbai (India) — heavy summer monsoon rains, short dry season.
- Tropical savanna (Aw): Nairobi (Kenya), parts of northern Australia — distinct wet and dry seasons; grassland with scattered trees.
- Hot desert (BWh): Sahara (North Africa), Arabian Desert — very low annual precipitation, high evaporation.
- Cold desert/steppe (BWk/BSk): Central Asia (Gobi), parts of Patagonia — cold winters, low precipitation.
- Mediterranean (Csa/Csb): Rome (Italy), coastal California (Los Angeles) — dry hot summers, wet winters; olive and grape cultivation.
- Köppen dry threshold (to test for B climates): Pth (mm) = 20 × T (°C) + adjustment, where adjustment = 280 if ≥70% of annual precipitation falls in the high‑sun half of the year; adjustment = 140 if 30–70% falls in the high‑sun half; adjustment = 0 if <30% falls in the high‑sun half. If annual precipitation P < Pth then climate = B (dry). If P < 0.5·Pth → desert (BW); if 0.5·Pth ≤ P < Pth → steppe (BS).
- Environmental lapse rate (approximate effect of altitude): ΔT ≈ −6.5°C per 1000 m (mean tropospheric lapse rate). Useful for estimating how temperature changes with elevation.
- Dry adiabatic lapse rate: 10°C per 1000 m (for unsaturated air).
- Moist (saturated) adiabatic lapse rate: ~5–6°C per 1000 m (varies with moisture).
- Thornthwaite potential evapotranspiration (monthly, optional/advanced): PET = 16 × (10 × Tm / I)^a where Tm = mean monthly temperature (°C, positive values), I = sum of monthly heat indices i = (Tm/5)^1.514 over 12 months, and a = 0.49239 + 0.000000675·I^3 − 0.0000771·I^2 + 0.01792·I (approximation). (Used in water‑balance studies.)
Climate of India (Summary)
Overview
India's climate is broadly tropical monsoon in nature, showing strong seasonal reversal of winds and large spatial contrasts in temperature and rainfall. The Indian climate is dominated by the southwest (summer) monsoon which provides most of the annual rainfall and shapes agricultural and socio-economic life.
Main seasons
1. Cold season (winter) — December to February: dry, cool weather; northern plains experience frost and fog; Himalayan region gets snowfall.
2. Hot season (pre-monsoon/summer) — March to May: rising temperatures, heat waves, convectional thunderstorms, western disturbances affect NW India.
3. Southwest monsoon (rainy) — June to September: onset over Kerala around 1 June and progressive advance to northwestern India by mid-June to July; brings 70–80% of annual rainfall.
4. Retreating (northeast) monsoon — October to November: withdrawal of SW monsoon and heavy rainfall over Tamil Nadu and adjoining regions from NE winds.
Factors controlling climate
- Latitude: tropical to subtropical range, sun's zenith shift causes seasonal heating.
- Relief and altitude: Himalayas block cold Siberian winds and influence precipitation patterns; temperature decreases with height (lapse rate).
- Pressure and wind systems: seasonal reversal between low-pressure over the heated subcontinent (ITCZ shift) and high-pressure belts; western disturbances bring winter rain to NW India.
- Distance from sea and continentality: interior (Rajasthan, Punjab) shows extreme temperatures; coastal areas are moderating.
- Ocean currents and sea surface temperature: influence monsoon vigor and cyclogenesis; large-scale phenomena like ENSO (El Niño/La Niña) modulate monsoon strength.
Rainfall pattern and regional contrasts
- Western Ghats and northeastern India (Cherrapunji, Mawsynram region) receive very high annual rainfall due to orographic lifting.
- Western Rajasthan and parts of the Deccan Plateau are arid to semi-arid (rainshadow effect east of Western Ghats and leeward of Aravallis).
- The Indo-Gangetic Plain receives most rainfall during the monsoon and shows intense seasonal agriculture.
- Cyclones in the Bay of Bengal and Arabian Sea produce concentrated heavy rainfall and storm surge events on the coasts.
Climatic regions (brief)
Typical divisions include: tropical wet (coastal, NE), tropical wet-and-dry (Deccan, central India), arid and semi-arid (Thar, western Rajasthan), humid subtropical (north Indian plains), and alpine/mountain climate (Himalayas).
Variability and extremes
- Interannual variability: monsoon rainfall can be surplus, normal or deficient; large-scale ENSO events often correlate with monsoon failures (El Niño tends toward weaker monsoon).
- Extremes: heat waves in north and central India, cold waves/fog in north, floods (riverine and flash) during heavy monsoon events, cyclones causing coastal damage.
Implications
Monsoon variability affects agriculture, water resources, hydroelectricity and disaster management. Urbanization and land-use changes have amplified flood risks in many cities.
Summary
India's climate is shaped by monsoon dynamics, relief features (especially the Himalayas and Western Ghats), and interactions with ocean-atmosphere systems. Spatial contrasts (wet coasts vs dry interiors) and pronounced seasonality (wet vs dry seasons) are its defining characteristics.
- Chennai floods (November–December 2015): Extreme northeast monsoon rainfall combined with urban drainage issues caused severe urban flooding in Tamil Nadu.
- Uttarakhand floods (June 2013): Exceptionally heavy monsoon rainfall and cloudbursts in the Himalayan catchment produced devastating flash floods and landslides.
- Odisha Super Cyclone (1999): A powerful tropical cyclone in the Bay of Bengal causing large-scale coastal devastation, illustrating cyclone risk.
- Rainshadow effect on Deccan Plateau: Areas east of the Western Ghats (e.g., parts of Karnataka and Telangana) receive much less rain than the windward west coast (e.g., Agumbe).
- El Niño impact (general): Strong El Niño years are often associated with below-normal monsoon rainfall and drought-like conditions in parts of India (e.g., mid-2010s deficits).
- Environmental lapse rate (approximate): ΔT/Δz ≈ 6.5 °C per 1,000 m (temperature decrease with altitude).
- Relative Humidity (RH): RH (%) = (e / e_s) × 100, where e = actual vapor pressure, e_s = saturation vapor pressure at the air temperature.
- Saturation vapor pressure (Tetens approximation): e_s(T) ≈ 6.112 × exp((17.67 × T) / (T + 243.5)), T in °C, e_s in hPa.
- Magnus formula (approximate dew point Td): α = ln(RH/100) + (17.27 × T)/(237.3 + T); Td = (237.3 × α) / (17.27 − α), where T is air temperature in °C and RH is relative humidity in %.
- Simple Thornthwaite PET (monthly potential evapotranspiration, conceptual): PET = 16 × (10 × T / I)^a, where T = mean monthly temperature (°C), I = annual heat index (sum of (T/5)^1.514 over months), and a is empirically derived from I. (Used for climatological water-balance estimates.)
Human Impact and Climate Change (Introductory)
Overview
Human activities since the Industrial Revolution have altered the composition of the atmosphere and the Earth’s surface, driving climate change. The primary mechanism is the enhanced greenhouse effect: higher concentrations of greenhouse gases (GHGs) trap more outgoing longwave radiation, raising global temperatures.
Key processes
- Greenhouse gases (GHGs): Carbon dioxide (CO2), methane (CH4), nitrous oxide (N2O) and fluorinated gases absorb outgoing infrared radiation and warm the atmosphere. CO2 is the largest long-term contributor from fossil fuel combustion and land-use change.
- Enhanced greenhouse effect: Human emissions increase atmospheric GHG concentrations above natural levels, increasing radiative forcing (net energy gain) and causing warming.
- Land-use change: Deforestation reduces carbon sinks, changes surface albedo and affects local climate (less evapotranspiration → warmer and drier local conditions).
- Aerosols and particulates: Can cool (sulfates reflecting sunlight) or warm (black carbon absorbing sunlight) the atmosphere; they also affect cloud properties and precipitation patterns.
- Feedbacks: Positive feedbacks amplify warming (ice–albedo feedback: melting ice reduces reflectivity; permafrost thaw releases methane). Some negative feedbacks (increased cloud cover in some regions) can offset warming locally.
Observed and expected impacts
- Global mean surface temperature rise (observed warming ~1.0–1.2°C above pre-industrial levels as of early 2020s).
- Melting glaciers and ice sheets → sea level rise and reduced freshwater stored in glaciers.
- Changing precipitation patterns → some regions wetter (intense rainfall, floods), others drier (droughts, crop stress).
- More frequent and intense extreme events: heatwaves, heavy rainfall, cyclones.
- Ecosystem and biodiversity impacts: coral bleaching, habitat loss, shifts in species ranges.
- Socio-economic impacts: threats to agriculture, water resources, human health, and infrastructure (coastal flooding, heat stress in cities).
Human activities contributing to GHG increases
- Burning fossil fuels for energy and transport (CO2).
- Agriculture (rice paddies, livestock) and waste (CH4), and fertilizer use (N2O).
- Industrial processes (cement, chemical industries) producing CO2 and fluorinated gases.
- Deforestation and land conversion that release stored carbon and reduce sinks.
Mitigation and adaptation (brief)
Mitigation: reduce emissions (renewables, efficiency, cleaner transport), conserve and restore forests, change agricultural practices. Adaptation: build resilient infrastructure, water management, early-warning systems, climate-smart agriculture.
Introductory note for students: Understand the cause–effect chain: human activity → higher GHG concentrations → increased radiative forcing → global warming → physical and socio-economic impacts. Use measured indicators (CO2 in ppm, global temperature anomaly in °C, sea level in mm) to track change.
- Mauna Loa CO2 record: atmospheric CO2 rose from ~280 ppm (pre-industrial) to ~420+ ppm (2020s), illustrating the link between fossil fuel use and atmospheric concentration.
- Glacier retreat in the Himalaya and the Alps: many glaciers have lost ice mass over recent decades, affecting seasonal river flows and water availability.
- Urban heat island example: Delhi and Mumbai record higher night-time temperatures than surrounding rural areas due to concrete, low vegetation and waste heat.
- Coral bleaching—Great Barrier Reef: higher sea surface temperatures have caused repeated mass bleaching events, killing coral and harming fisheries and tourism.
- Increased flooding in Mumbai and Chennai linked to more intense rainfall events and poor urban drainage, increasing damage to property and health risks.
- Radiative forcing from CO2 change: ΔF = 5.35 × ln(C/C0) (W/m²), where C = current CO2 (ppm), C0 = reference CO2 (ppm).
- Approximate temperature response: ΔT = λ × ΔF, where λ is climate sensitivity parameter (K per W/m²). Typical equilibrium climate sensitivity ≈ 3°C for CO2 doubling.
- Doubling CO2 forcing: ΔF(2×CO2) ≈ 5.35 × ln(2) ≈ 3.7 W/m².
- Stefan–Boltzmann law (planetary energy balance context): F = σ T⁴, where σ = 5.67×10⁻⁸ W·m⁻²·K⁻⁴ and T is absolute temperature (K).
Climatic Data Interpretation and Mapping
What it is: Climatic data interpretation and mapping is the process of analysing numerical climate records (monthly mean temperatures, monthly precipitation, pressure, humidity, wind speed/direction, etc.), extracting meaningful indicators (annual means, seasonal ranges, anomalies) and representing them visually on graphs and maps (climographs, isotherms, isohyets, wind roses, etc.) to understand spatial and temporal climate patterns.
Types of climatic data:
- Temperature (monthly means, maxima/minima)
- Precipitation (monthly totals, intensity)
- Pressure, humidity, sunshine hours, wind speed and direction
- Derived indices (annual mean, range, coefficient of variation, aridity index)
Steps in interpretation:
- Organise raw data in a monthly table for one or more stations.
- Compute basic statistics: annual mean temperature, total annual precipitation, monthly percentages, annual range, standard deviation.
- Plot graphs to visualise seasonality (climograph: temperature line + precipitation bars; monthly temperature curve; rainfall histogram).
- Map spatial patterns using contours: draw isotherms (equal temperature), isohyets (equal rainfall), isobars (equal pressure) and wind-rose maps for wind data.
- Interpret patterns: identify seasons, wet/dry periods, monsoon onset/withdrawal, continentality, maritime influence, rain-shadow effects, and climatic types (using criteria such as Koppen’s classification if required).
Rules & good practices for mapping:
- Use evenly spaced contour intervals suitable for the variable (e.g., 2–5°C for isotherms in regional maps; 100 mm or 200 mm for isohyets depending on range).
- Smooth contour lines; they should not cross. Where data are sparse, interpolate cautiously and show uncertainty.
- Label contours clearly and use a legend and scale. Use different colours or line styles for positive/negative anomalies or different variable ranges.
- When plotting both temperature and precipitation (climograph), use left vertical axis for temperature (line) and right vertical axis for precipitation (bars) with consistent units.
What to look for when reading results:
- Peaks and troughs: identify months of maximum/minimum temperature and rainfall.
- Annual range of temperature: indicates continentality (large range) vs maritime moderation (small range).
- Concentration of rainfall: whether precipitation is evenly spread or concentrated in a short season (e.g., monsoon).
- Spatial gradients: latitude, altitude and distance from sea influence isotherm and isohyet patterns (e.g., temperature decrease with latitude and elevation; rainfall increase on windward slopes).
Applications / Uses: agricultural planning (sowing/harvest timing), water resource management, urban planning (heat islands), disaster risk (flood/drought forecasting), climate classification and change detection.
- New Delhi: Monthly temperature curve shows very high peak in May–June and large annual range; precipitation bars concentrated in June–September (southwest monsoon) — indicates continental climate with strong summer monsoon influence.
- Chennai: Temperature remains relatively high and seasonal range is small; rainfall peaks in October–December (northeast monsoon) — climograph shows late-year rainfall maxima unlike western coast cities.
- Mumbai: Climograph shows moderate temperatures year-round but very high precipitation bars in June–September (heavy southwest monsoon) — maps with isohyets show high rainfall along the western Ghats' windward side and sharp decrease on the leeward side (rain-shadow).
- Leh / Ladakh: Very low annual precipitation (sum of monthly rainfall is small) and large diurnal/annual temperature ranges; isohyet maps show these regions as arid/near-arid.
- Monsoon onset analysis: Use cumulative monthly rainfall for a station — a distinct steep increase between May and July indicates monsoon arrival; flattening later indicates withdrawal.
- Annual mean temperature (T̄) = (Σ monthly mean temperatures) / 12
- Annual total precipitation (Pannual) = Σ (monthly precipitation for 12 months)
- Annual temperature range = (Mean temperature of warmest month) − (Mean temperature of coldest month)
- Monthly percentage of annual rainfall = (Monthly rainfall / Pannual) × 100
- Coefficient of variation for monthly rainfall (CV%) = (Standard deviation of monthly rainfall / Mean monthly rainfall) × 100 — measures seasonality/variability
- Anomaly (for a month) = Observed value − Long-term mean value (positive = above normal, negative = below normal)
Key Concepts
- Climate
- The long-term average of weather conditions (temperature, precipitation, wind, etc.) over a region, typically calculated over 30 years or more.
- Weather
- The short-term state of the atmosphere at a place and time, including temperature, humidity, precipitation, wind and visibility.
- Insolation
- Incoming solar radiation received at the Earth's surface; primary source of atmospheric heating and drives climate processes.
- Latitude
- Angular distance of a place north or south of the equator; a major factor controlling solar insolation and temperature patterns.
- Altitude (Elevation)
- Height of a place above sea level; temperature generally decreases with increasing altitude, affecting local climate.
- Atmospheric pressure
- Force exerted by the weight of air above a unit area of Earth's surface; influences wind and weather systems.
- Pressure belts
- Planetary-scale zones of high and low atmospheric pressure (e.g., equatorial low, subtropical highs) that affect global wind patterns.
- Winds
- Horizontal movement of air from high to low pressure, modified by Earth's rotation and surface features.
- Coriolis force
- Apparent deflection of moving air (and water) due to Earth's rotation; deflects winds to the right in the Northern Hemisphere and to the left in the Southern Hemisphere.
- Monsoon
- Seasonal reversal in wind direction caused by differential heating between land and sea, producing marked wet and dry seasons in some regions.
- Inter-Tropical Convergence Zone (ITCZ)
- A low-pressure zone near the equator where trade winds converge, causing rising air and heavy rainfall; it shifts seasonally with the sun.
- Jet stream
- Fast, narrow upper-atmosphere westerly winds (at 9–12 km altitude) that influence weather systems and monsoon dynamics.
- Cyclone
- A low-pressure system with inward-spiraling winds; tropical cyclones are intense storms that develop over warm oceans and bring heavy rain and winds.
- Anticyclone
- A high-pressure system with outward-spiraling winds; generally associated with clear, stable weather.
- Ocean currents
- Large-scale horizontal flows of seawater driven by winds, temperature and salinity differences; they modify coastal climates by transporting heat.
- Continentality
- The climatic effect of being located inland away from oceans, producing larger temperature ranges between seasons.
- Maritime climate
- Climate of coastal regions strongly influenced by nearby oceans, characterized by smaller temperature ranges and higher humidity.
- Evaporation
- Process by which water changes from liquid to vapor at the Earth's surface, supplying atmospheric moisture for clouds and precipitation.
- Humidity
- Amount of water vapour present in the air; expressed as absolute humidity or relative humidity; important for comfort and cloud formation.
- Convectional rainfall
- Precipitation produced when intense surface heating causes air to rise, cool adiabatically and condense, often resulting in afternoon thunderstorms.
End-of-Chapter Trial Paper & Test Questions
Topic-wise questions to test your understanding of every concept in this chapter.
-
Distinguish between weather and climate with one example each. / मौसम और जलवायु में अंतर कीजिए तथा प्रत्येक का एक उदाहरण दीजिए।
Show answer
Weather is the short-term state of the atmosphere over minutes to days (e.g., tomorrow's heavy rain over Mumbai), while climate is the long-term average of weather over about 30 years (e.g., Mumbai's tropical wet-dry monsoon climate). / मौसम कुछ मिनटों से दिनों तक वायुमंडल की अल्पकालिक अवस्था है (जैसे कल मुंबई में भारी वर्षा), जबकि जलवायु लगभग 30 वर्षों में मौसम का दीर्घकालिक औसत है (जैसे मुंबई की उष्णकटिबंधीय आर्द्र-शुष्क मानसूनी जलवायु)।
-
Explain how distance from the sea (continentality) affects the annual temperature range of a place. / स्पष्ट कीजिए कि समुद्र से दूरी (महाद्वीपीयता) किसी स्थान के वार्षिक तापमान परिसर को किस प्रकार प्रभावित करती है।
Show answer
Because water has a high heat capacity and heats and cools slowly, coastal places have a small annual temperature range, whereas interior continental locations heat and cool rapidly and so experience hot summers and cold winters with a large annual range. / चूँकि जल की ऊष्मा-धारिता उच्च होती है और वह धीरे गर्म व ठंडा होता है, तटीय स्थानों का वार्षिक तापमान परिसर छोटा होता है, जबकि आंतरिक महाद्वीपीय स्थान तेज़ी से गर्म व ठंडे होते हैं अतः वहाँ गर्म ग्रीष्म और ठंडी शीत के साथ बड़ा वार्षिक परिसर होता है।
-
Describe the formation of orographic rainfall and the rain-shadow effect with an Indian example. / पर्वतीय (orographic) वर्षा और वृष्टि-छाया प्रभाव के निर्माण का वर्णन एक भारतीय उदाहरण सहित कीजिए।
Show answer
When moist winds are forced to rise over a mountain, they cool, condense and produce heavy rain on the windward slope, while the descending dry air on the leeward side creates a rain shadow; for example, the Western Ghats receive heavy monsoon rain on the windward side while the leeward Deccan plateau remains dry. / जब आर्द्र पवनें किसी पर्वत के ऊपर उठने को बाध्य होती हैं तो वे ठंडी होकर संघनित होती हैं और पवनाभिमुख ढाल पर भारी वर्षा करती हैं, जबकि पवनविमुख ओर उतरती शुष्क वायु वृष्टि-छाया बनाती है; जैसे पश्चिमी घाट पवनाभिमुख ओर भारी मानसूनी वर्षा प्राप्त करते हैं जबकि पवनविमुख दक्कन पठार शुष्क रहता है।
-
Why does the south-west monsoon burst over India in summer? Explain the role of differential heating. / ग्रीष्म ऋतु में दक्षिण-पश्चिम मानसून भारत पर क्यों फूट पड़ता है? विभेदी तापन की भूमिका समझाइए।
Show answer
In summer the landmass (e.g., the Thar region) heats much faster than the surrounding ocean, creating an intense thermal low over the land; the resulting pressure gradient draws moist south-west winds from the Indian Ocean toward the land, bringing heavy monsoon rainfall. / ग्रीष्म में स्थलखंड (जैसे थार क्षेत्र) आसपास के महासागर की तुलना में बहुत तेज़ी से गर्म होता है, जिससे स्थल पर तीव्र तापीय निम्न दाब बनता है; परिणामी दाब प्रवणता हिंद महासागर से आर्द्र दक्षिण-पश्चिम पवनों को स्थल की ओर खींचती है, जो भारी मानसूनी वर्षा लाती हैं।
-
A station records a daily maximum of 34°C and a daily minimum of 18°C. Calculate the daily mean temperature and the diurnal range. / एक केंद्र दैनिक अधिकतम 34°C और दैनिक न्यूनतम 18°C दर्ज करता है। दैनिक माध्य तापमान और दैनिक परिसर ज्ञात कीजिए।
Show answer
Daily mean = (Tmax + Tmin)/2 = (34 + 18)/2 = 26°C; diurnal range = Tmax − Tmin = 34 − 18 = 16°C. / दैनिक माध्य = (Tmax + Tmin)/2 = (34 + 18)/2 = 26°C; दैनिक परिसर = Tmax − Tmin = 34 − 18 = 16°C।
-
What is a temperature inversion and how does it affect valleys? / तापमान व्युत्क्रमण क्या है और यह घाटियों को किस प्रकार प्रभावित करता है?
Show answer
A temperature inversion occurs when temperature increases with height instead of decreasing; in valleys, cold dense air pools at the bottom overnight, trapping pollutants and forming fog until daytime heating disperses the inversion. / तापमान व्युत्क्रमण तब होता है जब ऊँचाई के साथ तापमान घटने के बजाय बढ़ता है; घाटियों में रात भर ठंडी सघन वायु तली में एकत्र हो जाती है, जो प्रदूषकों को रोककर कोहरा बनाती है जब तक दिन का तापन व्युत्क्रमण को समाप्त न कर दे।
-
Explain how the Coriolis force modifies the direction of winds in the two hemispheres. / स्पष्ट कीजिए कि कोरिऑलिस बल दोनों गोलार्धों में पवनों की दिशा को किस प्रकार संशोधित करता है।
Show answer
The Coriolis force, arising from Earth's rotation, deflects moving air to the right of its motion in the Northern Hemisphere and to the left in the Southern Hemisphere, and its strength increases with latitude; this turns straight pressure-driven flow into curved global wind patterns. / पृथ्वी के घूर्णन से उत्पन्न कोरिऑलिस बल गतिमान वायु को उत्तरी गोलार्ध में उसकी गति के दाईं ओर तथा दक्षिणी गोलार्ध में बाईं ओर विक्षेपित करता है, और इसकी प्रबलता अक्षांश के साथ बढ़ती है; यह सीधे दाब-चालित प्रवाह को वक्र वैश्विक पवन प्रतिरूपों में बदल देता है।
-
Using the three-cell model, explain why deserts are commonly found near 30° latitude. / त्रि-कोष्ठ प्रतिरूप का प्रयोग करते हुए स्पष्ट कीजिए कि मरुस्थल प्रायः 30° अक्षांश के निकट क्यों पाए जाते हैं।
Show answer
Near 30° latitude the poleward-moving air of the Hadley cell descends, forming the subtropical high-pressure belt; this sinking dry air suppresses cloud formation and rainfall, so major deserts such as the Sahara and Arabian deserts form there. / 30° अक्षांश के निकट हैडली कोष्ठ की ध्रुव की ओर बढ़ती वायु नीचे उतरती है, जिससे उपोष्ण उच्च दाब पेटी बनती है; यह उतरती शुष्क वायु बादल-निर्माण और वर्षा को दबा देती है, अतः वहाँ सहारा और अरब जैसे बड़े मरुस्थल बनते हैं।
Related Laws & Principles
Explore allFoundational laws & principles behind this chapter. Each one opens a full page — what it says, why it matters, five practice questions and the mistakes to avoid.