Overview
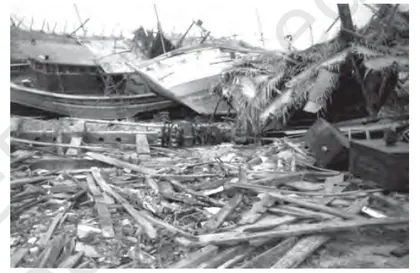
This chapter introduces natural hazards and disasters in the Indian context, explaining basic concepts, causes and differences between hazards, vulnerability and disasters. It emphasises why studying hazards is important for a disaster-prone country like India and links physical processes (tectonics, atmospheric systems, geomorphic agents) to common hazards (earthquakes, volcanoes, floods, droughts, cyclones, landslides, avalanches, coastal erosion and tsunamis) as well as human-induced hazards. Key themes include classification of hazards, spatial patterns and regional vulnerability in India, hazard assessment and mapping, and the disaster management cycle (mitigation, preparedness, response and recovery). The chapter also outlines institutional frameworks and policies in India (Disaster Management Act, role of NDMA, NDRF, IMD and state agencies), early warning systems, community-based measures and technological tools for risk reduction. Students learn to identify causes and impacts of different hazards, read and interpret hazard-prone maps, analyse case studies, and evaluate strategies for mitigation and sustainable development to reduce disaster risk.
Learning Objectives
- Define key terms such as hazard, vulnerability, risk, disaster and catastrophe with India-specific examples.
- Explain the classification of natural hazards (geological, hydrological, atmospheric) and give representative examples for each category.
- Describe the geological causes and processes of earthquakes and volcanoes and identify their observable effects on the landscape.
- Explain measurement and intensity scales (e.g., magnitude and intensity) used for earthquakes and how they inform disaster response.
- Analyse causes, progression and impacts (social, economic, environmental) of floods, droughts, cyclones and landslides in India.
- Assess the role of climate change and human activities in modifying the frequency and intensity of hydro-meteorological hazards.
- Identify monitoring and early-warning technologies (seismographs, Doppler radar, satellites, GIS) and explain their application in hazard forecasting.
- Illustrate the disaster management cycle—mitigation, preparedness, response and recovery—using specific examples from Indian policy or events.
Topics in this chapter
20 topics · tap a topic title to jump straight to it.
Introduction and Basic Concepts
What is a Natural Hazard? A natural hazard is a naturally occurring physical event or process (geological, hydrometeorological, biological, or climatic) that has the potential to cause harm to people, property, infrastructure, or the environment. Examples: earthquakes, cyclones, floods, droughts, landslides, volcanic eruptions.
What is a Disaster? A disaster is the realization of a hazard that overwhelms local capacity, causing serious disruption, loss of life, injury, or property and environmental damage. A hazard becomes a disaster when it intersects with vulnerable populations and inadequate coping capacity.
Key Components and Basic Concepts
- Hazard – the physical event (e.g., earthquake tremor, heavy rainfall).
- Exposure – people, assets, infrastructure, or ecosystems located in hazard-prone areas.
- Vulnerability – degree to which exposed elements are susceptible to damage (construction type, poverty, lack of warning).
- Capacity – resources, skills, institutions and coping mechanisms available to manage and reduce hazard impacts.
- Risk – expected losses from hazards, considering probability and consequences.
Characteristics of Hazards – Magnitude (size/intensity), frequency (how often), duration (how long), spatial extent (area affected), speed of onset (sudden vs slow), and probability of occurrence.
Hazard Classification
- Geological hazards: earthquakes, volcanoes, landslides.
- Hydro-meteorological hazards: cyclones, floods, droughts, severe storms.
- Biological hazards: epidemics, pandemics, locust swarms.
- Technological/Man-made hazards: industrial accidents, chemical spills (often triggered by natural events).
Relationship between Hazard, Vulnerability and Risk
Risk arises where hazards and vulnerability meet. Reducing vulnerability and increasing capacity reduces disaster risk even if hazard frequency remains unchanged.
Disaster Management Cycle – Four linked phases:
- Mitigation/Prevention: long-term measures to reduce exposure and vulnerability (e.g., land‑use planning, building codes).
- Preparedness: early warning systems, evacuation planning, drills.
- Response: immediate actions after the event (search, rescue, emergency relief).
- Rehabilitation/Reconstruction: restoring services, rebuilding infrastructure, improving resilience.
Resilience – the ability of communities or systems to anticipate, absorb, adapt to, and recover from hazard impacts while maintaining essential functions.
Why these concepts matter for Class 11 Geography – Understanding these basics helps explain spatial patterns of hazard occurrence, why some places suffer greater losses, and how planning and policy can reduce disaster impact.
- 2004 Indian Ocean earthquake and tsunami: a large undersea earthquake triggered devastating tsunamis across several countries, illustrating how a geological hazard caused widespread disasters when coastal populations were exposed and unprepared.
- 2015 Nepal earthquake: high magnitude earthquake with large loss of life and infrastructure damage; vulnerability due to weak building stock increased disaster impacts.
- 2013 Uttarakhand floods and landslides (India): extreme rainfall, glacier outburst events and unplanned development in steep catchments increased exposure and vulnerability.
- 2018 Kerala floods: prolonged heavy monsoon rainfall and saturated catchments led to severe flooding in populated river basins, showing hydro-meteorological hazard interacting with land-use factors.
- Cyclone Phailin (2013) vs. Cyclone Fani (2019): early warning and large-scale evacuation reduced casualties in some recent Indian cyclones, illustrating the role of preparedness and capacity.
- Bhopal gas tragedy (1984): an industrial/technological disaster with long-term health and environmental impacts—shows that man-made hazards can be catastrophic when safety and regulation fail.
- Risk = Hazard × Vulnerability (qualitative relation often used in planning to show that reducing vulnerability reduces risk)
- Risk = Probability × Consequence (quantitative framing used in risk assessment: expected loss = likelihood of event × impact/loss)
- Annual Average Loss (AAL) = Σ (P_i × L_i), where P_i = probability of event i in a year, L_i = loss from event i
- Return period (T) for rank-based method: T = (n + 1) / m, where n = number of years of record, m = rank of event (1 = largest). Probability of exceedance p = 1 / T
- Discharge (river) Q = A × v, where Q = discharge (m³/s), A = cross-sectional area (m²), v = mean velocity (m/s) — used in flood calculations
- Factor of Safety (slope stability) FS = Resisting forces / Driving forces. FS < 1 indicates likely failure.
Classification of Hazards
What is a hazard? A hazard is a potentially damaging physical event, phenomenon or human activity that may cause loss of life, injury, property damage, social and economic disruption or environmental degradation.
Why classify hazards? Classification helps in understanding causes, assessing risk, planning mitigation and preparing appropriate responses.
Common bases for classification
- By origin: Natural (caused by Earth or life processes) vs Anthropogenic/Technological (caused by human activities).
- By physical nature/type:
- Geophysical: earthquakes, volcanoes, tsunamis (solid Earth processes).
- Hydrological: floods, landslides, avalanches (water/flow-driven processes).
- Meteorological: storms, cyclones, tornadoes (atmospheric processes).
- Climatological: droughts, heat waves, cold waves (long-term climate variations).
- Biological: epidemics, pandemics, locust swarms (living organisms).
- Technological / Industrial: chemical spills, nuclear accidents, urban fires (human systems).
- By tempo/onset: Sudden-onset (earthquakes, tsunamis, flash floods) vs Slow-onset (drought, desertification, some epidemics).
- By spatial scale: Local (landslides), Regional (cyclones, droughts), Global (pandemics, climate change).
- By frequency–magnitude relationship: High-frequency/low-intensity vs Low-frequency/high-intensity events; useful for planning and insurance.
- By predictability: predictable (some cyclones with warning) vs unpredictable (sudden earthquakes).
How classification links to risk management
- Type of hazard determines monitoring needs (seismographs, weather satellites, epidemiological surveillance).
- Onset speed affects early-warning systems and preparedness (seconds/minutes for quakes; days/weeks for cyclones; months for drought).
- Scale and frequency guide resource allocation (local mitigation for landslides; international cooperation for pandemics).
Example of a simple decision framework: First ask (1) Origin (natural/anthropogenic), (2) Physical type (geo/metro/hydro/bioclim/tech), (3) Onset (sudden/slow), (4) Scale (local/regional/global). This leads to appropriate monitoring, early warning and response actions.
Key takeaway: Classification is a tool — hazards often interact (compound hazards) and classification should guide tailored preparedness, mitigation and recovery strategies.
- Geophysical (sudden): 2004 Indian Ocean tsunami triggered by undersea earthquake — high magnitude, sudden onset, transnational impacts.
- Hydrological (sudden/regional): 2013 Uttarakhand flash floods and landslides — intense rainfall, rapid runoff, slope failure.
- Meteorological (regional): Cyclone Fani (2019) over Odisha — predictable path, allowed evacuation and warnings.
- Climatological (slow/onset): Recurrent droughts in parts of Rajasthan and Vidarbha — long-term rainfall deficit affecting agriculture.
- Biological (regional to global): COVID-19 pandemic — biological hazard with global scale and prolonged impacts.
- Technological/Anthropogenic: 1984 Bhopal gas tragedy — industrial chemical leak causing large human casualties and long-term health effects.
- Risk = Hazard × Vulnerability × Exposure (conceptual formula used in disaster risk assessment).
- Return period (recurrence interval) T = (N + 1) / M, where N = number of years of record, M = rank of the event (1 for largest).
- Annual exceedance probability P (for an event with return period T) = 1 / T.
- Probability of at least one event in n years (with annual probability p = 1/T): P_n = 1 - (1 - p)^n.
- Gutenberg–Richter relation (earthquakes): log10 N = a - bM, where N = number of earthquakes ≥ magnitude M; a, b are constants describing seismicity.
- Rational method for peak runoff (simple flood estimate): Q = C × i × A, where Q = peak discharge, C = runoff coefficient, i = rainfall intensity, A = catchment area (consistent units).
Earthquakes
Definition: An earthquake is a sudden release of energy in the Earth's crust that creates seismic waves. The point where rupture starts below the surface is the hypocenter (focus); the point on the surface directly above it is the epicenter.
Causes:
- Plate tectonics: Most earthquakes occur where plates interact — convergent (subduction), divergent (spreading) and transform (strike‑slip) boundaries.
- Faulting: Sudden slip on faults (reverse/thrust, normal, strike‑slip) releases strain built up in rocks.
- Other causes: Volcanic activity, reservoir‑induced seismicity, mining and fluid injection/extraction.
Seismic waves:
- Body waves: P (primary, compressional) waves — fastest; S (secondary, shear) waves — slower, do not travel through fluids.
- Surface waves: Love (horizontal shear) and Rayleigh (rolling) waves — slower but often cause greatest damage near epicenter.
Measuring earthquakes: Magnitude quantifies the energy released (single number per event); intensity describes shaking effects at locations (varies by site) using scales such as the Modified Mercalli Intensity (MMI).
Common effects and hazards: Ground shaking, surface rupture, landslides, liquefaction (loss of soil strength in saturated sands), tsunamis (if undersea quake displaces the seafloor), fires, and secondary infrastructure failures.
Aftershocks and foreshocks: Aftershocks are smaller quakes following a mainshock and decay in frequency over time (characteristic decay described by Omori's law). Foreshocks precede a mainshock but are only identified as such after the larger event.
Earthquake prediction vs forecasting: Short‑term prediction of exact time, place and magnitude is not possible reliably. Forecasting uses statistics (historical seismicity, plate models) to give probability of events over years to decades.
Mitigation and preparedness: Land‑use planning away from active faults, earthquake‑resistant building design (ductile detailing, base isolation, energy dissipation), strict building codes, retrofitting older structures, public education, early warning systems (detect P‑waves to warn of subsequent stronger shaking) and emergency response planning.
- 2004 Sumatra–Andaman (Indian Ocean) earthquake and tsunami — Magnitude ~9.1–9.3; megathrust subduction event produced a devastating tsunami across the Indian Ocean, causing ~230,000–280,000 deaths across many countries.
- 2011 Tōhoku, Japan — Magnitude 9.0; undersea megathrust earthquake off NE Japan caused a large tsunami, ~20,000 deaths, and the Fukushima nuclear accident; illustrated tsunami hazard from subduction zones.
- 2015 Nepal (Gorkha) earthquake — Magnitude 7.8; caused widespread damage and ~9,000 deaths, severe impact on Kathmandu heritage sites; occurred on the convergent Himalayan thrust system.
- 2001 Gujarat (Bhuj), India — Magnitude 7.7; inland strike‑slip/reverse faulting caused ~20,000 deaths and large urban destruction highlighting vulnerability of poorly constructed buildings.
- 1999 İzmit, Turkey — Magnitude 7.6; strike‑slip on North Anatolian Fault caused ~17,000 deaths and showed importance of enforcing seismic codes in urban areas.
- Richter (local) magnitude (conceptual): ML = log10(A) - log10(A0(Δ)) (A = maximum amplitude on standard seismograph; A0(Δ) is a distance correction factor).
- Moment magnitude (preferred for large quakes): Mw = (2/3) [log10(M0) - 9.1] (M0 in N·m; constant ~9.1 depends on unit conventions).
- Energy released (approximate, joules): E ≈ 10^(1.5 M + 4.8) (M = magnitude; gives order of magnitude of seismic energy).
- Gutenberg–Richter frequency–magnitude relation: log10 N = a - b M (N = number of events ≥ M; b ≈ 1 typically).
- Omori's law (aftershock decay): n(t) = k / (c + t)^p (n = rate of aftershocks at time t after mainshock; p ≈ 1).
- Seismic wave velocities in elastic medium: Vp = sqrt((K + 4/3 μ) / ρ), Vs = sqrt(μ / ρ) (K = bulk modulus, μ = shear modulus, ρ = density).
Volcanoes
What is a volcano? A volcano is a vent or fissure in the Earth's crust through which molten rock (magma), gases and pyroclastic material reach the surface. When magma reaches the surface it is called lava.
Causes and tectonic settings
- Subduction zones: Oceanic plate sinks beneath another plate; partial melting of the slab and overlying mantle produces andesitic to rhyolitic magmas — typical of explosive stratovolcanoes (e.g., Ring of Fire).
- Rift zones and mid-ocean ridges: Plates pull apart, decompression melting of mantle produces basaltic magma and fissure eruptions (e.g., Iceland, East African Rift).
- Hotspots: Fixed mantle plumes produce chains of volcanoes as plates move over them (e.g., Hawaiian Islands, Yellowstone).
- Intraplate/flood basalt events: Large-volume effusive eruptions produce extensive basalt plateaus (e.g., Deccan Traps).
Types of volcanoes
- Shield volcanoes: Broad, gently sloping, built by low-viscosity basaltic lava (e.g., Mauna Loa).
- Stratovolcanoes / composite volcanoes: Steep-sided, layered by lava and tephra, commonly explosive (e.g., Mount Fuji, Mount St. Helens).
- Cinder (scoria) cones: Small, steep conical hills built of pyroclastic fragments.
- Calderas: Very large depressions formed by collapse after massive eruptions (e.g., Yellowstone).
- Fissure eruptions: Lava emerges along cracks, producing lava fields (e.g., Laki, Iceland).
Products of eruptions: lava flows, pyroclastic flows (density currents of hot gas and tephra), ash fall, volcanic bombs/blocks, lahars (volcanic mudflows), volcanic gases (SO₂, CO₂, H₂S).
Primary hazards and impacts
- Local: lava, pyroclastic flows, ash fall, lahars — cause destruction of settlements, agriculture, infrastructure and can cause loss of life.
- Regional/global: ash clouds disrupt aviation; large eruptions inject SO₂ into the stratosphere causing short-term climate cooling and agricultural impacts (e.g., Tambora 1815 → "Year Without a Summer").
- Secondary: tsunamis from flank collapse or phreatomagmatic explosions, long-term health impacts from ash and gases.
Monitoring and mitigation
- Seismic monitoring: earthquake swarms indicate magma movement.
- Ground deformation: tiltmeters, GPS, InSAR detect inflation/deflation of magma chambers.
- Gas monitoring: SO₂, CO₂ flux changes signal changes in magma degassing.
- Remote sensing and thermal imaging: identify thermal anomalies and ash plumes.
- Preparedness: hazard mapping, early warning systems, exclusion zones, evacuation plans and public education.
Classification of eruptions — effusive vs explosive depends mainly on magma viscosity (controlled by silica content and temperature), gas content and conduit geometry. High-silica, high-viscosity magmas trap gases and are more explosive.
Key concepts for CBSE Class 11
- Volcanoes are closely linked to plate tectonics; most are along plate boundaries and hotspots.
- Hazard types (lava, pyroclastics, ash, lahars, gases) and their societal impacts.
- Monitoring techniques and the role of mitigation and planning.
- Mount Vesuvius, Italy (AD 79) — pyroclastic flows buried Pompeii and Herculaneum; classic example of a destructive stratovolcanic eruption.
- Krakatoa (Krakatau), Indonesia (1883) — catastrophic explosion, generated tsunamis and global atmospheric effects.
- Mount St. Helens, USA (1980) — lateral blast and pyroclastic flows following a landslide; illustrates volcano instability and rapid onset.
- Mount Pinatubo, Philippines (1991) — large injection of SO₂ into stratosphere caused measurable global cooling for 1–2 years.
- Eyjafjallajökull, Iceland (2010) — modest eruption with fine ash that disrupted aviation across Europe.
- Kilauea, Hawaii — prolonged effusive basaltic eruptions; example of shield volcano and lava flow hazards.
- Volcanic magnitude (order-of-magnitude relation): M_v = log10(V) where V is erupted volume (m^3). (This expresses eruptive magnitude on a log scale.)
- Volcanic Explosivity Index (VEI): an ordinal index based largely on erupted tephra volume. Each integer increase roughly represents a tenfold increase in erupted volume (VEI is semi-quantitative rather than a strict algebraic formula).
- Flow regime criterion (lava flow behavior): Reynolds number Re = ρ V L / μ; low Re indicates laminar flow (typical for viscous lava), high Re indicates turbulent flow (less common in lava). ρ = density, V = characteristic velocity, L = characteristic length, μ = dynamic viscosity.
- Empirical relation between column height and mass eruption rate: H ∝ M^(1/4) (column height H increases with the fourth root of mass eruption rate M; this is an empirical scaling used in plume models).
Tsunamis
Definition: A tsunami is a series of long water waves generated primarily by sudden displacement of the sea floor (usually by undersea earthquakes), submarine landslides, volcanic eruptions or meteorite impacts. Unlike ordinary wind waves, tsunamis have very long wavelengths (tens to hundreds of kilometres) and long periods (minutes to hours).
Causes (Generation):
- Undersea earthquakes: Sudden vertical displacement along thrust or normal faults (subduction zones) lifts or drops a large water column and produces tsunami waves. This is the most common cause of large tsunamis.
- Submarine landslides: Rapid mass movement displaces water locally and can produce very large local waves (e.g., Lituya Bay, 1958).
- Volcanic eruptions: Explosive collapse of calderas or pyroclastic flows entering water may trigger tsunamis (e.g., Krakatoa, 1883).
- Meteorite impacts: Rare but can produce large tsunamis depending on energy and location.
Characteristics:
- Long wavelength and period: Wavelengths range from tens to hundreds of kilometres; periods are minutes to hours.
- Shallow-water behaviour: Because wavelengths are so long, tsunamis behave as shallow-water waves even in deep ocean. Their speed depends on water depth, not wavelength.
- Small amplitude in deep sea, large run-up at coast: In the deep ocean wave height is small (often <1 m) and may pass unnoticed by ships. As the wave approaches shallow water it slows and its amplitude increases (shoaling), causing inundation and extreme run-up on shore.
- Wave trains and multiple waves: A tsunami typically arrives as a series of waves; the first is not always the largest. Time between waves may be long, so danger persists for hours.
- Drawdown: The shoreline may first experience unusual fall in sea level (withdrawal) before the crest arrives.
Propagation and behaviour (physical principles):
- In shallow-water approximation the wave speed c depends on gravity g and water depth h: c = √(g·h). Thus deeper ocean → faster waves.
- Wavelength relation: L = c·T (where T is wave period). Because T is large, L is very large.
- Shoaling effect: when wave speed decreases near shore (because h decreases), the wave height increases to conserve energy flux, causing amplification and inundation.
- Energy roughly scales with the square of wave height (E ∝ H²), so modest increases in H greatly increase destructive power.
Impacts: Coastal inundation and flooding, severe coastal erosion, destruction of buildings and infrastructure, contamination of freshwater and soils by saltwater, loss of life, and secondary disasters (fires, hazardous-material releases).
Early warning & mitigation:
- Seismic monitoring combined with sea-level (tide) gauges and DART (Deep-ocean Assessment and Reporting of Tsunamis) buoys detect and confirm tsunamis and provide warnings.
- Tsunami hazard mapping, evacuation routes, public education, land-use planning, and coastal defenses (where appropriate) reduce risk.
Class 11 points to remember: Understand primary causes (especially subduction earthquakes), the shallow-water wave formula c = √(g·h), the process of shoaling and run-up, signs of an approaching tsunami (earthquake felt near coast, sudden sea withdrawal), and key mitigation measures.
- Indian Ocean tsunami, 26 December 2004 — Triggered by a Mw ~9.1–9.3 undersea earthquake off Sumatra; caused widespread coastal inundation across the Indian Ocean, ~230,000–280,000 deaths and massive displacement.
- Tohoku (Japan) tsunami, 11 March 2011 — Mw 9.0 earthquake off NE Japan produced tsunami waves up to 40 m locally; caused about 19,000 deaths and the Fukushima Daiichi nuclear accident.
- 1960 Valdivia (Chile) tsunami — The largest instrumentally recorded earthquake (Mw 9.5) generated Pacific-wide tsunamis that caused damage as far away as Japan and the Philippines.
- Krakatoa eruption and tsunami, 1883 — Volcanic explosion in Indonesia produced tsunamis that killed tens of thousands and caused global atmospheric effects.
- Lituya Bay megatsunami, Alaska, 1958 — A landslide into the bay caused a local wave with run-up of 524 m; limited fatalities due to remote location.
- Tsunami shallow-water speed: c = √(g · h), where c is speed (m/s), g ≈ 9.81 m/s², and h is water depth (m). Example: for h = 4000 m, c ≈ √(9.81×4000) ≈ 198 m/s (~713 km/h).
- Wavelength relation: L = c · T, where L is wavelength (m) and T is wave period (s).
- Shallow-water validity criterion (approx): h < L/20. Tsunamis satisfy this even in deep ocean because L is very large.
- Approximate energy scaling: tsunami energy ∝ ρ g H² L (i.e., energy per unit crest length is roughly proportional to H²·L), where H is wave height and ρ is seawater density. (Used qualitatively: energy rises with square of height.)
- Deep-water wave speed (for contrast with wind waves): c = √(g·λ / 2π), where λ is wavelength; not applicable to tsunamis because they act as shallow-water waves.
Cyclones, Storms and Storm Surges
Overview
Cyclones (also called tropical cyclones, hurricanes or typhoons depending on region) are intense low-pressure systems that form over warm ocean waters. They are characterised by strong rotating winds, heavy rainfall and organised convective bands. A storm surge is an abnormal rise of sea level at the coast produced mainly by the wind and pressure effects of a cyclone; it is one of the most destructive impacts of coastal cyclones.
Formation and conditions required
- Warm sea surface temperature (typically >26–27°C) supplies heat and moisture.
- Pre-existing low-level disturbance to provide initial vorticity and convergence.
- Weak vertical wind shear so the system can build vertically without being torn apart.
- Sufficient Coriolis force (usually >5° latitude) to enable rotation and organized circulation.
- High humidity in the mid-troposphere to sustain deep convection.
Structure
- Eye: the calm, low-pressure centre (in strong cyclones).
- Eyewall: a ring of the most intense convection and highest winds surrounding the eye.
- Spiral rainbands: curved bands extending outward bringing heavy rain and gusts.
Why winds are strong
Air flows toward the low-pressure centre and, under gradient/centrifugal and Coriolis forces, circulates around it. The pressure gradient (difference between surrounding pressure and central pressure) drives high tangential wind speeds; the steeper the gradient (lower central pressure), the stronger the winds.
Storm surge — physical causes
- Wind-driven setup: persistent onshore winds push and pile water toward the coast (the dominant cause of surge).
- Inverse-barometer effect: drop in central pressure raises sea level beneath the storm by a small amount (sea level rise ≈ pressure drop divided by fluid weight).
- Coastal and bathymetric amplification: wide, shallow continental shelves, funnel-shaped bays and estuaries amplify surge; steeper shelves reduce it.
- Tidal timing: surge arriving at high tide produces much greater coastal inundation.
Impacts
Coastal inundation, severe flooding, erosion, destruction of buildings and infrastructure, salt-water intrusion into freshwater, and loss of life and livelihoods. Inland flooding from heavy rain and river overflow can extend damage far from the coast.
Prediction, warning and mitigation
- Meteorological agencies forecast track, intensity and potential surge; early warnings and evacuations reduce casualties.
- Structural measures: sea walls, levees and improved coastal drainage.
- Natural measures: preserving/restoring mangroves and coastal wetlands that reduce wave energy and surge.
- Preparedness: cyclone shelters, evacuation planning, building codes and public awareness.
CBSE relevance / summary
Understand formation conditions, basic structure, causes and impacts of storm surges, examples of major events, and the need for forecasting and preparedness to reduce disaster risk.
- 1999 Odisha (India) Cyclone: Very severe cyclonic storm that made landfall near Paradip causing widespread damage and large loss of life; highlighted need for better warning and shelter systems.
- Cyclone Fani (2019, India/Bangladesh): A very severe cyclone with massive evacuations in Odisha; good early warning and preparedness kept fatalities lower than earlier similar events.
- 1991 Bangladesh Cyclone (April 1991): Produced a catastrophic storm surge and led to an estimated ~138,000 deaths; prompted large-scale improvements in warning and shelter networks.
- Hurricane Katrina (2005, USA): Levee failures and a storm surge up to several metres caused catastrophic flooding in New Orleans and adjacent coasts, showing the devastating combined effects of surge and infrastructure failure.
- Typhoon Haiyan (Yolanda, 2013, Philippines): One of the strongest landfalling tropical cyclones on record, with storm surges reported in several coastal communities reaching multiple metres and causing enormous damage and loss of life.
- Inverse-barometer sea-level response: Δh = ΔP / (ρ_w * g) - Δh: rise in sea level due to pressure drop (m) - ΔP: pressure drop (Pa) (e.g., 1 hPa = 100 Pa) - ρ_w: density of seawater (~1025 kg/m³) - g: acceleration due to gravity (~9.81 m/s²) Note: a 50 hPa pressure drop produces ≈0.5 m rise (50 hPa = 5000 Pa → 5000 / (1025×9.81) ≈ 0.5 m).
- Wind stress on the sea surface: τ = ρ_air * C_d * U^2 - τ: wind stress (N/m²) - ρ_air: air density (~1.2 kg/m³) - C_d: drag coefficient (≈1.0–3.0×10⁻³, depends on wind speed) - U: wind speed at reference height (m/s) This stress drives water toward the coast and is a key input to surge models.
- Simple approximate steady surge estimate (order-of-magnitude): S ≈ (τ * L) / (ρ_w * g * h) - S: approximate surge height (m) - τ: wind stress (N/m²) - L: alongshore fetch or distance of wind forcing (m) - ρ_w: seawater density - g: gravity - h: mean water depth over which the wind acts (m) Caution: This is a highly simplified relation showing how surge grows with wind stress and fetch and decreases with depth; real surge prediction requires numerical hydrodynamic modelling with tides, bathymetry and coastal geometry.
Floods
Definition: Floods occur when water overflows onto normally dry land, caused by rivers, heavy rainfall, storm surges, rapid snowmelt, glacial lake outbursts or failure of man-made structures. Flooding is a natural hazard with both natural and anthropogenic triggers.
Types of Floods
- Riverine (Fluvial) Floods: Overbank flooding from rivers when discharge exceeds channel capacity.
- Flash Floods: Rapid flooding in small catchments after intense short-duration rainfall or dam failure; very little warning time.
- Coastal Floods and Storm Surges: Sea water inundation during cyclones, high tides and storm surges.
- Urban Floods: Caused by inadequate drainage, impervious surfaces and congested waterways.
- Glacial Lake Outburst Floods (GLOFs): Sudden release of water from a glacial lake.
Causes
- Natural: Heavy/continuous rainfall, snowmelt, high tides/storm surge, basin topography and soil saturation.
- Human-induced: Deforestation, land-use change, urbanization, encroachment on floodplains, poor drainage, breaching of embankments and improper reservoir management.
Factors influencing severity: catchment size and shape, slope, drainage density, soil type and antecedent moisture, vegetation cover, river channel modifications and population density on floodplains.
Flood hydrograph: A graph of river discharge versus time following a rainfall event. Key features: lag time (time between peak rainfall and peak discharge), rising limb, peak discharge and recession limb (falling limb). Short lag times and steep rising limbs indicate flash floods; long lag times are typical of larger basins.
Impacts: loss of life and injury, displacement, destruction of crops and infrastructure, spread of waterborne diseases, economic losses, sedimentation and altered river channels. Floods can also recharge groundwater and deposit fertile alluvium.
Mitigation and management
- Structural measures: dams and reservoirs, levees/embankments, floodwalls, diversion channels, retention basins and improved drainage.
- Non-structural measures: floodplain zoning and land-use planning, early warning systems and forecasting, evacuation planning, community preparedness, afforestation, restoring wetlands, insurance and post-disaster reconstruction guidelines.
Forecasting and preparedness: Uses meteorological forecasts, river gauging, rainfall-runoff models and real-time telemetry. Community education, evacuation routes and shelters reduce human losses.
Summary: Floods are complex hazards resulting from interactions of climate, geomorphology and human activity. Effective management combines engineering measures with planning, forecasting and community participation to reduce risk.
- 2018 Kerala floods, India: Exceptionally heavy monsoon rainfall and poor watershed management led to widespread inundation, high deaths and economic losses.
- 2013 Uttarakhand floods, India: Cloudburst and heavy rainfall in steep Himalayan catchments triggered flash floods, landslides and many casualties.
- 2005 Mumbai floods, India: Urban flooding due to intense rainfall, inadequate drainage and encroachments; major transport disruption and property damage.
- 1998 Assam floods, India: Prolonged Brahmaputra riverine flooding due to heavy monsoon rains and high upstream flows causing large-scale displacement.
- Glacial Lake Outburst Floods (GLOF) in the Himalaya: Breach of moraine-dammed lakes has caused sudden downstream flooding in several years.
- Continuity (discharge): Q = A × v where Q is discharge (m3/s), A is cross-sectional area (m2) and v is average velocity (m/s).
- Rational method (small catchments): Q = C × i × A where Q is peak runoff (m3/s or l/s), C is runoff coefficient (dimensionless), i is rainfall intensity (m/s or mm/hr) and A is drainage area (m2 or ha).
- Recurrence interval (return period): T = (N + 1) / M where N is number of years of record and M is the rank of a given flood (1 = largest).
- Manning formula (open-channel flow): V = (1/n) × R^(2/3) × S^(1/2) where V is velocity, n is Manning roughness coefficient, R is hydraulic radius and S is energy slope.
- Flood volume (simple): Volume = ∫ Q(t) dt over the flood duration (m3) (area under the hydrograph).
Droughts and Desertification
Definition: Drought is a period of abnormally dry weather long enough to cause a serious hydrological imbalance (shortage of water). Desertification is land degradation in arid, semi‑arid and dry sub‑humid areas resulting from various factors, including climatic variations and human activities, that leads to persistent decline in biological productivity of drylands.
Types of drought:
- Meteorological drought: deficiency of precipitation (rainfall) compared to normal for a region and period.
- Agricultural drought: soil moisture deficit affecting crop growth and yield.
- Hydrological drought: reduced streamflow, reservoir levels and groundwater recharge.
- Socio‑economic drought: when water shortages affect supply and demand of economic goods (food, power, industry).
Causes:
- Natural: variability of rainfall (monsoon failure), prolonged high temperatures, ENSO/La Niña/Indian Ocean Dipole, shifting storm tracks.
- Human: deforestation, overgrazing, unsustainable irrigation (salinisation), groundwater over‑pumping, land fragmentation and poor land management, population pressure.
Impacts:
- Environmental: soil erosion, loss of vegetation, declining biodiversity, salinisation, lowered water tables, desertification.
- Economic: crop failure, livestock losses, reduced hydropower and industrial production, higher food prices.
- Social: food insecurity, forced migration, health issues, conflicts over water and pasture.
Desertification — processes and drivers:
- Processes: topsoil loss (wind/water erosion), loss of vegetation cover, soil structure degradation, salinisation and alkalisation of soils, reduction in water infiltration and productivity.
- Drivers: climate variability (reduced rainfall), deforestation, overgrazing, unsuitable agricultural practices, diversion of water for irrigation, socio‑economic pressures (poverty, lack of land tenure).
Monitoring and indicators: drought indices (Standardized Precipitation Index – SPI, Palmer Drought Severity Index – PDSI), soil moisture records, reservoir and groundwater levels, vegetation cover (NDVI from satellites), aridity index (P/PET).
Management and mitigation:
- Short term: drought early warning systems, water rationing, relief and food aid, emergency groundwater pumping, insurance schemes for farmers.
- Medium–long term: rainwater harvesting, watershed management, check dams and recharge structures, drought‑resistant crops and cropping pattern change, conservation agriculture (mulching, contour ploughing), reforestation/afforestation, controlled grazing, soil conservation (terracing), groundwater management and regulated irrigation, livelihood diversification, policy measures (land rights, integrated dryland management).
- Institutional & global: United Nations Convention to Combat Desertification (UNCCD), national drought management plans, community participation and capacity building.
Role of climate change: climate change is projected to increase frequency and severity of droughts in many dry regions, exacerbate evapotranspiration (increasing moisture demand), and expand areas vulnerable to desertification.
Summary: Droughts are temporary extremes of water shortage with immediate impacts, while desertification is a longer‑term process of land degradation in drylands. Both require combined climatic monitoring, sustainable land and water management, and social‑economic measures to reduce vulnerability.
- Sahel region (West Africa): recurrent droughts in the 1970s–1980s caused widespread famine and long‑term land degradation; desertification is a major challenge across the Sahel.
- Dust Bowl, United States (1930s): prolonged drought + inappropriate ploughing led to massive soil erosion and loss of productive land in the Great Plains.
- Aral Sea, Central Asia: diversion of rivers for irrigation caused severe shrinkage of the sea, salinisation and desertification of the basin.
- Lake Chad, Africa: dramatic shrinkage since the 1960s due to climate variability and water withdrawals, causing desertification and livelihood loss.
- Marathwada and Vidarbha droughts, India: repeated monsoon failures, groundwater depletion and farmer distress (2010s–2020s); parts of Rajasthan show long‑term desertification from overgrazing and deforestation.
- China’s Loess Plateau: historic severe erosion and degradation followed by large-scale restoration (terracing, reforestation, sustainable agriculture) — a successful example of reversing land degradation.
- Water balance (simple form): P = Q + ET + ΔS (P = precipitation, Q = runoff, ET = evapotranspiration, ΔS = change in storage)
- Runoff coefficient: C = Q / P (ratio of runoff to precipitation over the same period)
- Aridity Index (UNEP): AI = P / PET (P = mean annual precipitation, PET = mean annual potential evapotranspiration); climatic classification examples: hyperarid AI < 0.05, arid 0.05–0.20, semiarid 0.20–0.50, dry subhumid 0.50–0.65)
- Standardized Precipitation Index (SPI) — standardized anomaly: SPI = (X - μ) / σ (X = precipitation for chosen accumulation period, μ = long‑term mean, σ = standard deviation); negative SPI indicates drought, positive indicates wet conditions)
- Simple soil moisture deficit (conceptual): SMD = FC - θ (SMD = soil moisture deficit, FC = field capacity, θ = current soil moisture content).
Landslides and Avalanches
Definition: Landslides are the downslope movement of rock, soil or debris under the influence of gravity. Avalanches are rapid flows of snow (sometimes mixed with ice and debris) down a mountain slope. Both are gravity-driven mass movements but differ in material, triggers, behaviour and seasonality.
Types:
- Landslides: rock fall, debris fall, rotational slide, translational slide, debris flow, earthflow, lateral spread.
- Avalanches: loose-snow avalanches (point-release), slab avalanches (cohesive slab breaks away), powder avalanches (fast, turbulent, low-density snow clouds).
Causes and Triggers:
- Natural causes: intense or prolonged rainfall, rapid snowmelt, earthquakes, volcanic activity, freeze–thaw cycles, slope steepness and geology.
- Human-induced causes: deforestation, excavation and undercutting of slopes, road construction, improper drainage, mining, loading slopes (buildings, waste).
- Common triggers: rainfall increasing pore-water pressure, seismic shaking reducing shear strength, snow loading or rain-on-snow for avalanches, sudden undercutting or blasting.
Process: A slope fails when driving forces (gravity component downslope, seismic inertia) exceed resisting forces (cohesion, friction, root reinforcement). Water reduces resisting forces by increasing pore pressure. Once initiated, mass accelerates, entrains material, and eventually deposits when slope or friction dissipates energy.
Impacts: loss of life and property, road/rail disruptions, dam/reservoir hazards (impoundment wave risk), deforestation and sedimentation of rivers, long-term economic and social consequences.
Mitigation and Preparedness:
- Structural measures: retaining walls, rock bolts and anchors, gabions, toe buttresses, catchment fences and snow nets, avalanche sheds and deflectors, drainage and slope benching.
- Non-structural measures: land-use zoning and hazard mapping, reforestation and bioengineering, early warning systems (rainfall thresholds, snowpack monitoring), controlled avalanches (artillery or explosives), public awareness and evacuation plans.
- Monitoring: inclinometer/strain gauges, pore-pressure sensors, remote sensing (satellite/airphoto/DEM), rainfall intensity-duration thresholds, snow stability tests (e.g., shear tests) for avalanche forecasting.
Differences (quick): Landslides commonly involve rock/soil, occur year-round, can be slow or rapid. Avalanches involve snow, are seasonal (winter–spring), and are often much faster with longer runout in powder avalanches.
School-level application: For Class 11 Geography, focus on types, causes, human role, case studies, and basic mitigation — understand how rainfall and human disturbance change slope stability and why mapping and early warning are essential.
- Oso (State of Washington, USA), 2014: A rapid landslide/mudflow killed 43 people; heavy preceding rainfall and prior slope instability were factors.
- Vajont Dam disaster (Italy), 1963: Massive landslide into a reservoir produced a wave that overtopped the dam and caused ~2000 deaths; highlights reservoir-induced slope failure.
- Uttarakhand floods and landslides (India), June 2013: Intense rainfall, glacier melt and human activities triggered widespread landslides and flash floods with thousands of casualties.
- Mount Everest avalanche, April 2014: A serac collapse and subsequent avalanche killed 16 Sherpas; shows glacier/snow instability hazards in high mountains.
- Galtür avalanche (Austria), 1999: A series of large snow avalanches struck the village of Galtür, killing 31 people; illustrates the destructive potential of slab/powder avalanches.
- Factor of Safety (general): FS = (Resisting forces) / (Driving forces). If FS < 1, slope failure is likely.
- Mohr–Coulomb shear strength: τ = c + σ' tan φ, where τ = shear strength, c = cohesion, σ' = effective normal stress, φ = angle of internal friction.
- Infinite-slope model (for shallow translational slides): FS = [c'/(γ z sinθ cosθ)] + [(tan φ')/(tan θ)], where c' = effective cohesion, γ = unit weight, z = failure plane depth, θ = slope angle, φ' = effective friction angle.
- Fahrböschung (runout angle): α = arctan(vertical drop / horizontal runout). Used to compare runout behavior of landslides/avalanches.
- Energy conversion (approximation): potential energy mgh converts toward kinetic energy ½mv^2 and frictional losses; useful for estimating runout and impact energy.
Biological Hazards (Epidemics and Pandemics)
Definition: Biological hazards are threats to human health caused by infectious agents (viruses, bacteria, parasites, fungi) and their toxins. When infections spread beyond expected levels in a population, they create an outbreak. A larger, geographically widespread event is called an epidemic, and when it crosses international borders affecting many countries or continents it is termed a pandemic. An endemic is a disease regularly present at a steady level in a location.
Difference (simple):
- Outbreak: Localized increase in cases.
- Epidemic: Larger rise in cases in a community/region above normal expectancy.
- Pandemic: Global spread of a new disease with sustained person-to-person transmission.
Causes and risk factors: Pathogen emergence (mutation, spillover from animals), global travel and trade, high population density and urbanization, poor sanitation and health systems, climate and environmental change (affecting vectors), poverty and malnutrition, weak surveillance.
Modes of transmission:
- Direct person-to-person (droplets, contact).
- Airborne (tiny aerosols that remain suspended).
- Fecal-oral route (contaminated water/food).
- Vector-borne (mosquitoes, ticks).
- Indirect contact via contaminated surfaces (fomites).
- Zoonotic spillover (animal to human).
Typical epidemic stages: Introduction (index case), acceleration (rising cases), peak, deceleration (fewer new cases), elimination or endemic equilibrium. Public-health actions aim to slow acceleration and lower the peak.
Impacts: Health system overload, increased morbidity and mortality, economic disruption (trade, tourism, supply chains), social impacts (school closures, movement restrictions), psychological effects, and long-term developmental setbacks.
Prevention, preparedness and control:
- Surveillance and early-warning systems (disease reporting, lab capacity).
- Case detection, testing, isolation and contact tracing.
- Quarantine and movement restrictions when needed.
- Vaccination campaigns and immunization programs.
- Non-pharmaceutical interventions: hand hygiene, masks, social distancing, safe burial practices.
- Health-system strengthening: hospital beds, PPE, trained workforce.
- Risk communication and community engagement.
- Global cooperation (WHO guidance, information sharing, vaccine access).
Scientific concepts to know (Class 11 level): Basic reproductive number (R0) — average number of secondary infections from one case in a fully susceptible population; incubation period; infectious period; herd-immunity threshold; epidemic curve (cases over time). Mathematical models (SIR-type) help predict spread and effects of interventions.
Role of Geography: Spatial patterns of outbreaks are influenced by human mobility, transportation networks, urban-rural differences, environmental conditions (temperature, rainfall affecting vectors), and socio-economic inequalities. Mapping and GIS support surveillance and resource planning.
- Spanish Flu (1918–1919) — pandemic that infected about one-third of the world and caused tens of millions of deaths.
- Cholera outbreaks — repeated epidemics in the 19th and 20th centuries linked to contaminated water; e.g., 1854 Broad Street outbreak (John Snow) showed waterborne transmission.
- HIV/AIDS (identified 1980s) — pandemic with long-term global impact, transmitted primarily through body fluids.
- SARS (2002–2003) — coronavirus epidemic with international spread but contained by public-health measures.
- H1N1 Influenza (2009) — pandemic with rapid worldwide spread but relatively low case-fatality compared with 1918 flu.
- Ebola (West Africa, 2014–2016) — severe epidemic with high case-fatality, revealed weaknesses in health systems and surveillance.
- Case Fatality Rate (CFR) = (Number of deaths from disease / Number of confirmed cases) × 100%
- Attack Rate = (Number of new cases in a period / Population at risk during that period) × 100%
- Basic Reproduction Number (R0) — conceptual; estimated from data. Herd-immunity threshold = 1 − 1/R0 (fraction of population needing immunity to stop spread).
- Exponential growth rate relation: Doubling time (Td) ≈ ln(2) / r, where r is the exponential growth rate of cases.
- Approximate growth rate from two counts: r ≈ (ln(C2) − ln(C1)) / (t2 − t1), where C1 and C2 are case counts at times t1 and t2.
- Simple SIR model (differential equations): dS/dt = −βSI, dI/dt = βSI − γI, dR/dt = γI. Here β = transmission rate, γ = recovery rate, and R0 = β/γ (in a fully susceptible population).
Human-induced Disasters
Definition: Human-induced disasters (also called anthropogenic disasters) are harmful events resulting directly or indirectly from human action, negligence, technological failure, or deliberate actions. They include industrial accidents, technological failures, pollution incidents, armed conflicts, and disasters amplified by poor planning and management.
Types:
- Industrial and technological accidents: chemical leaks, fires, explosions (e.g., gas leaks, factory fires).
- Transport accidents: major road, rail, air or maritime accidents causing mass casualties or environmental damage.
- Environmental degradation and pollution: air, water and soil pollution, oil spills, deforestation, desertification.
- Technological failures: dam collapses, nuclear accidents, infrastructure collapse.
- Conflict and violence: wars, terrorism, riots leading to humanitarian crises.
- Slow-onset human-induced events: urban flooding, water crises and droughts driven by mismanagement, land-use change and climate change.
Causes and contributing factors:
- Poor safety standards, lax regulation and non-compliance in industry.
- Faulty design, inadequate maintenance or aging infrastructure.
- Rapid unplanned urbanization and encroachment of hazard-prone areas.
- Environmental mismanagement (deforestation, wetland loss, poor waste disposal).
- Deliberate human actions such as armed conflict or terrorism.
- Anthropogenic climate change that amplifies natural hazards (e.g., stronger cyclones, sea-level rise).
Impacts: Human-induced disasters cause loss of life, injury, long-term health effects, displacement, economic loss, environmental contamination and degradation of ecosystems. They often disproportionately affect vulnerable groups and can trigger secondary hazards (e.g., fire after an industrial explosion, epidemics after conflict or displacement).
Risk factors and concepts:
- Hazard — the event or source of potential harm (e.g., chemical release).
- Exposure — people, assets or systems present in hazard zones.
- Vulnerability — susceptibility to harm due to socioeconomic, physical or environmental conditions.
- Capacity — resources and measures available to reduce impact or cope with events.
Prevention, mitigation and management:
- Strict regulation, safety audits, adherence to industrial standards and enforcement.
- Environmental Impact Assessments (EIA) and land-use planning to avoid high-risk siting.
- Early warning systems, emergency preparedness and response plans.
- Public awareness, training and community-based disaster risk reduction.
- Restoration and remediation of contaminated sites; long-term health monitoring.
Why it matters in Class 11 Geography: Understanding human-induced disasters helps students connect human activities, development choices and governance with disaster risk. It emphasizes the role of planning, technology, policy and behaviour in reducing disaster impacts.
- Bhopal Gas Tragedy, India (1984) — methyl isocyanate leak from a pesticide plant causing thousands of deaths and long-term health effects.
- Chernobyl Nuclear Disaster, Ukraine (1986) — nuclear reactor explosion and release of radioactive material with widespread environmental and health impacts.
- Deepwater Horizon Oil Spill, Gulf of Mexico (2010) — large-scale marine pollution from an offshore drilling rig blowout.
- Fukushima Daiichi Nuclear Accident, Japan (2011) — nuclear plant failure triggered by tsunami; example of compound natural + human-induced disaster consequences.
- Koyna Earthquake, India (1967) — reservoir-induced seismicity linked to filling of the Koyna Dam reservoir.
- Visakhapatnam Gas Leak (LG Polymers), India (2020) — styrene gas leak from a chemical plant that caused deaths, injuries and displacement.
- Risk = Hazard × Vulnerability (basic conceptual formula showing that risk increases with hazard and vulnerability).
- Risk = (Hazard × Vulnerability) / Capacity (emphasizes that greater capacity reduces overall risk).
- Population density = Population / Area (used to estimate exposure of people to a hazard in a given area).
- Dosage = Concentration × Exposure time (relevant for chemical/air pollution exposure assessment).
- Fatality rate = Number of fatalities / Exposed population (used to measure impact severity of an event).
Vulnerability, Risk Assessment and Mapping
Definition: Vulnerability is the susceptibility of people, infrastructure, economies and environment to harm from hazards. Risk assessment is the process of estimating the likelihood and consequences of hazardous events; mapping is the spatial portrayal of hazard, exposure, vulnerability and resulting risk to support planning and mitigation.
Key components:
- Hazard: the natural event (earthquake, cyclone, flood, landslide, drought, etc.) — characterized by intensity, frequency and location.
- Exposure: the elements at risk located in hazard-prone areas (population, buildings, infrastructure, crops).
- Vulnerability: degree to which exposed elements are likely to suffer damage — includes physical, social, economic and environmental dimensions.
- Capacity/Resilience: ability to cope, adapt and recover (early warning, shelters, health services, insurance).
Vulnerability types: physical (building quality, infrastructure), social (age, poverty, education), economic (dependence on a single livelihood), environmental (degraded land, deforestation).
Risk concept and approach: Risk integrates hazard, exposure and vulnerability. Typical steps in risk assessment are: (1) hazard identification and characterization, (2) exposure analysis (who/what is in harm's way), (3) vulnerability analysis (how badly will they be affected), (4) capacity assessment, (5) risk estimation, (6) risk communication and prioritization for action.
Mapping methods and tools: GIS and remote sensing are core tools. Common outputs are hazard maps (zones by intensity/probability), exposure maps (population/buildings), vulnerability maps (indices or classes), and combined risk maps (heatmaps or classified risk zones). Techniques include overlay analysis, weighted multi-criteria analysis (WMCA), statistical/empirical modelling, and susceptibility modelling (e.g., landslide or flood inundation models).
Typical workflow for a vulnerability/risk map (weighted overlay example):
- Select indicators (e.g., population density, building type, elevation/slope, distance to river, poverty rate).
- Normalize indicators (transform to common scale, e.g., 0–1).
- Assign weights based on importance (expert judgment or analytic hierarchy process).
- Compute vulnerability index: VI = Σ(w_i × normalized_i).
- Classify results into categories (low/medium/high) and combine with hazard layer to produce a risk map.
Data sources and validation: Census and socio-economic surveys, building inventories, historical disaster records, satellite imagery (DEM, land use), meteorological data, field surveys. Validation and ground-truthing with local stakeholders are essential.
Use in planning: Risk maps guide land-use planning, zoning, early warning investments, retrofitting priorities, evacuation routes and disaster preparedness. They must be updated regularly to reflect urban growth, climate change and mitigation measures.
- 2004 Indian Ocean tsunami: coastal communities with high exposure, poor early warning and weak infrastructure showed high vulnerability; post-disaster mapping led to improved early warning systems and coastal zoning.
- 2013 Uttarakhand floods and landslides: steep slopes, deforestation, unplanned construction and pilgrimage-related exposure increased vulnerability; landslide susceptibility and vulnerability maps identified high-risk valleys for priority action.
- Cyclone risk mapping on India’s east coast (e.g., Odisha 1999): overlaying cyclone hazard zones with population and shelter capacity maps guided evacuation planning and led to construction of cyclone shelters and early warning improvements.
- Urban flood risk in Delhi: mapping of drainage, impervious surfaces, and low-lying neighborhoods identified hotspots for stormwater management and green infrastructure interventions.
- Landslide susceptibility mapping in the Western Ghats/North-east: combining slope, geology, land use and rainfall to produce vulnerability maps used to regulate hillside construction and plan stabilization works.
- Risk (general) = Hazard × Vulnerability × Exposure
- Risk score (matrix) = Likelihood × Impact (where both are scored and multiplied to prioritize events)
- Expected Annual Loss (EAL) = Σ (P_i × L_i), where P_i = probability of event i and L_i = estimated loss from event i
- Normalization (min–max) for indicator x: x' = (x - x_min) / (x_max - x_min)
- Vulnerability Index (weighted): VI = Σ (w_i × x'_i) where w_i are weights summing to 1 and x'_i are normalized indicators
Disaster Preparedness and Mitigation Measures
Overview
Disaster preparedness and mitigation measures are actions taken to reduce the impact of natural hazards (earthquakes, floods, cyclones, landslides, droughts, tsunamis) and to ensure communities can respond and recover quickly. Preparedness focuses on planning, capacity building and readiness before an event; mitigation focuses on reducing risk through long‑term structural and non‑structural actions.
Objectives
- Reduce loss of lives and property.
- Minimise disruption to livelihoods and economy.
- Increase community resilience and faster recovery.
Key elements
- Risk assessment and hazard mapping: Identify hazard types, exposure, vulnerability and create hazard zonation maps to guide planning.
- Early warning systems: Monitoring networks, forecasting, alert dissemination and clear standard operating procedures for evacuation.
- Land‑use planning and building codes: Restrict construction in high‑risk zones; enforce seismic, cyclone and flood‑resistant designs.
- Structural measures: Dams, levees, sea walls, storm surge barriers, retrofitting buildings, slope stabilization.
- Non‑structural measures: Public awareness, education, drills, insurance, evacuation plans, contingency stockpiles and legal instruments.
- Community preparedness: Local disaster committees, first‑aid training, evacuation routes, safe shelters, school‑based drills.
- Ecosystem‑based approaches: Mangrove restoration for storm surge protection, afforestation to reduce landslide risk, wetland conservation to attenuate floods.
- Institutional arrangements: Clear roles for national/state/local agencies, coordination mechanisms, communication protocols and post‑disaster recovery plans.
Preparedness cycle (simple)
Mitigation → Preparedness (plans, training, early warning) → Response (evacuation, relief) → Recovery (reconstruction, rehabilitation) → Mitigation (improve resilience)
Examples of effective measures
- Japan: Strict seismic building codes, earthquake early warning system and regular drills reduce casualties despite frequent quakes.
- Netherlands: Delta Works and flood management combine hard infrastructure and spatial planning to protect lowlands.
- Bangladesh: Cyclone shelters, community preparedness and an early warning network have cut cyclone deaths dramatically since the 1970s.
- California/USA: Seismic retrofitting of critical infrastructure, land‑use planning and public education.
Cost‑effectiveness
Mitigation often yields high returns: investments in prevention and preparedness save larger losses during disasters. Example: commonly cited studies estimate several dollars saved per dollar spent on mitigation (values vary by study and context).
Principles for school/CBSE context
- Multi‑hazard approach — plan for more than one hazard.
- Community participation — involve local people in planning and drills.
- Scientific grounding — use hazard maps, observations and forecasts for decisions.
- Regular revision — update plans, codes and maps using latest data and lessons learned.
- Japan: Strict building codes, base isolation and nationwide earthquake early warning system that issue alerts seconds before strong shaking reaches populated areas.
- Netherlands: Delta Works — a series of dams, sluices and storm surge barriers protecting large coastal areas from flooding.
- Bangladesh: Cyclone shelters, improved forecasting, community volunteers and evacuation planning that reduced cyclone mortality rates dramatically since the 1970s.
- California, USA: Seismic retrofitting of bridges and hospitals, land‑use zoning in high‑risk areas and regular earthquake drills (‘ShakeOut’).
- Mangrove restoration in coastal India: Natural buffer reduces wave energy and protects shoreline settlements during storms.
- Return period (recurrence interval): T = (n + 1) / m — where n = years of record, m = rank of a specific event. Annual probability P = 1 / T.
- Gutenberg–Richter earthquake frequency relation: log10 N = a − bM — N is number of earthquakes ≥ magnitude M; a and b are empirical constants.
- Factor of Safety for slope stability: FS = (sum of resisting forces) / (sum of driving forces). If FS > 1 slope is (theoretically) stable; FS ≤ 1 indicates failure risk.
- Manning’s equation for open channel flow (flood assessment): Q = (1 / n) A R^(2/3) S^(1/2) — Q = discharge, n = Manning’s roughness, A = cross‑sectional area, R = hydraulic radius, S = slope.
- Dynamic wind pressure: p = 0.5 ρ V^2 ≈ 0.613 V^2 (N/m²) — ρ ≈ 1.225 kg/m³ at sea level; V = wind speed (m/s). Used in designing wind‑resistant structures.
- Seismic base shear (simplified): V = Cs × W — V is design base shear, Cs is seismic response coefficient, W is building weight.
Disaster Response, Recovery and Rehabilitation
Introduction: Disaster Response, Recovery and Rehabilitation are three sequential but overlapping phases of disaster management that restore normal life after a natural hazard. They form part of the disaster management continuum, bridging immediate life-saving actions and long-term reconstruction that reduces future risk.
1. Response (Immediate and Short-term):
- Objective: Save lives, reduce suffering, protect property, and prevent secondary hazards.
- Timeframe: Minutes to weeks after the event.
- Key activities: search and rescue; first aid and emergency medical care; evacuation and temporary shelter; distribution of food, potable water and sanitation; emergency repairs to critical infrastructure (roads, bridges, power); clearing debris; rapid needs and damage assessment; law and order; information, communication and family tracing.
- Institutions and resources: National and state disaster response forces (e.g., NDMA/NDRF/SDRF in India), armed forces, local administration, police, health services, NGOs and community volunteers.
2. Recovery (Medium-term):
- Objective: Restore services, livelihoods and infrastructure so communities can function again and begin to rebuild.
- Timeframe: Weeks to months (sometimes years depending on scale).
- Key activities: repair and restoration of utilities (water, electricity, communications); rehabilitation of hospitals and schools; re-establishing markets and livelihoods; transitional housing and upgrading temporary shelters; psychosocial support and public health interventions; reconstruction planning and resource mobilization; updating risk assessments and land-use planning.
- Principles: Build back better (resilience), community participation, equity (prioritise vulnerable groups), and integration of Disaster Risk Reduction (DRR) into reconstruction.
3. Rehabilitation and Reconstruction (Long-term):
- Objective: Long-term reconstruction of housing, public buildings, infrastructure and restoration of social and economic systems at or above pre-disaster standards with reduced vulnerability.
- Timeframe: Months to many years.
- Key activities: permanent housing reconstruction, retrofitting buildings and infrastructure, land-use planning and relocation where necessary, restoring livelihoods through training and credit, ecosystem-based recovery (mangrove restoration, watershed management), institutional reforms and legislation to strengthen preparedness and DRR.
Cross-cutting aspects:
- Coordination mechanisms (incident command systems, unified command, coordination clusters).
- Finance and insurance: disaster funds, international aid, insurance payouts, public-private partnerships.
- Monitoring and evaluation: recovery indicators, safeguards and audits.
- Community involvement: local knowledge speeds response and ensures relevant recovery measures.
- Gender, age and disability sensitivity in planning and implementation.
Why planning matters: Effective response and faster recovery depend on preparedness (early warning systems, pre-positioned supplies, contingency plans), clear roles and trained personnel. Rehabilitation that integrates DRR reduces long‑term losses and improves resilience to future events.
Summary: Response focuses on immediate life-saving and stabilizing activities; recovery restores services and livelihoods; rehabilitation and reconstruction rebuild the physical, social and economic fabric in ways that reduce future risk. Together they form a cycle linked back to mitigation and preparedness.
- 2004 Indian Ocean Tsunami: Immediate international search-and-rescue and relief supplies; long-term reconstruction included tsunami warning systems and coastal zoning.
- 2015 Nepal Earthquake: Massive emergency response (search, medical camps), medium-term sheltering and reconstruction with seismic retrofitting and updated building codes.
- 2013 Uttarakhand Floods (India): Emergency evacuations and rescue by armed forces and NDRF; long-term debates on land-use planning, road rebuilding and ecosystem restoration.
- 2019 Cyclone Fani (Odisha, India): Early warning and pre-emptive evacuation reduced casualties; recovery included restoration of power, roads and livelihood support for coastal communities.
- 2015–2018 Kerala Floods (India): Short-term relief, medium-term restoration of infrastructure and long-term focus on floodplain management and improved reservoir operation protocols.
- Risk = Hazard × Exposure × Vulnerability
- Resilience Index (simple) R = (Post-disaster functional level) / (Pre-disaster functional level). Value 0–1; higher is better.
- Recovery Rate = (Function regained) / (Time taken) — used to compare speed of recovery across sectors.
- Estimated households affected = Population affected / Average household size
- Required temporary water (minimum emergency standard) = Population × 15–20 liters per person per day
- Total Economic Loss = Direct Losses + Indirect Losses (e.g., business interruption, supply-chain effects)
Institutional Framework and Policies (India)
Overview
The institutional framework and policies for disaster management in India define how the country prepares for, mitigates, responds to and recovers from natural hazards and disasters. Since the major disasters of the late 20th century and early 21st century, India has moved from an ad-hoc relief-based approach to a structured, law-backed, multi-level system emphasizing prevention, mitigation, preparedness and community participation.
Key legal and policy milestones
- Disaster Management Act, 2005 – provides the legal basis for a multi-tiered institutional mechanism and mandates disaster management planning at national, state, district and local levels.
- National Policy on Disaster Management, 2009 – lays down the guiding principles, including mitigation, vulnerability reduction and community preparedness.
- National Disaster Management Plan (first prepared 2016; periodically updated) – operational framework across sectors for prevention, mitigation, preparedness, response and recovery.
- International frameworks influencing India: Hyogo Framework (2005) and Sendai Framework for Disaster Risk Reduction (2015) – emphasise disaster risk reduction (DRR) and resilience.
Main institutions and their roles
- National Disaster Management Authority (NDMA) – chaired by the Prime Minister; formulates national policies, guides and coordinates disaster management, issues guidelines and approves national plans.
- State Disaster Management Authority (SDMA) – chaired by the State Chief Minister; prepares state disaster management plans and coordinates state-level mitigation and preparedness.
- District Disaster Management Authority (DDMA) – district-level authority (often chaired by the District Magistrate/Collector) responsible for district disaster planning, coordination of response and implementation of mitigation measures.
- National Disaster Response Force (NDRF) – specialised, centrally trained rescue teams for on-field response and search-and-rescue operations.
- National Institute of Disaster Management (NIDM) – capacity building, training, research and knowledge dissemination.
- Sectoral agencies – e.g., Indian Meteorological Department (IMD) for early warnings, Central Water Commission (CWC) for floods, Geological Survey of India (GSI) for seismic information, Coast Guard and state departments for coastal hazards.
- Local bodies and communities – Panchayats, municipalities and community groups are mandated to prepare local disaster management plans and lead first-response actions.
Organisational features and coordination
- Multi-level vertical structure (national → state → district → local) with statutory responsibilities defined by law.
- Horizontal coordination across ministries (health, home, agriculture, urban development) for multisectoral disaster planning.
- Emphasis on decentralisation and community-based disaster risk reduction—local plans, early warning dissemination, volunteers and capacity building.
- Funding mechanisms: State Disaster Response Fund (SDRF) and National Disaster Response Fund (NDRF - financial instrument), along with special mitigation projects and central scheme funding.
Policies and operational strategies
- Risk assessment and hazard mapping: carried out by technical agencies (IMD, GSI, CWC) and used to guide land-use planning and mitigation investments.
- Early warning systems and communication: IMD’s cyclone/flood forecasts, mass-media alerts, community sirens, and mobile alerts coordinated through NDMA/SDMA.
- Preparedness and capacity building: NDRF and state response forces, mock drills, training by NIDM, school/college awareness campaigns.
- Mitigation projects: structural measures (cyclone shelters, river embankments) and non-structural measures (building codes, retrofitting, public awareness).
- Recovery and rehabilitation: guidelines for post-disaster recovery, livelihood restoration, reconstruction norms and financial assistance procedures.
Principles emphasised in Indian policy
- Proactive risk reduction rather than reactive relief.
- Decentralisation and local empowerment.
- Multi-sectoral coordination and scientific inputs.
- Community participation and inclusive planning for vulnerable groups.
- Integration of disaster risk reduction in development planning.
Challenges
- Implementation gaps between policy and local action, especially in resource-poor districts.
- Coordination delays in multi-agency response during complex disasters.
- Capacity and funding constraints at local government levels.
- Urbanisation pressures and land-use changes increasing exposure of people and assets.
Conclusion
India’s institutional framework and policies have matured substantially since 2005, building a statutory multi-tier system supported by specialised response forces, technical agencies and capacity-building institutions. Continued emphasis on local-level planning, scientific risk information and integration of DRR into development will strengthen resilience further.
- Odisha cyclones: 1999 Super Cyclone caused ~10,000+ deaths; after institutional reforms and investment in early warning and evacuation (NDMA, SDMA, cyclone shelters), Phailin (2013) saw large-scale evacuations and deaths reduced dramatically (~44 deaths), illustrating improved preparedness.
- Kerala floods 2018: DDMA, state agencies and NDRF deployment showed active multi-agency response, while post-event reviews highlighted the need for better land-use regulation and watershed management.
- Tsunami (2004): Exposed gaps in early warning and coordination; contributed to creation of tsunami warning systems and later reforms in national disaster management architecture.
- NDRF deployments: NDRF teams regularly deployed across states for floods, earthquakes and cyclones — an operational example of centrally trained response forces in action.
- Local-level planning: Many Panchayats prepare Village Disaster Management Plans (VDMPs) outlining evacuation routes, vulnerable households and local resources as mandated by the DM Act.
- Disaster Risk (simple) = Hazard × Vulnerability
- Disaster Risk (with exposure and capacity) = Hazard × Vulnerability × Exposure / Capacity (or more qualitatively: Risk increases with hazard, vulnerability and exposure and decreases with capacity and resilience).
- Basic preparedness metric (conceptual) — Response Time Impact: Mortality ∝ 1 / (Warning Lead Time × Evacuation Efficiency) (illustrative relation showing faster warnings and efficient evacuation reduce mortality; not a strict empirical formula but useful for planning).
Community-based Disaster Management and Capacity Building
Definition: Community-based Disaster Management (CBDM) is a people-centred approach that empowers local communities to assess, plan for, respond to, and recover from disasters. Capacity building means strengthening the skills, resources, institutions and networks at the community level to reduce risk and increase resilience.
Why CBDM matters: Communities are first responders. Local knowledge, social networks and immediate actions save lives and reduce losses. CBDM makes disaster risk reduction (DRR) sustainable by involving those most affected in planning and decision-making.
Key components:
- Hazard, vulnerability and capacity assessment (HVCA/VCA): participatory mapping of hazards, exposed assets and local strengths.
- Risk reduction and mitigation: local measures (e.g., raised platforms, flood embankments, safe houses, retrofitting schools).
- Preparedness: early warning systems, evacuation plans, shelters, emergency kits, drills and SOPs.
- Response: community emergency teams, first aid, search & rescue and coordination with external agencies.
- Recovery and rehabilitation: community-led reconstruction, livelihood restoration and psychosocial support.
Steps in a CBDM cycle: 1) Engage and mobilize community; 2) Conduct VCA; 3) Prioritize risks and plan interventions; 4) Build capacities through training and resource provision; 5) Implement DRR measures; 6) Practice through drills; 7) Monitor, evaluate and revise plans.
Capacity-building activities: training in first aid, building and retrofitting techniques, early-warning interpretation, community-based search & rescue, stockpiling essentials, creating local funds and insurance groups, and strengthening local institutions (panchayats, schools, women’s groups).
Principles: participation and ownership, use of local knowledge, gender and social inclusion, integration with development planning, sustainability and local resource mobilisation.
Link with formal systems: CBDM should be connected to municipal, district and national disaster management plans and to meteorological and warning agencies, so local actions complement state response and technical early warnings.
- Odisha (India): After the 1999 Super Cyclone, community-based measures including coastal shelters, cyclone warning dissemination using local volunteers, and clear evacuation routes reduced fatalities in subsequent cyclones (e.g., Cyclone Phailin, 2013).
- Bangladesh: Community cyclone shelters, trained local volunteers and village-level early warnings have dramatically reduced cyclone mortality over decades.
- Kerala floods (2018): Local volunteers, fisherfolk and community groups carried out rapid rescues and provided relief before external help arrived, showing strength of community response networks.
- Nepal earthquake (2015): Community search-and-rescue teams and local training saved lives in remote villages; community-led rebuilding with safer construction techniques improved resilience.
- Japan: Regular community drills, local hazard maps and neighborhood disaster response groups (tonarigumi-like systems) support rapid organized response to earthquakes and tsunamis.
- Risk = Hazard × Exposure × Vulnerability. (Conceptual formula used to estimate disaster risk; capacity reduces vulnerability.)
- Risk (conceptual) = (Hazard × Vulnerability) / Capacity. (Shows how higher capacity lowers effective risk.)
- Return period (T) = (N + 1) / M. Where N = number of years of record, M = rank of a particular event by magnitude. Probability of exceedance in a year P = 1 / T. (Used in flood and storm frequency analysis.)
- Exposure (simple) = Number of assets × Value per asset. (Used to estimate economic exposure for community assets and plan mitigation.)
International Frameworks and Links with Development
Overview
International frameworks provide guidance, targets and coordinated actions to reduce disaster risk and integrate disaster risk reduction (DRR) into development planning. Disasters both result from and affect development: development choices change exposure and vulnerability, while disasters reverse development gains. Effective DRR makes development sustainable and resilient.
Key international frameworks (short summary)
- Yokohama Strategy (1994) – early global effort stressing risk assessment, prevention and preparedness linked to development planning.
- Hyogo Framework for Action (HFA) 2005–2015 – five priorities: (1) ensure DRR is a national priority, (2) identify &monitor risk, (3) use knowledge/education, (4) reduce underlying risk factors (mainstreaming into development), (5) strengthen preparedness for response.
- Sendai Framework for Disaster Risk Reduction 2015–2030 – successor to HFA. Focus: understand risk, strengthen governance, invest in DRR, enhance preparedness & 'Build Back Better'. Four priorities and seven global targets (reduce mortality, affected people, economic loss, damage to infrastructure, increase DRR strategies, international cooperation, early warning systems).
- Sustainable Development Goals (SDGs) – several goals explicitly link to DRR (SDG 1, 11, 13, 9) and call for resilient infrastructure, poverty reduction and climate action.
- Paris Agreement & Climate Frameworks – link climate change adaptation with DRR; many hazards are climate-related, so adaptation finance and mitigation affect disaster outcomes.
How international frameworks connect to development
- Mainstreaming DRR: integrating risk assessment and mitigation measures into urban planning, infrastructure design, agriculture and social services so development does not create new risks.
- Policy and governance: national/local DRR strategies prompted by Sendai/HFA improve institutions, laws and building codes (e.g., seismic codes in earthquake-prone countries).
- Financing and investments: international funds (World Bank, GFDRR, Green Climate Fund) support resilience projects; cost–benefit analysis often justifies upfront DRR spending to avoid larger future losses.
- Capacity building and knowledge transfer: international cooperation shares early warning technology, risk mapping, training and post-disaster recovery practices.
- Link to poverty reduction: disasters disproportionately affect the poor; reducing risk supports livelihoods and prevents development setbacks.
- Resilient infrastructure and urbanisation: standards and investments promoted by frameworks reduce future economic losses from disasters in rapidly urbanising regions.
Instruments and actors
- UNDRR (United Nations Office for Disaster Risk Reduction), IFRC/Red Cross, World Bank/GFDRR, UNDP, WHO and regional bodies.
- International funding mechanisms, insurance and public–private partnerships that support DRR and post-disaster recovery.
Practical outcomes promoted by frameworks
- National and local DRR strategies implemented
- Multi-hazard early warning systems established
- Risk-informed land-use planning and resilient building codes adopted
- Investment in social safety nets and resilient infrastructure
Takeaway
International frameworks create a shared agenda and measurable targets so that development policy reduces exposure and vulnerability. Following these frameworks helps countries protect development gains, reduce humanitarian costs and promote sustainable growth.
- Bangladesh cyclones: Improved early warning, cyclone shelters and community preparedness (driven by national policies and international support) reduced cyclone death tolls dramatically despite similar storm strength.
- Japan earthquake-resilient infrastructure and strict building codes (national policy influenced by global-best practice) reduce fatalities and protect critical services during major earthquakes.
- 2004 Indian Ocean tsunami: Massive loss prompted creation of the Indian Ocean Tsunami Warning System and increased regional cooperation on early warning and disaster preparedness.
- 2015 Nepal earthquake: Highlighted link between weak infrastructure, poverty and high disaster impacts; post-disaster recovery plans emphasized 'Build Back Better' in line with Sendai principles.
- Haiti 2010 earthquake: Demonstrated how poor governance, poverty and lack of resilient infrastructure increase long-term development setbacks; international aid and frameworks guided recovery and DRR planning.
- Disaster Risk = Hazard × Exposure × Vulnerability (common operational formulation used in DRR planning).
- Alternative simple form: Risk = Hazard × Vulnerability (capacity inversely related to vulnerability).
- Expected Annual Loss (EAL) = Σ (Probability of event i × Loss if event i occurs) over all events.
- Return period (T) for ranked events: T = (n + 1) / m where n = number of years of record, m = rank of event (used for estimating frequency of hazard events).
- Economic loss as percentage of GDP = (Disaster loss / GDP) × 100. Useful to quantify development impact.
- Benefit–Cost Ratio (BCR) for DRR investment = Expected avoided losses due to DRR / Cost of DRR intervention. A BCR > 1 indicates investment is economically justified.
Case Studies and Examples
Case studies in the chapter Natural Hazards and Disasters illustrate how specific events happen, why they cause damage, and which measures reduce impacts. A well-structured case study examines: background (where and when, hazard type and magnitude), physical cause (geological or meteorological trigger), vulnerability (population density, building quality, land use), impacts (human, economic, environmental), response (early warning, evacuation, relief) and lessons learnt (mitigation and policy changes).
Approach to analysing a case study:
- Hazard description: type (earthquake, cyclone, flood, landslide, tsunami, volcanic eruption), magnitude/intensity and spatial extent.
- Physical causes: tectonic setting, weather system, or slope saturation that produced the event.
- Vulnerability and exposure: socioeconomic factors, land-use practices, infrastructure quality and preparedness level that determine impact.
- Impacts: casualties, injuries, displacement, economic loss, environmental degradation.
- Response and recovery: early warning, search and rescue, relief, rehabilitation and long-term risk reduction measures.
- Lessons and mitigation: building codes, land-use planning, ecosystem-based measures (mangroves, forests), community preparedness and institutional arrangements.
Using these components for systematic comparison (e.g., a comparison of two earthquakes or a cyclone vs a flood) helps students understand why similar hazards have different outcomes in different places and the role of disaster risk reduction.
- Gujarat (Bhuj) Earthquake, India, 2001 — Mw ≈ 7.7. Causes: strike-slip faulting on the Kutch fault. Impacts: ~20,000 deaths, extensive collapse of weak masonry buildings. Lessons: need for seismic-resistant construction, retrofitting and building-code enforcement.
- Kashmir Earthquake, South Asia, 2005 — Mw ≈ 7.6. Causes: north–south thrusting along the Himalayan collision zone. Impacts: tens of thousands killed and injured, landslides blocking roads. Lessons: mountain terrain increases landslide risk and complicates relief; importance of rapid medical response and winterised shelter.
- Nepal (Gorkha) Earthquake, 2015 — Mw 7.8. Causes: rupture on the Main Himalayan Thrust. Impacts: large-scale urban and rural damage, cultural heritage loss, aftershocks. Lessons: retrofitting historic buildings, community preparedness, coordinated international assistance.
- Indian Ocean Tsunami, 2004 (Sumatra) — Mw 9.1–9.3 and resulting tsunami. Causes: massive megathrust earthquake off Sumatra. Impacts: ~230,000 deaths across Indian Ocean rim, huge coastal destruction (Andaman & Nicobar, Tamil Nadu). Lessons: need for regional tsunami warning systems, coastal land-use planning and community education.
- Odisha Supercyclone, India, 1999 — very high winds and storm surge. Impacts: large loss of life and property. Lessons: improved early warning, cyclone shelters and evacuation planning dramatically reduced casualties in later cyclones (e.g., Cyclone Fani 2019).
- Cyclone Fani, India, 2019 — strong cyclone making landfall in Odisha. Impacts: considerable property damage but low casualty rate due to early warnings, effective evacuation and use of cyclone shelters — example of successful mitigation and preparedness.
- Moment magnitude (earthquake): Mw = (2/3) log10(M0) - 10.7 — where M0 is seismic moment in N·m. (Gives a stable measure for large quakes.)
- Return period (average recurrence interval): R = 1 / p — where p is the annual probability of occurrence. (If an event has a 0.01 annual chance, R = 100 years.)
- Flood discharge (continuity): Q = A × v — Q: discharge (m^3/s), A: cross-sectional area (m^2), v: mean velocity (m/s). Useful for analysing hydrographs and peak flow.
- Tsunami phase speed (shallow-water approximation): c = sqrt(g × h) — g ≈ 9.81 m/s^2, h = water depth (m). (Shows tsunamis travel faster in deeper water.)
- Factor of Safety (slope stability): FS = Resisting forces / Driving forces — FS > 1 stable, FS ≤ 1 failure likely. Useful for landslide risk assessment.
Tools and Techniques for Hazard Monitoring
Purpose: Hazard monitoring is the continuous observation of natural processes (earthquakes, volcanoes, cyclones, floods, landslides, tsunamis) to detect precursors, estimate timing/intensity, and issue warnings to reduce loss of life and property.
Categories of tools and techniques
- Seismic monitoring: Seismographs and seismometer networks record ground motion as seismograms. Networks (local, regional, global) provide location, depth and magnitude of earthquakes. Modern arrays feed automatic detection and early warning systems.
- Deformation monitoring: Continuous GPS, tiltmeters, strainmeters and leveling detect ground movement and deformation before/after earthquakes and volcanic events. InSAR (satellite radar interferometry) maps ground displacement over wide areas.
- Volcano monitoring: Combines seismicity, gas measurements (SO2, CO2), thermal infrared imaging, ground deformation (GPS, tilt) and visual/photographic observations to detect magma movement and eruptive activity.
- Ocean and tsunami monitoring: Tide gauges, deep-ocean DART (Deep-ocean Assessment and Reporting of Tsunamis) buoys and coastal sea-level sensors detect anomalous sea-level changes. Tsunami warning centers use seismic and sea-level data plus propagation models.
- Hydro-meteorological monitoring: Rain gauges, weather satellites, Doppler and pulse radar, river-stage gauges and streamflow monitoring (discharge measurements) are used for flood forecasting and cyclone tracking.
- Landslide monitoring: Inclinometers, extensometers, pore-pressure sensors, ground-based LiDAR and repeated photogrammetry detect slope movement and soil moisture changes that precede failures.
- Remote sensing & GIS: Satellite imagery (optical, thermal, multispectral), SAR (synthetic aperture radar) and LiDAR are used for mapping hazards, change detection, burn scars, flood extent and post-event damage assessment. GIS integrates multi-source data for hazard zonation and risk maps.
- Early warning systems and communication: Automatic triggers, threshold-based alerts, sirens, SMS/phone alerts, media and community-based networks deliver warnings. Effective systems combine monitoring, modelling and communications plans.
How tools work together (workflow): Sensors & satellites collect real-time data → data transmission to monitoring centers → automatic/manual analysis and modelling (earthquake location, tsunami propagation, flood hydrographs, ash dispersion) → impact assessment and issuance of warnings → dissemination to authorities and public.
Strengths and limitations: Ground sensors give high temporal resolution but limited spatial coverage; satellites give broad coverage but lower temporal resolution or cloud interference (for optical). Models reduce uncertainty but depend on quality of input data. Community observation complements instruments where networks are sparse.
Why multi-parameter monitoring? Many hazards produce multiple precursors (e.g., volcanoes show seismicity, gas release and deformation). Combining datasets reduces false alarms and improves reliability of warnings.
- 2004 Indian Ocean tsunami: Seismic networks detected the undersea megathrust earthquake; DART buoys and coastal tide gauges provided sea-level observations used in tsunami travel-time modelling. Lack of a regional warning system contributed to high casualties—led to improved Indian Ocean tsunami warning systems.
- 2015 Nepal earthquake: Dense seismic data, continuous GPS and InSAR were used to map the rupture and surface deformation, improving understanding of strain release and aftershock hazards.
- 2010 Eyjafjallajökull (Iceland) eruption: Combination of seismic monitoring, gas measurements, thermal satellite imagery and ash-detection satellites allowed forecasts of ash dispersion that guided aviation restrictions.
- Cyclone tracking (e.g., North Indian Ocean cyclones): Weather satellites (INSAT), Doppler radars, buoys and numerical weather prediction models provide position, intensity and forecast track for warnings and evacuation planning.
- Uttarakhand 2013 floods and landslides: Rain gauge networks, river-stage monitoring and satellite imagery were used in post-event analysis and for improving early warning and land-use planning.
- Moment magnitude (Mw): Mw = (2/3) * (log10(M0) - 9.1), where M0 is seismic moment in N·m. Example: if M0 = 1×10^18 N·m, Mw ≈ (2/3)*(18 - 9.1) ≈ 5.9.
- Richter/local magnitude (simplified): ML = log10(A) - log10(A0(Δ)), where A is maximum seismic amplitude and A0(Δ) is an empirical distance correction function.
- Energy released by an earthquake (approx.): log10(E) = 4.8 + 1.5M, where E is energy in joules and M is magnitude.
- Tsunami shallow-water wave speed: c = sqrt(g * d), where g ≈ 9.81 m/s^2 and d is water depth (m). Example: in 4000 m depth, c ≈ sqrt(9.81*4000) ≈ 198 m/s (~713 km/h).
- Flood discharge (continuity): Q = A * V, where Q is discharge (m^3/s), A is cross-sectional area (m^2), V is velocity (m/s).
- Return period (recurrence interval) for discrete events: R = (n + 1) / m, where n = years of record and m = number of events. Example: in 50 years with 5 floods, R ≈ (50+1)/5 = 10.2 years.
Environmental and Socio-economic Impacts
Overview
Environmental and socio‑economic impacts describe how natural hazards and disasters affect ecosystems, natural resources, human lives, infrastructure and the economy. Impacts vary by hazard type, intensity, exposure and the vulnerability of the affected population or environment.
Environmental impacts
- Habitat and biodiversity loss: Destruction of forests, coral reefs, wetlands and wildlife habitat (e.g., tsunamis, cyclones, wildfires).
- Soil and land degradation: Erosion, landslides and salinization reduce agricultural productivity.
- Water quality and hydrology changes: Contamination of drinking water, groundwater recharge disruption, sedimentation in rivers and reservoirs.
- Air pollution: Ash and smoke from wildfires and volcanic eruptions; dust from storms.
- Long‑term landscape alteration: Coastal erosion, river channel changes, loss of protective ecosystems (mangroves, dunes).
Socio‑economic impacts
- Human casualties and health effects: Deaths, injuries, disease outbreaks, mental health impacts.
- Displacement and migration: Temporary shelters, long‑term relocation, urban migration.
- Damage to infrastructure and services: Roads, bridges, hospitals, schools, water and power supply interruptions.
- Economic losses: Direct losses (buildings, crops, livestock) and indirect losses (business interruption, lost wages, reduced GDP).
- Livelihood disruption: Loss of agriculture, fisheries, tourism and informal sector income, increasing poverty and inequality.
- Social systems: Education interrupted, strain on governance, increased vulnerability of marginalised groups (women, children, elderly).
Determinants of impact
The scale of impacts depends on: hazard intensity and frequency; exposure (people, assets) present in the hazard zone; vulnerability (building quality, preparedness, socio‑economic status); and capacity for response and recovery.
Reducing impacts
Mitigation measures (land‑use planning, engineered protection, ecosystem‑based solutions), early warning systems, resilient infrastructure and social safety nets reduce both environmental damage and socio‑economic losses. Cost‑benefit analysis often shows mitigation investments save far more than post‑disaster relief.
CBSE examination focus
Students should be able to: list environmental and socio‑economic impacts of principal hazards (earthquakes, floods, cyclones, droughts, landslides, wildfires, tsunami), explain causal links (how a hazard produces particular impacts), and give illustrated examples from India and the world.
- 2004 Indian Ocean tsunami: Massive coastal ecosystem destruction (mangroves, coral reefs), ~230,000 deaths across countries, long‑term displacement and loss of fisheries livelihoods in affected Indian coastal communities.
- 2015 Nepal earthquake: Severe damage to housing and heritage sites, landslides altered slopes and rivers, thousands killed, many rendered homeless and dependent on relief; GDP growth slowed and tourism dropped sharply.
- 2013 Uttarakhand (India) flash floods: Mountain ecosystem damage, extensive soil erosion and debris‑filled rivers, hundreds of deaths, large numbers of pilgrims and residents displaced, road and hydroelectric infrastructure destroyed.
- 2019–20 Australian bushfires: Millions of hectares burned, huge losses of wildlife and habitat, air quality crisis affecting health, tourism decline and economic losses estimated in billions USD.
- 2015 Chennai floods (Tamil Nadu): Urban flooding contaminated water supplies, disrupted industry and IT services, extensive property damage and many displaced households, highlighting vulnerability from poor urban drainage and unplanned development.
- Risk = Hazard × Vulnerability × Exposure — qualitative formula used to conceptualize disaster risk (higher values mean greater potential impacts).
- Annual Expected Loss (AEL) = Σ (Pi × Li) — where Pi = probability of event i, Li = potential loss from event i; used for estimating expected economic loss per year.
- Recurrence interval (Return period) R = (N + 1) / m — N = number of years of record, m = rank of an event (used for floods and extreme events).
- Mortality rate = (Number of deaths / Population) × 1,000 (or ×100,000) — quantifies deaths relative to population size.
- GDP loss (%) = (Economic loss due to disaster / National GDP) × 100 — expresses economic impact as percent of GDP.
- Earthquake energy magnitude relation: log10 E (joules) ≈ 4.8 + 1.5 × M — where M is magnitude; links magnitude to released energy (useful to compare potential environmental impact).
Key Concepts
- Natural Hazard
- A naturally occurring physical event or process that has the potential to cause loss of life, injury, property damage, or environmental degradation.
- Disaster
- A serious disruption of the functioning of a community or society causing widespread human, material, economic or environmental losses that exceed the affected community's ability to cope using its own resources.
- Vulnerability
- The susceptibility of a community, system or asset to the impacts of hazards, determined by physical, social, economic and environmental factors.
- Risk
- The combination of the probability of a hazardous event and its negative consequences (impact), often expressed as Risk = Hazard × Vulnerability × Exposure.
- Exposure
- The presence of people, property, infrastructure, and systems in locations that could be adversely affected by hazards.
- Resilience
- The ability of a society, community or system to resist, absorb, adapt to and recover from the effects of a hazard in a timely and efficient manner.
- Mitigation
- Measures taken to reduce the severity or likelihood of hazard impacts, including structural and non-structural actions.
- Preparedness
- Activities and measures taken in advance to ensure effective response to the impact of hazards, such as planning, training and resource stockpiling.
- Response
- Immediate actions taken during and after a hazard event to save lives, reduce health impacts, ensure public safety and meet basic subsistence needs.
- Recovery
- Longer-term activities to restore services, rebuild infrastructure, rehabilitate communities and reduce future risk after a disaster.
- Early Warning System
- A set of capacities needed to generate and disseminate timely and meaningful warning information to enable individuals and communities to take protective actions.
- Hazard Mapping
- The process of identifying and visually representing areas prone to specific hazards to inform planning and risk reduction.
- Hazard Profile
- A summary of a hazard's characteristics such as frequency, magnitude, duration, spatial extent and speed of onset to guide preparedness and mitigation.
- Earthquake
- A sudden shaking of the ground caused by the abrupt release of energy in the Earth's crust, generating seismic waves.
- Tsunami
- A series of large ocean waves generated by undersea earthquakes, volcanic eruptions or landslides that can inundate coastal areas.
- Cyclone
- A large scale, low-pressure atmospheric system with strong winds and heavy rain; in different regions called hurricanes or typhoons.
- Flood
- An overflow of water onto normally dry land, caused by heavy rainfall, river overflow, dam failure or storm surge.
- Drought
- A prolonged period of below-average precipitation resulting in water scarcity, crop failure and socio-economic stress.
- Landslide
- The movement of rock, earth or debris down a slope due to gravity, often triggered by heavy rain, earthquakes or human activity.
- Volcanic Eruption
- The expulsion of magma, ash, gas and pyroclastic material from a volcano, posing hazards like lava flows, ashfall and lahars.
End-of-Chapter Trial Paper & Test Questions
Topic-wise questions to test your understanding of every concept in this chapter.
-
Differentiate between a hazard and a disaster with an Indian example. / आपदा-संकट (हैजर्ड) एवं आपदा (डिजास्टर) में एक भारतीय उदाहरण सहित अंतर कीजिए।
Show answer
A hazard is a potentially damaging physical event, whereas a disaster is the realisation of that hazard overwhelming local coping capacity and causing serious loss; for example, heavy monsoon rainfall (hazard) became the 2018 Kerala floods disaster when it inundated populated basins. / आपदा-संकट एक संभावित हानिकारक भौतिक घटना है, जबकि आपदा उस संकट का साकार होना है जो स्थानीय सामना-क्षमता को अभिभूत कर गंभीर हानि पहुँचाता है; उदाहरणार्थ, भारी मानसून वर्षा (संकट) 2018 की केरल बाढ़ आपदा बन गई जब इसने आबाद बेसिनों को जलमग्न किया।
-
Classify natural hazards by their physical nature, giving one example of each. / प्राकृतिक संकटों को उनके भौतिक स्वरूप के आधार पर वर्गीकृत कीजिए, प्रत्येक का एक उदाहरण दीजिए।
Show answer
Geophysical (earthquake), hydrological (flood), meteorological (cyclone), climatological (drought) and biological (epidemic) are the main physical categories of natural hazards. / भूभौतिक (भूकंप), जलीय (बाढ़), मौसमी (चक्रवात), जलवायवीय (सूखा) तथा जैविक (महामारी) प्राकृतिक संकटों की मुख्य भौतिक श्रेणियाँ हैं।
-
Distinguish between the magnitude and intensity of an earthquake. / भूकंप के परिमाण (मैग्निट्यूड) एवं तीव्रता (इंटेंसिटी) में अंतर कीजिए।
Show answer
Magnitude is a single number quantifying the total energy released by an earthquake, while intensity describes the strength of shaking and its effects at a particular place, varying with distance and site, measured by scales such as Modified Mercalli. / परिमाण एक एकल संख्या है जो भूकंप द्वारा मुक्त कुल ऊर्जा को मापती है, जबकि तीव्रता किसी विशेष स्थान पर कंपन की प्रबलता एवं उसके प्रभावों का वर्णन करती है, जो दूरी एवं स्थल के साथ बदलती है तथा संशोधित मरकैली जैसे पैमानों से मापी जाती है।
-
Why do tsunamis travel fast in the deep ocean yet cause huge run-up at the coast? Use the relevant formula. / सुनामी गहरे महासागर में तीव्र क्यों चलती है फिर भी तट पर विशाल आरोहण क्यों करती है? संबंधित सूत्र का उपयोग कीजिए।
Show answer
Tsunami speed follows c = √(g·h), so in deep water (large h) it travels very fast with small amplitude; as it nears shore h decreases, the wave slows and, to conserve energy flux, its height increases sharply (shoaling), causing large run-up. / सुनामी की चाल c = √(g·h) के अनुसार होती है, अतः गहरे जल (बड़ा h) में यह छोटे आयाम के साथ अत्यंत तीव्र चलती है; तट के निकट h घटने पर तरंग धीमी होती है और ऊर्जा फ्लक्स संरक्षित रखने हेतु इसकी ऊँचाई तीव्रता से बढ़ती है (शोलिंग), जिससे विशाल आरोहण होता है।
-
List the conditions required for the formation of a tropical cyclone. / उष्णकटिबंधीय चक्रवात के निर्माण हेतु आवश्यक दशाओं की सूची बनाइए।
Show answer
A tropical cyclone needs warm sea surface temperature (above about 26–27°C), a pre-existing low-level disturbance, weak vertical wind shear, sufficient Coriolis force (usually beyond 5° latitude) and high mid-tropospheric humidity. / उष्णकटिबंधीय चक्रवात हेतु आवश्यक हैं गर्म समुद्र सतह तापमान (लगभग 26–27°C से अधिक), पूर्व-विद्यमान निम्न-स्तरीय विक्षोभ, दुर्बल ऊर्ध्वाधर पवन अपरूपण, पर्याप्त कोरिऑलिस बल (प्रायः 5° अक्षांश से परे) तथा उच्च मध्य-क्षोभमंडलीय आर्द्रता।
-
Calculate the return period of a flood that ranks 3rd largest in a 59-year record, and state its annual exceedance probability. / 59-वर्षीय अभिलेख में तीसरी सबसे बड़ी रैंक वाली बाढ़ का पुनरावृत्ति काल ज्ञात कीजिए तथा उसकी वार्षिक अतिक्रमण प्रायिकता बताइए।
Show answer
Return period T = (n+1)/m = (59+1)/3 = 20 years; annual exceedance probability p = 1/T = 1/20 = 0.05 or 5%. / पुनरावृत्ति काल T = (n+1)/m = (59+1)/3 = 20 वर्ष; वार्षिक अतिक्रमण प्रायिकता p = 1/T = 1/20 = 0.05 अर्थात 5%।
-
Explain the four phases of the disaster management cycle. / आपदा प्रबंधन चक्र के चार चरणों को समझाइए।
Show answer
The phases are mitigation/prevention (long-term reduction of vulnerability through land-use planning and building codes), preparedness (early warning, drills, evacuation plans), response (immediate search, rescue and relief), and rehabilitation/reconstruction (restoring services and rebuilding with improved resilience). / चरण हैं शमन/रोकथाम (भूमि-उपयोग नियोजन एवं भवन संहिताओं द्वारा दीर्घकालिक भेद्यता न्यूनीकरण), तैयारी (पूर्व चेतावनी, अभ्यास, निकासी योजनाएँ), प्रतिक्रिया (तत्काल खोज, बचाव एवं राहत), तथा पुनर्वास/पुनर्निर्माण (सेवाओं की बहाली एवं उन्नत समुत्थानशीलता के साथ पुनर्निर्माण)।
-
Differentiate between meteorological drought and hydrological drought. / मौसमी सूखा एवं जलीय सूखा में अंतर कीजिए।
Show answer
Meteorological drought is a deficiency of precipitation below the normal for a region and period, whereas hydrological drought is the resulting reduction in streamflow, reservoir levels and groundwater recharge that follows prolonged precipitation deficits. / मौसमी सूखा किसी क्षेत्र एवं अवधि के सामान्य से कम वर्षा की कमी है, जबकि जलीय सूखा लंबे वर्षा अभाव के बाद होने वाली धारा-प्रवाह, जलाशय स्तर एवं भूजल पुनर्भरण में परिणामी कमी है।
Related Laws & Principles
Explore allFoundational laws & principles behind this chapter. Each one opens a full page — what it says, why it matters, five practice questions and the mistakes to avoid.